Clinical Pharmacology: Advances and Applications
Dove
press
O r i g i n A L r e s e A r C h
open access to scientific and medical research
Open Access Full Text Article
A comparative study of DnA damage in patients
suffering from diabetes and thyroid dysfunction
and complications
nima V Thakkar sunita M Jain
Department of Pharmacology, L.M. College of Pharmacy, Ahmedabad, gujarat, india
Correspondence: sunita M Jain Department of Pharmacology, L.M. College of Pharmacy, gujarat University, navarangpura, Ahmedabad, 380009, india Fax +91 94 2617 3029
email [email protected]
Objective: The apoptotic DNA levels in blood leukocytes of patients with type 2 diabetes (T2D) and thyroid dysfunctionism were evaluated.
Materials and methods: Single-cell gel electrophoresis (comet assay) detects migration of DNA from individual cell nuclei following alkaline treatment. Comet assay pattern was studied in individuals with T2D, hypothyroid (HT), hyperthyroid (HeT), and patients suffering from both diabetes mellitus and HT (HT + DM). Results were compared with the normal subjects (n = 9 in each group). The percentage apoptotic cell populations were calculated from the tail length.
Results: T2D patients showed 92.24% of cell damage compared to HT or HeT patients (51.04% or 54.64%, respectively). Further, increase in cell damage was also observed in HT + DM sub-jects (P , 0.05). Pharmacologic therapy significantly influenced cell damage. However, age and duration of disease did not show any definite influence on apoptosis.
Conclusion: Dependence of disease seems to be the major contributor of the cell damage. However, thyroid dysfunction did not show any deleterious effects on individual cells under the study.
Keywords: comet assay, type 2 diabetes, hypothyroid, apoptosis
Introduction
Apoptosis is an important and inevitable event in the remodeling of tissues during development and aging.1 In most postreplicating cells, the rate of apoptosis increases
with age and thus may be a contributor in many age-related diseases.2,3 Nucleic acid
levels are generally low in the plasma of healthy adults due to rapid clearance by the liver, kidneys, and lymphoid cells, but they increase with age.4–7 The elevation of
cell-free nucleic acids and condensed nuclear fragments (nucleosomes) in plasma may be due to necrotic and apoptotic cells, release from nondividing cells, or inefficient clearance.8
Type 2 diabetes (T2D) accounts for most individuals with nonautoimmune forms of diabetes. The spectacular increase in prevalence of T2D worldwide is well documented.9 Apoptosis appears to play a role in the initiation of diabetes mellitus
and the complications manifested in the vasculature, brain, heart, kidneys, joints, and eyes.10 Thyroid tumors are the most common endocrine malignancy, accounting
for approximately 1% of all malignant diseases and about 0.4% of deaths related to cancer.11 Hypothyroidism and hyperthyroidism affect the metabolism rate and thereby
mitochondrial function. Elevated DNA damage levels or unrepaired DNA damage and suboptimal DNA repair may cause mutations that contribute to dysfunctioning of the thyroid gland.12
Clinical Pharmacology: Advances and Applications downloaded from https://www.dovepress.com/ by 118.70.13.36 on 21-Aug-2020
For personal use only.
Number of times this article has been viewed
This article was published in the following Dove Press journal: Clinical Pharmacology: Advances and Applications
Dovepress
Thakkar and Jain
Both insulin and thyroid hormones are intimately involved in cellular metabolism and excess or deficit of either of these hormones could result in the functional derangement of the other.13 Symptoms of hypothyroidism are common in patients
with T2D, and symptoms of hyperthyroidism may be attributed to poor diabetes control in patients with type 1 diabetes.14,15
The single-cell gel electrophoresis technique or comet assay is widely regarded as a quick and reliable method of analyzing DNA damage in individual cells.16 DNA strand
breaks allow DNA to extend from lysed and salt-extracted nuclei, or nucleoids, to form a comet-like tail on alkaline electrophoresis. The comet assay, a technique, capable of detecting DNA damage and repair in individual cells, is a valuable approach for human biomonitoring studies.17 Cells
undergoing active cell death or apoptosis demonstrate highly fragmented DNA. Apoptosis results in the extensive forma-tion of double-strand breaks and is readily detected using alkaline electrophoretic conditions. When viewed using the comet assay, only a small percentage of DNA of an apoptotic cell remains associated with the comet head.18,19
In the present study, DNA damage in subjects with T2D and/ or thyroid dysfunctioning was assessed with the help of alkaline comet assay. Secondly, the impact of pharmacological therapy upon the study population was also analyzed. Apoptosis and overall extent of damage in individual cells were assessed.
Materials and methods
Chemicals’ purchase
Low-melting point agarose (LMPA), normal melting agarose (NMA), Triton X-100, and phosphate-buffered saline (PBS; Ca++, Mg++ free) were purchased from HiMedia Pvt.
Labora-tories (Mumbai, India). All other chemicals available were of the highest purity.
Patients
The protocol for the present study was approved by the Human Ethics Committee of L.M. College of Pharmacy, Ahmedabad. All subjects were given verbal and written information about the study prior to providing written consent.
Venous blood samples were drawn by a research nurse from all subjects. Two milliliters of blood samples were collected. A total of 45 subjects of different groups viz, normal, hypothy-roid (HT), hyperthyhypothy-roidism (HeT), diabetes mellitus (DM), and both diabetes and HT complications together (HT + DM) were enrolled in the present study (n = 9 in each group).
Pharmacological treatment profile
All the subjects of different groups received their relevant treat-ment as follows: HT and HeT groups received levothyroxine
and neomercazole® therapy, respectively; subjects with T2D
received sulphonamides and/or insulin to control blood glucose levels; and all the subjects with HT + DM received sulphonamides and levothyroxine treatment.
Methodology
Biochemical investigations
Biochemical investigations were determined after a 10-hour overnight fast. Fasting blood sugar (FBS) concentration was measured by finger stick with a glucometer (LifeS-can One touch Ultra; Johnson and Johnson Limited, New Brunswick, NJ). Serum concentrations of triiodothyronine (T3), thyroxine (T4), and thyroid stimulating hormone (TSH) were measured by enzymatic electrochemilumi-nescence immunoassay method (Abbott Architect i2000; Abbott Laboratories, Abbott Park, IL). Total cholesterol (TC) was measured by direct enzymatic method on OLYM-PUS AU-400 (Olympus Diagnostics, Tokyo, Japan). 1. Preparation of base slide: Half-frosted slides were dipped
into 1% NMA (prepared in MilliQ water), underside of the slide was wiped, and slide was laid on flat surface to dry (first layer).
2. Cell treatment: To the coated slide, 75 µL of 0.5% LMPA (prepared in PBS; Ca++, Mg++ free) and 10 µL of blood
samples were added. The agarose layer was allowed to harden (second layer). The third agarose layer with 80 µL of 0.5% LMPA then followed (third layer). Slides were kept in the lysing solution (2.5 M sodium chloride, 100 mM EDTA, 10 mM Trizma base, 1% Triton X-100, and 10% dimethyl sulfoxide were added freshly) at 4°C overnight.
3. Electrophoresis of microgel slides: Electrophoresis was carried under alkaline conditions (pH . 13). After lysis, slides were kept in electrophoresis chamber (Genei Equip-ments, Bangalore, India) containing electrophoresis buffer (30 mL of 10 N sodium hydroxide, 5 mL of 200 mM EDTA quantity sufficient [q.s.] to 1,000 mL; pH . 13). Slides were allowed to sit in alkaline buffer for 20 minutes to allow unwinding of DNA and the expression of alkali-labile dam-age. Slides were electrophoresed for 30 minutes with the power supply of 24 V and current to 300 mA. Slides were lifted off the chamber and coated with neutralization buffer (0.4 M Tris in dH2O; pH = 7.5). Slides were then stained with 80-µL 1× ethidium bromide and observed under 20× fluorescent microscope. In addition to this, age, duration of disease conditions, and glucose and thyroid hormone levels were also considered, and distribution was measured accordingly as they do contribute to DNA damage.
Clinical Pharmacology: Advances and Applications downloaded from https://www.dovepress.com/ by 118.70.13.36 on 21-Aug-2020
Dovepress DnA damage in diabetes and thyroid dysfunction
statistics
Instat 3 (GraphPad Inc., La Jolla, CA) was used for the analysis. Kruskal–Wallis’ test (nonparametric analysis of variance) was applied. Tukey–Kramer’s multiple comparison test was then followed. A value of P , 0.05 was considered as statistically significant. Pearson’s correlation coefficient (r) was calculated to find the correlation between two variables. Multiple linear regression was analyzed to study the correlation pattern in different groups.
Results
Biochemical investigations of all the subjects are listed in Table 1. As can be seen from Table 1, fasting blood glucose levels were found to be raised in T2D group of subjects (133 ± 6.61) and HT + DM group of subjects (116.78 ± 5.54) when compared with the normal group of subjects (88.85 ± 2.21; P , 0.001). Serum TC and TSH levels were found to be high in HT subjects compared with other groups under study (P , 0.05).
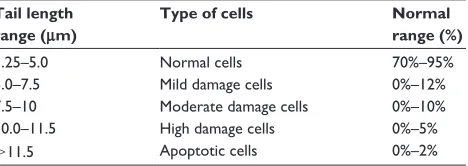
Slides were subjected to analysis with the help of Comet score 15 image analysis software (TriTek Corp., Sumerduck, VA) (Figure 1). Tail length was measured in
100 cells. Average number of cells falling in the given range was calculated for 100 cells in each duplicated slide. Percentage population of damaged cells was then calculated to get the individual subject’s value for each cell (Table 2).
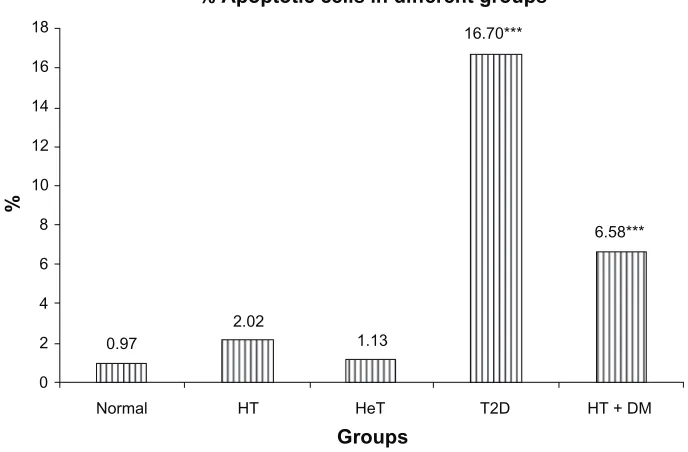
According to the disease condition, specific pattern of comet assay generated in terms of extent of damage in cells has been displayed in Figure 2. T2D group showed total of 92.24% of cell damage. Cell damage in HT + DM group of subjects was found 95.65%, which could be due to additional effect of thyroid dysfunction. However, presence of apoptotic cells was found significantly high in T2D subjects (16.70%) as compared with 6.58% in HT + DM subjects (Figure 3). How-ever, the thyroid hormone levels showed negative correlation with the apoptotic cells (r =−0.23 and −0.09 for T3 and T4, respectively). This reflected that thyroid hormone changes do not significantly affect the DNA damage (which is measured in terms of apoptotic cells).
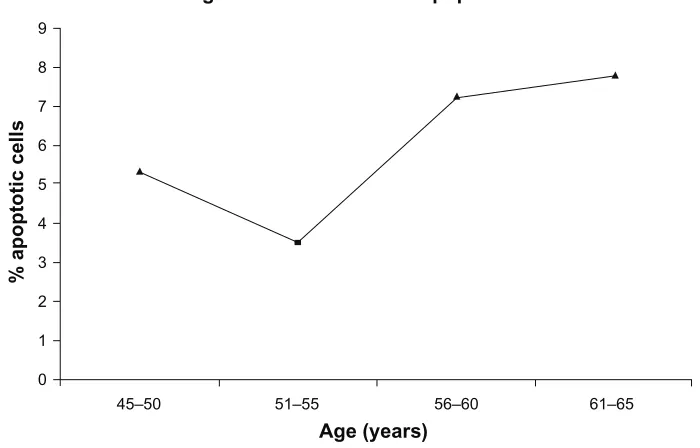
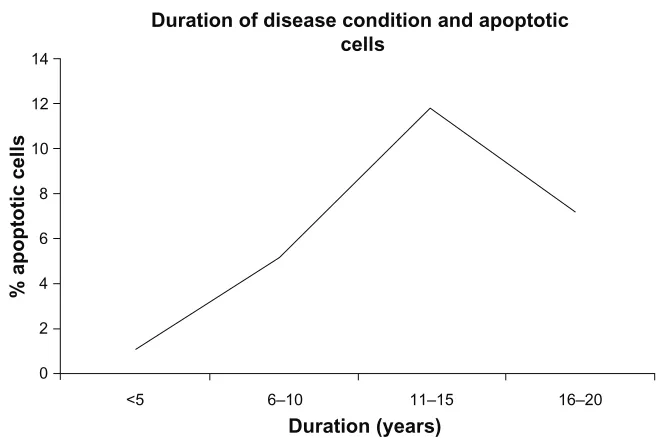
In addition, we have shown Pearson’s correlation coefficient (r) among apoptotic cells, FBS, and thyroid hormone levels (Table 3). There was significant correlation observed between apoptotic cells and FBS (r = 0.78; P , 0.001). Further, our data were also stratified based on age and duration of disease conditions (Figures 4 and 5). However, no correlation was observed with reference to these two factors. Thus, it is clear from our observations that these two factors may not contribute any significant role in cellular damage.
Discussion
The importance of studying apoptosis in aging and age-related disorders has been recognized by many scientists.20–22
Table 1 Biochemical investigations
Parameters Normal HT HeT T2D HT + DM
FBs (mg/dL) 88.85 ± 2.21 88.89 ± 2.04 86.56 ± 3.22 133 ± 6.61a 116.78 ± 5.54a TC (mg/dL) 128.67 ± 13.31 256.94 ± 27.59a 154.57 ± 6.09 162.22 ± 17.05 181.28 ± 19.12a Tsh (miU/L) 3.31 ± 0.28 8.56 ± 1.70a 1.24 ± 0.35 3.83 ± 0.41 3.72 ± 0.32 serum T3 (ng/dL) 4.07 ± 0.63 1.80 ± 0.52 11.54 ± 5.04 1.3 ± 0.18 2.74 ± 0.92 serum T4 (µg/dL) 12.12 ± 1.04 7.54 ± 0.74a 15.13 ± 1.23 9.15 ± 0.83 8.77 ± 1.44
Note:aP, 0.05, when compared with the normal group (n = 9 in each group). All the results are shown as mean ± standard error of the mean.
Abbreviations: hT, hypothyroid subjects; heT, hyperthyroid subjects; T2D, type 2 diabetic patients; hT + DM, diabetic hypothyroid patients; FBs, fasting blood sugar; TC, total cholesterol; Tsh, thyroid stimulating hormone; T3, triiodothyronine; T4, thyroxine.
Figure 1 Cells under fluorescent microscope. Image shows cellular effects under 20× fluorescent microscope when stained with ethidium bromide.
Table 2 Tail length and cellular definition
Tail length range (μm)
Type of cells Normal range (%)
1.25–5.0 normal cells 70%–95%
5.0–7.5 Mild damage cells 0%–12%
7.5–10 Moderate damage cells 0%–10%
10.0–11.5 high damage cells 0%–5%
.11.5 Apoptotic cells 0%–2%
Clinical Pharmacology: Advances and Applications downloaded from https://www.dovepress.com/ by 118.70.13.36 on 21-Aug-2020
Dovepress
Thakkar and Jain
Comet assay pattern
%
100
90
80
70
60
50
40
30
20
10
0
NORMAL HT HeT T2D HT + DM
Apoptotic cells High damage
Moderate damage
Mild damage
Normal cells
Figure 2 Comparison between disease condition and comet assay. Note: Allresults are shown in terms of percentage, n = 9 in each group.
Abbreviations: hT,hypothyroid patients; heT, hyperthyroid patients; T2D, type 2 diabetic patients; hT + DM, diabetic hypothyroid patients.
Subjects with both diabetes and/or thyroid dysfunctioning were included in the present study.
There is a report of direct relationship between the glu-cose level and amount of apoptosis in diabetic subjects.23
Therefore, the detection of high levels of apoptotic DNA in T2D individuals under the present study might be associated with secondary symptoms of microvascular complications,
although there was lower probability of cell damage observed in HT and HeT subjects. In contrast to this, elevated plasma DNA levels and antibodies to DNA have been reported in thyroiditis condition.24,25
Age and long duration of disease are two such factors which contribute to the development of DNA damage and thereby cell damage.7,10 Hence, an effort was made to find
% Apoptotic cells in different groups
Groups
%
18
16
14
12
10
8
6
4
2
0
0.97
2.02
1.13
Normal HT HeT T2D
16.70***
6.58***
HT + DM
Figure 3 A comparison between disease condition and apoptotic cells.
Note: resultsare shown in %, n = 9 in each group. All groups were compared with the normal group. P, 0.05 was considered as statistically significant. ***P< 0.001; statistically significant difference from controls.
Abbreviations: hT,hypothyroid patients; heT, hyperthyroid patients; T2D, type 2 diabetic patients; hT + DM, diabetic hypothyroid patients.
Clinical Pharmacology: Advances and Applications downloaded from https://www.dovepress.com/ by 118.70.13.36 on 21-Aug-2020
Dovepress DnA damage in diabetes and thyroid dysfunction
Age-wise distribution of apoptotic cells
Age (years)
% apoptotic cell
s
9
8
7
6
5
4
3
2
1
0
45–50 51–55 56–60 61–65
Figure 4 Correlation between age and % apoptotic cells.
Note: Allresults are shown in % apoptotic cells, n = 9 in each group, r = 0.534, that is statistically insignificant.
Table 3 Correlations between apoptotic cells and biochemical parameters
Parameters Correlation coefficient P value
FBs 0.783*** ,0.001
T4 −0.09 0.5519
T3 −0.23 0.4489
TC −0.03 0.8040
Tsh −0.04 0.7829
Note: Pearson’s correlation coefficient and P value have been summarized in the Table. 0 = no correlation, 1 = 100% correlation, and negative value indicates inverse correlation. P, 0.05 was considered as statistically significant. ***P< 0.001; statistically significant difference from controls.
Abbreviations: FBs, fasting blood sugar; T4, thyroxine; T3, triiodothyronine; TC, total cholesterol; Tsh, thyroid stimulating hormone.
processes.27 Kang et al28 have reported antiapoptotic action
of insulin that is related to the reduction of reactive oxygen species. Further, Yamashita29 already reported decrease
in TSH levels with levothyroxine returned the antiapop-totic property of thyroid cells. Neomercazole, being an antithyroid drug, normalizes the basal metabolic rate and thereby reset the cellular apoptosis. Thus, depending upon the pharmacological drug profile of our subjects, role of glibenclamide in inducing and levothyroxine in delaying progression of cell death can not be ruled out at this point of time.
Thus, the present study may help us to identify the extent of cellular damage in individuals suffering from any of the metabolic abnormalities. It can also help to identify the effect of the medication on reactive oxygen species generation and thereby DNA damage. However, this study is associated with certain limitations as comet assay can not differentiate two disease conditions and the status of disease progression.
Conclusion
Our study rules out the dependence of age and duration of disease condition on cellular damage, although dependence of disease conditions seems to be a major contributor of the cell damage as indicated by increase in the percentage of apoptotic cells in diabetic subjects. However, further study is needed to understand the molecular-level mechanisms to establish correlation amongst this population.
the age and duration of disease-dependant distribution of comet assay. However, we could not establish any cor-relation with these two factors. But, our study is more likely to be dependant on disease type, particularly, diabetic individuals who are as such more susceptible to DNA damage and eventually apoptosis. This hypothesis is further supported by our results of correlation coef-ficient among apoptotic cells, FBS, and thyroid hormone levels. We strongly confirm and recommend the relation between diseases like T2D and apoptosis based on an r value of 0.0783.
Therapeutic influence may play a role in free radical generation and thereby leading to apoptosis progression. Tolbutamide, a current drug for treating T2D has been shown to trigger apoptosis in pancreatic β cells.26 Glibenclamide
has also been reported to be an inducer of apoptotic
Clinical Pharmacology: Advances and Applications downloaded from https://www.dovepress.com/ by 118.70.13.36 on 21-Aug-2020
Dovepress
Thakkar and Jain
Acknowledgments
Funding was received from Rameshwardasji Birla Smarak Kosh, Medical Research Centre, Bombay Hospital Avenue, Mumbai 400 020, India. The authors acknowledge the staff of Gujarat Endocrine Centre, Ahmedabad, especially the guid-ance of Dr. Parag Shah MD, DM, DNB (Endocrinology) with-out whose support this work would not have been possible, the authors are also highly thankful to the staff of National Institute of Occupational Health (NIOH), Ahmedabad, for providing guidance to learn comet assay techniques.
Disclosure
The authors report no conflicts of interest in this work.
References
1. Wangenheim KH, Peterson HP. Control of cell proliferation by progress in differentiation: clues to mechanisms of aging, cancer causation and therapy. J Theor Biol. 1998;193:663–678.
2. Sabbah HN, Sharov VG. Apoptosis in heart failure. Prog Cardiovasc
Dis. 1998;40:549–562.
3. Singhal PC, Reddy K, Franki N, et al. Age and sex modulate renal expression of SGP-2 and transglutaminase and apoptosis of splenocytes, thymocytes and macrophages. J Invest Med. 1997;45:567–575. 4. Bennett RM, Gabor GT, Merritt MM. DNA binding to human
leuco-cytes. Evidence for a receptor-mediated association, internalization and degradation of DNA. J Clin Invest. 1985;76:2181–2190.
5. Lo YMD, Zhang J, Leung TN, Lau TK, Chang AM, Hjelm NM. Rapid clearance of fetal DNA from plasma. Am J Hum Genet. 1999;64:218–224.
6. Scott RS, McMahon EJ, Pop SM, et al. Phagocytosis and clear-ance of apoptotic cells is mediated by MER. Nature. 2001;411: 207–211.
7. Fournie GJ, Martres F, Pourrat JP, Alary C, Remeau M. Plasma DNA as cell death marker in elderly patients. Gerontology. 1993;39:215–221.
8. Stroun M, Lyautey J, Lederrey C, Olson-Sand A, Anker P. About the possible origin and mechanism of circulating DNA apoptosis and active DNA release. Clin Chim Acta. 2001;313:139–142.
9. Bertoni AG, Clark JM, Feeney P, et al. Suboptimal control of glycemia, blood pressure, and LDL cholesterol in overweight adults with diabetes: the Look AHEAD study. J Diab Comp. 2008;22:1–9.
10. Ohsako S, Elkon KB. Apoptosis in the effecter phase of autoim-mune diabetes, multiple sclerosis and thyroiditis. Cell Death Differ. 1999;6:13–21.
11. Trimboli P, Ulisse S, Graziano FM, et al. Trend in thyroid carcinoma size, age at diagnosis, and histology in a retrospective study of 500 cases diagnosed over 20 years. Thyroid. 2006;16;1151–1155. 12. Undeger U, Sahin TT, Yuksel O, et al. Assessment of DNA damage
in peripheral blood lymphocytes from patients with benign and malignant thyroid disorders. Hacettepe Univ J Fac Pharm. 2008; 28(1):1–14.
13. Satish R, Mohan V. Diabetes and thyroid diseases: a review. Int J
Diabetes Dev Ctries. 2003;23 Suppl 4:120–123.
14. Hanukoglu A, Mizrachi A, Alian D, Adomni A, Zvy B, Sonnekh E. Extrapancreatic autoimmune manifestations in type 1 diabetes patients and their first degree. Diabetes Care. 2003;26 Suppl 4:1235–1240.
15. Wu P. Thyroid disease and diabetes. Clinl Diabetes. 2000;18 Suppl 1: 11–14.
16. McArt DG, McKerr G, Howard CV, Saetzler K, Wasson GR. Modelling the comet assay. Biochem Soc Trans. 2009;37(Pt 4): 914–917.
17. Kassie F, Parzefall W, Knasmuller S. Single cell gel electrophoresis assay: a new technique for human biomonitoring studies. Mutat Res. 2000;463:13–31.
18. Olive PL, Durand Re, LeRiche J, Olivotto I, Jackson SM. Gel electro-phoresis of individual cells to quantify hypoxic fraction in human breast cancers. Cancer Res. 1993;53:733–736.
19. Gopalkrishna P, Khar A. Comet assay to measure DNA dam-age in apoptotic cells. J Biochem Biophys Methods. 1995;30: 69–73.
20. Orrenius S. Apoptosis: molecular mechanisms and implications for human disease. J Intern Med. 1995;237:529–536.
21. Warner HR, Hodes RJ, Pocinki K. What does cell death have to do with aging? J Am Geriat Soc. 1997;45:1140–1146.
Duration of disease condition and apoptotic cells
Duration (years)
% apoptotic cells
14
10 12
8
6
4
2
0
<5 6–10 11–15 16–20
Figure 5 Correlation between duration of disease condition and % apoptotic cells. Note: Allresults are shown in % apoptotic cells, n = 9 in each group.
Clinical Pharmacology: Advances and Applications downloaded from https://www.dovepress.com/ by 118.70.13.36 on 21-Aug-2020
Clinical Pharmacology: Advances and Applications
Publish your work in this journal
Submit your manuscript here: http://www.dovepress.com/clinical-pharmacology-advances-and-applications-journal
Clinical Pharmacology: Advances and Applications is an international, peer-reviewed, open access journal publishing original research, reports, reviews and commentaries on all areas of drug experience in humans. The manuscript management system is completely online and includes a very quick and fair peer-review system, which is all easy to use.
Visit http://www.dovepress.com/testimonials.php to read real quotes from published authors.
Dovepress
Dove
press
DnA damage in diabetes and thyroid dysfunction
22. Tomei LD, Umansky SR. Aging and apotosis control. Neurol Clin. 1998;16:735–745.
23. Langford MP, Redens TB, Harris NR, et al. Plasma level of cell free apoptotic DNA ladders and gamma-glutamyltranspeptidase in diabetic children. Exp Biol Med. 2007;232:1160–1169.
24. Ohsako S, Elkon KB. Apoptosis in the effector phase of autoim-mune diabetes, multiple sclerosis and thyroiditis. Cell Death Differ. 1999;6:13–21.
25. Kotani T, Aratake Y, Hirai K, Fukazawa Y, Sato H, Ohtaki S. Apoptosis in thyroid tissue from patients with Hashimotto’s thyroiditis.
Autoim-munity. 1995;20:231.
26. Efanova IB, Zaitsev SV, Zhivotovsky B, et al. Glucose and tolbutamide
induce apoptosis in pancreatic β cells. A process dependent on
intracel-lular Ca+2 concentration. J Biol Chem. 1998;273:33501–33507.
27. Hambrock A, Oliveira Franz CB, Hiller S, Osswald H. Glibencl-amide induced apoptosis is specifically enhanced by expression of the sulphonylurea receptor isoform SUR1 but not by expression of SUR2B or the mutant SUR1(M1289T). J Pharmacol Exp Therap. 2006;316:1031–1037.
28. Kang S, Song J, Kang H, Kim S, Lee Y, Park D. Insulin can block apop-tosis by decreasing oxidative stress via phosphatidylinositol 3-kinase and extracellular signal regulated protein kinase dependant signaling pathways in HepG2 cells. Eur J Endocrinol. 2003;148:147–155. 29. Yamashita S. Endocrine disease and apoptosis. Intern Med.
1998;37(2):194–197.
Clinical Pharmacology: Advances and Applications downloaded from https://www.dovepress.com/ by 118.70.13.36 on 21-Aug-2020