Developing
a
monitoring
system
for
Cloud-based distributed data-centers
Domenico Elia1, Gioacchino Vino1,*, Giacinto Donvito1 and Marica Antonacci1
1INFN Bari, Via E. Orabona 4 - 70126 Bari, Italy
Abstract.Nowadays more and more datacenters cooperate each others to achieve a common and more complex goal. New advanced functionalities are required to support experts during recovery and managing activities, like anomaly detection and fault pattern recognition. The proposed solution provides an active support to problem solving for datacenter management teams by providing automatically the root-cause of detected anomalies. The project has been developed in Bari using the datacenter ReCaS as testbed. Big Data solutions have been selected to properly handle the complexity and size of the data. Features like open source, big community, horizontal scalability and high availability have been considered and tools belonging to the Hadoop ecosystem have been selected. The collected information is sent to a combination of Apache Flume and Apache Kafka, used as transport layer, in turn delivering data to databases and processing components. Apache Spark has been selected as analysis component. Different kind of databases have been considered in order to satisfy multiple requirements: Hadoop Distributed File System, Neo4j, InfluxDB and Elasticsearch. Grafana and Kibana are used to show data in a dedicated dashboards. The Root-cause analysis engine has been implemented using custom machine learning algorithms. Finally, results are forwarded to experts by email or Slack, using Riemann.
1
Introduction
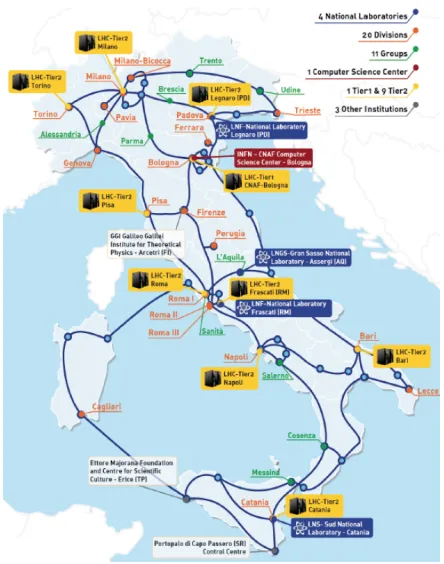
Nowadays, data centers are increasing in complexity by utilizing different technologies together in order to accomplish more and more ambitious goals. Beside such increase in complexity, different data-centers need to join a common distributed network which allows them to target activities far beyond those usually relying on the computing resources of a (even large) single datacenter. An example is the Italian datacenter collaboration network shown in the Figure 1.
Not conventional tools are required to monitoring the overall datacenter network and new advanced functionalities are required to support experts during recovery and managing activities, like anomaly detection and fault pattern recognition. Such features can be implemented with specific machine learning and graph algorithms. The proposed solution
provides proactive support to the management of a datacenter network by classifying and organizing collected monitored data in order to detect the preliminary phases of known malfunctions and to provide an active support to speed up the recovery activities. Specific tools are been selected to make the proposed solution fault-tolerant, horizontally scalable and modular.
Figure 1. Datacenter collaboration network in Italy.
2
Monitoring Data Selection
Relevant effort has been put into the selection of the information to be gathered from the monitored items since the quality of the results produced by the machine learning algorithms strictly depends on the input monitoring information. Heterogeneous and fully informative data have been collected for the following source categories:
● Services (HTTP Servers, DBs); ● Middleware and Cloud platform layer;
● Hardware layer (physical servers, network devices, disk controllers).
Service malfunctions could be detected using the first source category but this information alone does not allow to figure out the root causes. Middleware and hardware monitoring data could fill this information gap. As an example, the proposed solution must have all the needed information to detect a database malfunction caused by a virtual machine error, in turn this being due to a disk controller fault.
3
Architecture
As testbed for the project development the ReCaS Bari datacenter[1] has been used. The datacenter includes the Tier2 for the ALICE and CMS experiments at CERN and hosts up to 13,000 cores, 10 PB of disk storage and 2.5 PB tape library.
Monitoring data related to services, virtual machines, physical machines and other hardware devices are extracted from Zabbix[2], the local monitoring system. Openstack[3] is the used cloud platform, so the data provided by Ceilometer and extracted with custom scripts that use Openstack APIs integrates the one collected from Zabbix. Others selected data sources are local batch system, HTCondor[4], and the kernel and service logs.
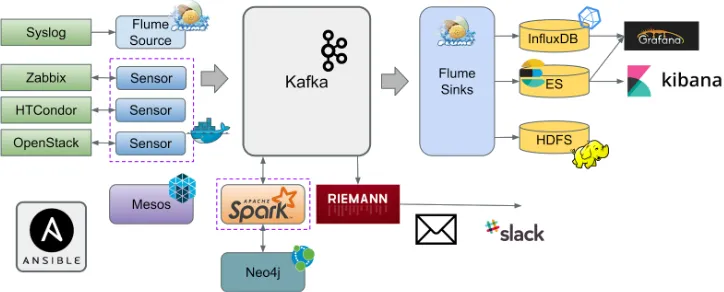
Due to the complexity and size of data, Big Data solutions have been selected. Features like open source, big community, horizontal scalability and high availability have been considered and tools belonging to the Hadoop ecosystem[5] have been selected. Modularity is considered as well, since it gives the possibility to replace one or more of the selected components in case alternative options with better performance or additional functionalities appear. In the Figure 3a schematic view of the used architecture for the proposed project is shown.
Figure 2. Architecture of proposed project.
processing”. It provides both near-real-time and batch processing and allows the execution of different kinds of algorithms thanks to the provided libraries for graph and machine learning processing and to the SQL interfacing. Scala[16] has been selected as programming language for the implementation of algorithms in Spark due its concise notation and allow a faster development, testing and deployment than Java.
Finally, Apache Mesos[17] and Ansible[18] are used to increase the resource utilization efficiency and simplify the tool deployment, respectively.
4
Root Cause Analysis
Usually, service, host or devices malfunctions are evaluated by choosing thresholds for selected metrics: if a specific value fulfills an alarm condition then a notification is sent to an expert and/or a different graphical aspect is used in service/component dashboard. At this point the expert, or its team, using the own experience will try to fix the issue using heterogeneous monitoring data, logs and values, coming from hosts, network devices and physical machines connected to the given malfunction. The goal of the presented project is to offer advanced features allow to automatically recognize anomalies, extract relationships among components, and finally discover the root-cause of a given anomaly. A component with these features is called Root Cause Analysis (RCA).
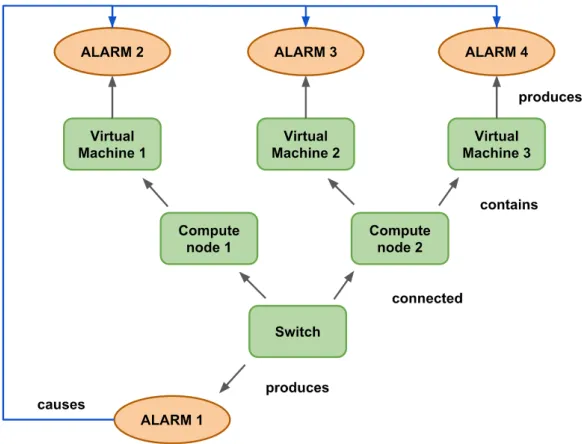
The implemented RCA uses machine learning and graph theory algorithms. It is composed of an event extractor, a graph builder and root-cause extractor. The event extractor algorithm is an incremental Self-Organizing Map that associates points with similar behavior to the same label and marks each label with a critical score: a point belonging to a label with a high critical score generates an event. The graph builder extracts relationships from the monitoring data in order to create the dependency graph. The root cause extractor merges the results produced by the previous components, creates the cause-effect event graph and extracts the root cause. The Figure 2 shows situation where there are multiple produced alarms and the Root Cause Analysis Engine extracts the root cause (ALARM1) that produces the remaining alarms (ALARM2, ALARM3 and ALARM4).
processing”. It provides both near-real-time and batch processing and allows the execution of different kinds of algorithms thanks to the provided libraries for graph and machine learning processing and to the SQL interfacing. Scala[16] has been selected as programming language for the implementation of algorithms in Spark due its concise notation and allow a faster development, testing and deployment than Java.
Finally, Apache Mesos[17] and Ansible[18] are used to increase the resource utilization efficiency and simplify the tool deployment, respectively.
4
Root Cause Analysis
Usually, service, host or devices malfunctions are evaluated by choosing thresholds for selected metrics: if a specific value fulfills an alarm condition then a notification is sent to an expert and/or a different graphical aspect is used in service/component dashboard. At this point the expert, or its team, using the own experience will try to fix the issue using heterogeneous monitoring data, logs and values, coming from hosts, network devices and physical machines connected to the given malfunction. The goal of the presented project is to offer advanced features allow to automatically recognize anomalies, extract relationships among components, and finally discover the root-cause of a given anomaly. A component with these features is called Root Cause Analysis (RCA).
The implemented RCA uses machine learning and graph theory algorithms. It is composed of an event extractor, a graph builder and root-cause extractor. The event extractor algorithm is an incremental Self-Organizing Map that associates points with similar behavior to the same label and marks each label with a critical score: a point belonging to a label with a high critical score generates an event. The graph builder extracts relationships from the monitoring data in order to create the dependency graph. The root cause extractor merges the results produced by the previous components, creates the cause-effect event graph and extracts the root cause. The Figure 2 shows situation where there are multiple produced alarms and the Root Cause Analysis Engine extracts the root cause (ALARM1) that produces the remaining alarms (ALARM2, ALARM3 and ALARM4).
Figure 3. The Root Cause Engine extracts the root cause among a set of alarms.
5 Results
Actually, 22 virtual machines with overall 80 CPUs, 150 GB RAM and 3 TB of disk storage are being used as a testbed. Monitoring data from the selected data sources is collected. Every day more than 4 million log lines are injected using the syslog protocol, Zabbix retrieves more than 40k values every 10 minutes, HTCondor collects more the 750k values every 5 minutes and Openstack samples more than 50k value every hour. This information is stored in a dedicated storage. Logs are sent to the single-node Elasticsearch cluster, configured with a retention policy of 15 days, and HDFS, with 1 year retention policy, whereas Zabbix and HTCondor monitoring data is stored in two different InfluxDB instances, each using an external 50GB volume. From July 2016 to now the disk usage is 9 GB and 15 GB, respectively. Due to the large monitoring data collected from HTCondor, the database is configured with two different retention policies: one-week duration for the raw job information and infinite retention policy containing the HTCondor component monitoring data and the aggregated information computed using data stored in the first retention policy. Several dashboards have been built in Grafana and Kibana: the created graphical interfaces allow to figure out with a glance the datacenter status. If an anomaly behavior is detected, by clicking on graphical objects it’s possible to dive into new more detailed dashboards in order to find manually the root-cause.
6 Conclusion
An advanced monitoring system able to identify autonomously anomalies and their
root-cause has been presented. Big Data solutions have been selected to properly handle the
complexity and size of the data. The ReCaS Bari datacenter has been used as testbed.
Monitoring data from Zabbix, HTCondor, Openstack are collected. Dashboard are provided
to visualize the datacenter, service and component status and to support expert during the
manually discovery of anomaly root-cause. Machine learning and graph algorithms have
been used to implement the Root Cause Analysis that automate the above process. Actually,
the algorithms are under test along with interaction with experts for parameter tuning.
Next steps concern the integration with a project management system, both to import
anomalies from experts and users and to provide additional information to the ticket, and
autonomous actions to execute when selected conditions are fulfilled.
References
1. ReCaS-Bari, URL http://www.recas-bari.it/index.php/it/
2. Zabbix, URL http://www.zabbix.com/ 3. Openstack, URL https://www.openstack.org/
4. HTCondor, URLhttps://research.cs.wisc.edu/htcondor/ 5. Hadoop, URL http://hadoop.apache.org/
6. Apache Kafka, URL https://kafka.apache.org/ 7. Apache Flume, URL https://flume.apache.org/ 8. Hadoop Distributed File System, URL
https://hadoop.apache.org/docs/stable/hadoop-project-dist/hadoop-hdfs/HdfsUserGuide .html
9. Neo4j, https://neo4j.com/
10. InfluxDB, URL https://docs.influxdata.com/influxdb/latest 11. ElasticSearch, URL https://www.elastic.co/
12. Grafana, URL http://grafana.org/
13. Kibana, URL https://www.elastic.co/products/kibana
14. Riemann – A network monitoring system, URL http://riemann.io/ 15. Apache Spark, URL https://spark.apache.org/
16. Scala programming language, URL https://www.scala-lang.org/ 17. Apache Mesos, URL https://mesos.apache.org/