Ryan L. Davis, PhD Christina Liang, MBBS Carolyn M. Sue, MBBS,
PhD
Correspondence to Dr. Sue:
A comparison of current serum biomarkers
as diagnostic indicators of mitochondrial
diseases
ABSTRACT
Objective:To directly compare the diagnostic utility of growth differentiation factor–15 (GDF-15) with our previous fibroblast growth factor–21 (FGF-21) findings in the same adult mitochondrial disease cohort.
Methods:Serum GDF-15 levels were measured using a quantitative ELISA. Statistical analyses of GDF-15 data were compared with our published FGF-21 findings.
Results:Median serum GDF-15 concentrations were elevated in patients with mitochondrial dis-ease and differed between all experimental groups, mirroring group results for FGF-21. There was a difference between patients diagnosed by muscle biopsy and genetic diagnosis, suggesting that serum GDF-15 measurement may be more broadly specific for mitochondrial disease than for muscle manifesting mitochondrial disease, in contrast to FGF-21. GDF-15 showed a markedly higher diagnostic odds ratio when compared with FGF-21 (75.3 vs 45.7), was a better predictor of disease based on diagnostic sensitivity (77.8% vs 68.5%), and outperformed FGF-21 on receiver operating characteristic curve analysis (area under the curve 94.1% vs 91.1%). Com-bining both biomarkers did not improve the area under the curve remarkably over GDF-15 alone. GDF-15 was the best predictor of mitochondrial disease (p , 0.002) following multivariate logistic regression analysis.
Conclusions:GDF-15 outperforms FGF-21 as an indicator of mitochondrial diseases. Our data suggest that GDF-15 is generally indicative of inherited mitochondrial disease regardless of clin-ical phenotype, whereas FGF-21 seems to be more indicative of mitochondrial disease when mus-cle manifestations are present.
Classification of evidence:This study provides Class III evidence that serum GDF-15 accurately distinguishes patients with mitochondrial diseases from those without them. Neurology® 2016;86:2010–2015
GLOSSARY
AUC5area under the curve;CI5confidence interval;FGF-215fibroblast growth factor–21;GDF-155growth differen-tiation factor–15;IQR5interquartile range;MELAS5mitochondrial myopathy, encephalopathy, lactic acidosis, and stroke-like episodes;MRC5Medical Research Council;NMDAS5Newcastle Mitochondrial Disease Scale for Adults;OR5odds ratio;ROC5receiver operating characteristic;TK25thymidine kinase 2 gene.
The routine diagnosis of mitochondrial diseases is in part complicated by a distinct lack of
sen-sitive serum biomarkers. Historically, insensen-sitive markers such as creatine kinase, lactate,
pyru-vate, and the lactate:pyruvate ratio have been used, with minimal diagnostic utility.
1–3Recent
efforts to identify more sensitive indicators of mitochondrial diseases led to the association of
increased cellular expression and raised serum levels of fibroblast growth factor
–
21 (FGF-21)
with mitochondrial myopathy in a mouse model.
4Subsequent studies in patient cohorts showed
serum FGF-21 concentration to be a useful indicator of muscle manifesting mitochondrial
disorders, greatly improving on the inference of classical disease markers.
2,3More recently, a gene
From the Department of Neurogenetics (R.L.D., C.M.S.), Kolling Institute of Medical Research, University of Sydney and Royal North Shore Hospital, Sydney, Australia; and the Department of Neurology (C.L., C.M.S), Royal North Shore Hospital, Sydney, Australia.
Go to Neurology.org for full disclosures. Funding information and disclosures deemed relevant by the authors, if any, are provided at the end of the article. The Article Processing Charge was paid by the authors.
expression study in humans with thymidine
kinase 2 (
TK2
) gene mutations identified
growth differentiation factor
–
15 (GDF-15)
as a potential disease indicator.
5GDF-15 has
since been reported to correlate with disease
severity, but not progression, in patients with
the m.3243A
.
G mutation
6,7and was found
to reflect improvements in mitochondrial
function following pyruvate supplementation
in vitro.
8In light of recent reports,
6–8we
pres-ent an analysis of the diagnostic capacity of
serum GDF-15 levels to indicate
mitochon-drial disease, and compare it to our previously
published data on FGF-21.
2METHODS Primary research question and classification of evidence. Is GDF-15 a better diagnostic indicator of mitochondrial diseases compared to FGF-21? This case-control study provides Class III evidence that GDF-15 is a better diagnostic indicator of mitochondrial diseases when compared with FGF-21 (diagnostic sensitivity, 77.8% vs 68.5%; diagnostic odds ratio [OR], 73.5 vs 45.7; area under the receiver operating characteristic curve, 0.941 vs 0.911).
Study cohort and inclusion and exclusion criteria. The cohort used in this study was described previously.2Briefly, the adult cohort consisted of 66 controls, 20 nonmitochondrial neu-romuscular disease controls, and 54 consecutive patients with mitochondrial disease. Mitochondrial disease patients were re-cruited between November 2011 and October 2012 from the adult mitochondrial disease clinic at Royal North Shore Hospital, Sydney, Australia, if they met the Walker criteria9for mitochon-drial disease and had a confirmed genetic diagnosis or changes on muscle biopsy indicative of mitochondrial myopathy. Participants ranged in age from 20 to 84 years and 57.9% of participants were female. Of the 54 patients with mitochondrial disease, 27 had a genetic diagnosis and 27 had muscle biopsy changes indicative of a mitochondrial myopathy (9 patients with a genetic diagnosis also had a muscle biopsy showing changes consistent with mito-chondrial myopathy). We refer to the Standards for Reporting of Diagnostic Accuracy diagram published previously for this cohort for inclusion and exclusion details.2When possible, the New-castle Mitochondrial Disease Scale for Adults (NMDAS)10 clini-cal rating sclini-cale was performed on patients with mitochondrial disease. In addition, patients were routinely assessed for proximal muscle weakness according to Medical Research Council (MRC) criteria.11
Standard protocol approvals, registrations, and patient consents.Written informed consent was obtained from all par-ticipants at the time of sample collection and ethical approval was granted by the Northern Sydney Local Health District Human Research Ethics Committee.
Biochemical assays.Serum creatine kinase, lactate, and pyru-vate levels (along with other biochemical parameters) measured previously2were used here for analysis with serum GDF-15 levels.
Serum GDF-15 measurement.GDF-15 levels were measured in archived serum samples by quantitative sandwich ELISA (Bio-Vendor, Laboratorni Medicina a.s., Brno, Czech Republic), ac-cording to the manufacturer’s instructions. Absorbance readings at 570 nm were subtracted from absorbance readings at 450 nm
before normalizing to the mean absorbance of blank wells. Trip-licate measurements for each sample were averaged and the con-centration determined from a 4-parameter logistic standard curve (www.myassays.com). ELISA measurements were performed in triplicate for each assay and repeated in at least duplicate assays. The scientist who performed the assays (R.L.D.) was blinded to samples and their groupings.
Statistical analysis.Statistical analyses were performed, as pre-viously described,2 using SPSS version 20 (IBM Corporation, Armonk, NY) and clinical research calculators on the Vassar University statistics Web interface (http://vassarstats.net/). Differences between groups were considered statistically significant when 2-tailed p values were less than 0.05. All p values below 0.0001 are represented as p , 0.0001. The reference cutoff concentration for GDF-15 was set at the 95th percentile of control group serum concentrations, as for FGF-21.2 We used Mann-WhitneyUand Kruskal-Wallis nonparametric testing to determine statistical differences between groups. We calculated the diagnostic sensitivity and the corresponding 95% confidence intervals. An unadjusted diagnostic OR was determined for comparison with FGF-21. Receiver operating characteristic (ROC) curves were plotted using sensitivity vs 1002specificity on a continuous scale and the area under the curve (AUC) was used to determine the relative diagnostic capacity. Biomarker levels were correlated with other biochemical measurements and clinical assess-ment tools using nonparametric Spearman correlation testing. Lin-ear regression analysis was used to determine if statistically correlated parameters could predict GDF-15 concentration. Mul-tivariate linear regression analysis was performed to determine fac-tors capable of predicting disease while controlling for confounders that may influence serum GDF-15 concentration.
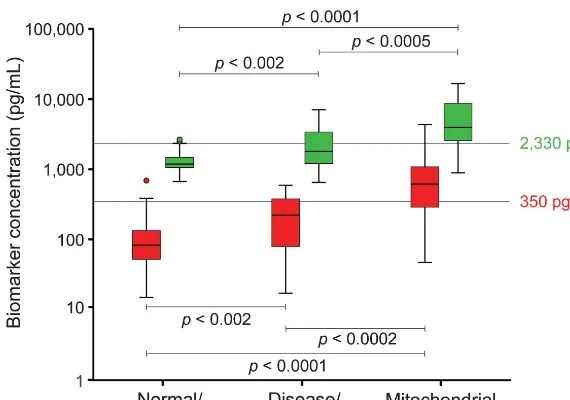
RESULTS Median serum GDF-15 concentrations varied considerably among the 3 cohort groups: the control group had a median serum GDF-15 concentration of 1,183.5 pg/mL (interquartile range [IQR] 1,037.5–1,475.3), disease controls had a median concentration of 1,791.0 pg/mL (IQR 1,148.0–3,406.8), and patients with mitochondrial disease had a median concentration of 3,956.0 pg/mL (IQR 2,516.5–8,676.8). The interassay coefficient of variation was 9.6% for repeated samples (40 samples repeated in duplicate and 42 samples repeated in triplicate from across the 3 experimental groups) and 10.7% for assay quality controls. On average, serum GDF-15 concentrations were 2 and 4.6 times higher than control levels for the disease control and mitochondrial disease groups, respectively. When compared to mean FGF-21 levels, disease control and mitochondrial disease groups were 2.2 and 7.3 times higher than control levels, respectively.2 As
In addition, Mann-WhitneyU(muscle biopsy vs genetic diagnosis, mtDNA vs nDNA mutation, mus-cle manifesting vs non–muscle manifesting, mito-chondrial myopathy, encephalopathy, lactic acidosis, and strokelike episodes [MELAS] vs non-MELAS, male vs female, diabetic vs normal, cardiovascular involvement vs no cardiovascular involvement) and Kruskal-Wallis (Walker criteria [possible, probable, definite], diabetic status [normal, type I diabetes, type II diabetes, impaired fasting glucose, impaired glucose tolerance, insulin resistance], body mass index [anorexic, normal, obese], cardiovascular status [nor-mal, cardiomyopathy, ischemic heart disease, rhythm disturbances, and periprocedural myocardial infarc-tion, as well as cardiomyopathy, rhythm disturbances, and periprocedural myocardial infarction]) nonpara-metric analyses revealed only one statistical difference among all the groups and categories compared. The criterion of muscle biopsy diagnosis vs genetic diag-nosis showed a marginal difference in serum GDF-15 concentration (3,206 pg/mL [IQR 2,152–6,028] vs 6,415 pg/mL [IQR 2,704–12,345], respectively;p5
0.046). Of note, in our previous FGF-21 study, there was a difference between muscle manifesting and non–muscle manifesting disease patients, indicative of FGF-21 elevation in myopathic disease states.2
This difference was not evident when analyzing GDF-15 (p50.324), suggesting GDF-15 production
may not be related to tissue-specific pathways, but rather pathways common to all tissues. This high-lights a potentially broader indication of mito-chondrial diseases by GDF-15 that is not evident for FGF-21.
The vast majority of literature discussing GDF-15 as a disease biomarker pertains to cardiovascular abnormalities, in particular ischemic heart disease. Although cardiac involvement is a relatively common comorbidity of mitochondrial disease, the majority of patients in this study did not have cardiac pathology. When analyzing GDF-15 against all cardiac involve-ment and also against subcategories of cardiac involvement, there was no apparent statistical differ-ence in serum GDF-15 concentration between those with (n511) or without (n543) cardiac involve-ment (p50.788), or when subcategorized (Kruskal-Wallis,p50.451).
Serum biomarker concentration exceeding the threshold cutoff was considered indicative of disease for statistical analyses. As the threshold cutoffs were set at the 95th percentile of control concentrations, the specificity was artificially determined to be 95.5% (95% confidence interval [CI] 86.4%– 98.8%) for FGF-21 and GDF-15 in both disease control and mitochondrial disease groups. The sensi-tivity for detecting mitochondrial disease if serum GDF-15 concentrations were raised was 77.8% (95% CI 64.1%–87.5%), as compared to FGF-21 at 68.5% (95% CI 54.3%–80.0%). For the disease control group, the sensitivity for predicting mito-chondrial disease when there was none was 30.0% (95% CI 12.8%–54.3%) using GDF-15, compared to 35.0% (95% CI 16.3%–59.1%) using FGF-21. When subcategorizing the mitochondrial disease group by diagnosis, the sensitivity for patients diag-nosed by muscle biopsy was 59.3% (95% CI 39.0%– 77.0%) using serum FGF-21 concentration and 70.4% (95% CI 49.7%–85.5%) using serum GDF-15 concentration. For patients diagnosed with a genetic mutation, the sensitivity was 77.8% (95% CI 57.3%–90.6%) using serum FGF-21 concentra-tion and 85.2% (95% CI 65.4%–95.1%) using serum GDF-15 concentration. Nine of the patients with genetic diagnoses also had a muscle biopsy show-ing changes consistent with mitochondrial disease. The sensitivity when considering these patients was 66.7% (95% CI 30.92–90.96) using serum FGF-21 concentrations and 88.9% (95% CI 50.67–99.42) using serum GDF-15 concentration.
The likelihood of having disease if FGF-21 levels were raised above the threshold cutoff of 350 pg/mL, known as the diagnostic OR, was calculated in our pre-vious study to be 45.7 (95% CI 12.5–166.5,p ,
0.0001).2 For GDF-15 in this study, the diagnostic
OR was calculated to be 73.5 (95% CI 19.6–276.3,
Figure 1 Box and whisker plots comparing fibroblast growth factor–21 (FGF-21) and growth differentiation factor–15 (GDF-15) concentrations between experimental groups
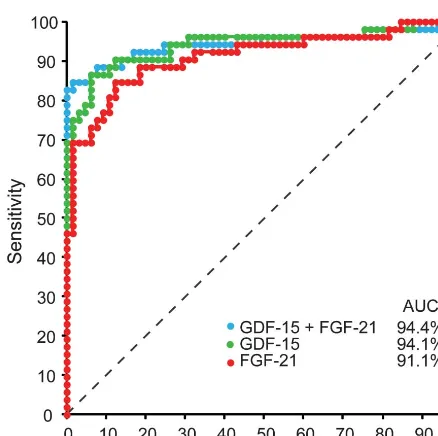
p,0.0001). Further to this, ROC curve analysis of FGF-21 and GDF-15 showed GDF-15 to be slightly better (AUC 0.941 [95% CI 0.893–0.989]) than FGF-21 (AUC 0.911 [95% CI 0.855–0.968]) at predicting disease across combinations of sensitiv-ity and specificsensitiv-ity, although the AUCs were not statistically different. Combining both biomarkers did not increase the AUC (0.944 [95% CI 0.895– 0.994]) remarkably over that for GDF-15 alone, indicating that there was little synergistic diagnos-tic benefit when considering the biomarkers together.
Statistical dependence between GDF-15 and all other measured parameters from the initial study2
was assessed for the disease group using Spearman rank correlation coefficient test. GDF-15 correlated with lactate (Spearman correlation coefficient [rs]5
0.583, p , 0.0001), lactate:pyruvate (rs 5 0.544,
p , 0.0001), FGF-21 (rs 5 0.554, p , 0.0001),
body mass index (rs5 20.322,p,0.02), MRC
prox-imal muscle weakness11(r
s5 20.302,p,0.05), and
the Walker criteria9(r
s5 0.322,p, 0.02).
Interest-ingly, unlike in other GDF-15 studies,6,7,12those patients
in the mitochondrial disease group for whom an NMDAS10had been completed at the time of
recruit-ment (n530) showed no correlation between the total NMDAS score or scores for subsections (I–III) and serum FGF-212or GDF-15 concentration.
Following multivariate linear regression analysis for each of the groups to determine any variables that could predict serum GDF-15 levels, only lactate: pyruvate (p , 0.002) and FGF-21 (p , 0.01) re-mained associated in the mitochondrial disease group. Despite a moderate correlation between GDF-15 and FGF-21 (rs5 0.554), an association that persisted
after linear regression, there was no benefit to disease prediction when the 2 biomarkers were combined for ROC curve analysis (figure 2), as mentioned above. Finally, when considering GDF-15 levels from con-trol and mitochondrial disease groups in a multivariate logistic regression model that included possible con-founders (age, lactate:pyruvate, insulin, glucose, cho-lesterol, triglycerides, and FGF-21), GDF-15 was the best predictor of mitochondrial disease (p,0.002).
DISCUSSION In our cohort of adult patients with mitochondrial disease, GDF-15 presents as a sensitive indicator of mitochondrial diseases and outperforms FGF-21 and classical markers. Median serum concentrations of GDF-15 showed the same relationship between experimental groups as was observed for FGF-21 (figure 1), but GDF-15 was a better predictor of disease based on diagnostic sensitivity, diagnostic OR, ROC curves (figure 2), and multivariate linear regression. Despite a moderate correlation between serum GDF-15 and FGF-21
concentration, a relationship that persisted after linear regression analysis, there was no synergistic benefit for considering GDF-15 and FGF-21 together (figure 2). Furthermore, GDF-15 was more broadly indicative of mitochondrial diseases, rather than preferentially indicating muscle manifesting mitochondrial disease like FGF-21.
The design of the current study differs from previ-ous studies in several ways. First, we surveyed an adult-only cohort of patients with mitochondrial dis-ease, whereas other FGF-21 and GDF-15 diagnostic studies have looked at combined adult and pediatric cohorts.3,7,8As pediatric patients are known to exhibit
higher circulating biomarker levels,3,7analyses
com-bining these populations may artificially skew serum biomarker concentrations and therefore the analysis of results. Second, our cohort included a combination of patients with genetic and muscle histology diagno-ses, representing current clinical diagnostic methods. As such, our study represents a more stringent esti-mation of biomarker diagnostic validity, compared to other studies that have considered only genetically diagnosed cohorts.3,6,7,12 Given our results, we
pro-pose that biomarker triaging of patients suspected of a mitochondrial disorder may prove to be a more efficient diagnostic paradigm when performed in combination with exhaustive genetic sequencing analysis using next-generation sequencing.13 Third,
our cohort represents a wider range of mitochondrial diseases in comparison to other studies that have used limited genetic mitochondrial disease groups, such as m.3243A.G, Kearns-Sayre syndrome, mitochon-drial DNA deletions, orTK2 mutations.5–8Finally,
we used assay kits from the same manufacturer (FGF-21 and GDF-15; BioVendor, Brno, Czech Republic), as compared to other studies that used assays from different manufacturers (FGF-21; BioVendor and GDF-15; R&D Systems, Minneapolis, MN),6–8,12
to reduce potential variation in methodology and experimental output.
The median GDF-15 concentration for controls in this study (1,183.5 pg/mL [IQR 1,037.5– 1,475.3]) was in good agreement with median GDF-15 concentrations for controls (1,020 pg/mL [IQR 803–1,362 pg/mL] in men and 1,017 pg/mL [IQR 809–1,297 pg/mL] in women) from the Fra-mingham Offspring Study,14despite differing
meth-ods of quantification. However, when age- and sex-matched 97.5th percentile values from the Fra-mingham study were used as the threshold cutoff for a genetically diagnosed m.3243A.G European patient cohort study, a diagnostic sensitivity of only 53% was calculated.6,14By comparing the 97.5th
per-centile values from the Framingham study (range 1,085–5,006 pg/mL, age- and sex-dependent,14using
immunoassay) with the threshold cutoff of a recent Japanese mitochondrial disease patient GDF-15 diag-nostic study (710 pg/mL,7using R&D systems
Quan-tikine ELISA), obtained using the same ELISA assay as the European study,6it becomes apparent that the use
of different assays can give markedly different results and the use of data from one assay type in association with a different assay can potentially be misleading. Despite this, the correlation between serum GDF-15 and FGF-21 concentrations was in agreement between this study and the European study (rs50.554 vsrs5
0.54, respectively) and close to that reported in the Japanese study (rs50.64).6,7
Our study demonstrates that elevated GDF-15 lev-els were indicative of mitochondrial disease regardless of whether there was muscle involvement. This is in contrast to the Japanese study, which claimed that GDF-15 may be a better indicator of muscle manifest-ing disease than FGF-21, even though a measure of muscle involvement was not used in that study and therefore comparisons relating muscle involvement with biomarker concentration were not possible. Fur-thermore, that study used different threshold values for GDF-15: they agreed with our previously deter-mined FGF-21 threshold cutoff value of 350 pg/mL, when using the same ELISA from BioVendor,2,7but
the threshold cutoff values for GDF-15 were set at a lower level (R&D Systems5 710 pg/mL7vs
Bio-Vendor52,330 pg/mL in this study), possibly owing to the difference in ELISA used.
In this study and our previous study on FGF-21,2
we found no correlation with the total or subcategory NMDAS scores for patients who completed this rat-ing scale at the time of recruitment. This is in contrast to other studies that have found moderate to strong correlations between biomarker concentrations and disease severity measured using the NMDAS and the Japanese Mitochondrial Disease Rating Scale.6,7,12,15 In the European study, a correlation
was identified between GDF-15 and NMDAS-rated severity for asymptomatic patients, moderately affected patients, or moderately affected patients (rs50.54,p,0.001), but not for severely affected
patients.6This disparity may be due to the method of
analysis, as it was reported that a parametric correla-tion test (Pearson) was used for the severe group and then compared to a nonparametric correlation test (Spearman) for asymptomatic, mild and moderate severity groups. A lack of correlation between serum biomarker concentration and disease progression may indicate that the current means of assessing disease progression are inadequate or too narrow for the phe-notypic diversity of these disease groups. Alterna-tively, the lack of association may indicate the inability of these biomarkers to infer disease progres-sion on the basis of being surrogate markers and not mediators of disease, a detail that warrants further investigation. Finally, the single follow-up sampling of both FGF-21 and GDF-15 in the European m.3243A.G cohort, 2 years after the initial sample, may not provide adequate frequency or time scales for these markers to reliably track disease progression in combination with the NMDAS.6,12 Estimation of
progression may therefore be improved by more fre-quent sampling in addition to more sensitive means of assessing severity. Thus, larger studies with more sensitive clinical tools to measure disease progression, performed over longer follow-up periods and with more frequent sampling points, may be required to clarify whether biomarkers such as GDF-15 and FGF-21 are able to indicate disease progression.
The clinical diagnostic outlook for mitochon-drial disease has been dramatically improved over the past 5 years with the identification of FGF-21 as a useful indicator of muscle manifesting mito-chondrial disease and now more so with GDF-15 as a more sensitive and broadly indicative marker of mitochondrial disease. Continued investigation into the pathophysiologic relationship of these markers with mitochondrial disease may strengthen their diagnostic utility or identify better candidate biomarkers. In any case, front-line diagnostic indi-cator tests, such as serum GDF-15 concentration, coupled with exhaustive genetic sequencing meth-ods, afforded by advances in next-generation sequencing technologies, herald a potentially new
Figure 2 Comparison of continuous-scale receiver operating characteristic curves for growth differentiation factor–15 (GDF-15) and fibroblast growth factor–21 (FGF-21), both individually and combined
age for mitochondrial disease diagnosis.13It is hoped
that the clinical, fiscal, and personal burden of mitochondrial diseases may be improved through better management and treatment resulting from improved diagnostic capabilities.
AUTHOR CONTRIBUTIONS
Statistical analysis was carried out by R.L.D. with assistance from J. Patterson (both from the Kolling Institute of Medical Research, St. Leonards, Australia). Dr. R.L.D. conceptualized and designed the study, acquired data, analyzed data, carried out statistical analyses, inter-preted data, drafted the manuscript, and revised the manuscript. Dr. C.L. acquired data and revised the manuscript. Professor C.M.S. designed and funded the study, interpreted data, and revised the manuscript.
ACKNOWLEDGMENT
R.L.D. is a NHMRC early career postdoctoral fellow, C.L. is a NHMRC postgraduate scholar, and C.M.S. is a NHMRC practitioner fellow. The authors thank Dr. J. Patterson and Dr. A. Dona for their discussion of sta-tistical analyses, as well as the patients and their referring doctors for participation.
STUDY FUNDING No targeted funding reported.
DISCLOSURE
The authors report no disclosures relevant to the manuscript. Go to Neurology.org for full disclosures.
Received December 27, 2015. Accepted in final form February 21, 2016.
REFERENCES
1. Clarke C, Xiao R, Place E, et al. Mitochondrial respiratory chain disease discrimination by retrospective cohort anal-ysis of blood metabolites. Mol Genet Metab 2013;110: 145–152.
2. Davis RL, Liang C, Edema-Hildebrand F, et al. Fibroblast growth factor 21 is a sensitive biomarker of mitochondrial disease. Neurology 2013;81:1819–1826.
3. Suomalainen A, Elo JM, Pietilainen KH, et al. FGF-21 as a biomarker for muscle-manifesting mitochondrial
respira-tory chain deficiencies: a diagnostic study. Lancet Neurol 2011;10:806–818.
4. Tyynismaa H, Carroll CJ, Raimundo N, et al. Mitochon-drial myopathy induces a starvation-like response. Hum Mol Genet 2010;19:3948–3958.
5. Kalko SG, Paco S, Jou C, et al. Transcriptomic profiling of TK2 deficient human skeletal muscle suggests a role for the p53 signalling pathway and identifies growth and dif-ferentiation factor-15 as a potential novel biomarker for mitochondrial myopathies. BMC Genomics 2014;15:91. 6. Koene S, de Laat P, van Tienoven DH, et al. Serum GDF15 levels correlate to mitochondrial disease severity and myocardial Strain, but not to disease progression in adult m.3243A.G carriers. JIMD Rep 2015;24:69–81. 7. Yatsuga S, Fujita Y, Ishii A, et al. Growth differentiation
factor 15 as a useful biomarker for mitochondrial disor-ders. Ann Neurol 2015;78:814–823.
8. Fujita Y, Ito M, Kojima T, et al. GDF15 is a novel bio-marker to evaluate efficacy of pyruvate therapy for mito-chondrial diseases. Mitochondrion 2015;20:34–42. 9. Walker UA, Collins S, Byrne E. Respiratory chain
ence-phalomyopathies: a diagnostic classification. Eur Neurol 1996;36:260–267.
10. Schaefer AM, Phoenix C, Elson JL, et al. Mitochondrial disease in adults: a scale to monitor progression and treat-ment. Neurology 2006;66:1932–1934.
11. Medical Research Council of the United Kingdom. Aids to Examination of the Peripheral Nervous System. Palo Alto, CA: Pendragon House; 1978.
12. Koene S, de Laat P, van Tienoven DH, et al. Serum FGF21 levels in adult m.3243A.G carriers: clinical im-plications. Neurology 2014;83:125–133.
13. Liang C, Ahmad K, Sue CM. The broadening spectrum of mitochondrial disease: shifts in the diagnostic paradigm. Biochim Biophys Acta 2014;1840:1360–1367. 14. Ho JE, Mahajan A, Chen MH, et al. Clinical and genetic
correlates of growth differentiation factor 15 in the com-munity. Clin Chem 2012;58:1582–1591.
15. Yatsuga S, Povalko N, Nishioka J, et al. MELAS: a nation-wide prospective cohort study of 96 patients in Japan. Biochim Biophys Acta 2012;1820:619–624.
WriteClick
®rapid online correspondence
Have a comment on a recentNeurology®article you would like to share? Now it is easier and more convenient.Neurology.orghas launched WriteClick on the home page and sidebars of each article to encourage remarks and debate among users.
WriteClick is restricted to comments about studies published inNeurologywithin the last eight weeks.
DOI 10.1212/WNL.0000000000002705
2016;86;2010-2015 Published Online before print April 27, 2016
Neurology
Ryan L. Davis, Christina Liang and Carolyn M. Sue
diseases
A comparison of current serum biomarkers as diagnostic indicators of mitochondrial
This information is current as of April 27, 2016
Services
Updated Information &
http://n.neurology.org/content/86/21/2010.full
including high resolution figures, can be found at:
References
http://n.neurology.org/content/86/21/2010.full#ref-list-1
This article cites 14 articles, 4 of which you can access for free at:
Citations
http://n.neurology.org/content/86/21/2010.full##otherarticles
This article has been cited by 4 HighWire-hosted articles:
Subspecialty Collections
tics-mitochondrial_disorders
http://n.neurology.org/cgi/collection/mitochondrial_disorders_see_gene Mitochondrial disorders; see Genetics/Mitochondrial disorders http://n.neurology.org/cgi/collection/diagnostic_test_assessment_ Diagnostic test assessment
http://n.neurology.org/cgi/collection/cohort_studies Cohort studies
http://n.neurology.org/cgi/collection/class_iii Class III
following collection(s):
This article, along with others on similar topics, appears in the
Permissions & Licensing
http://www.neurology.org/about/about_the_journal#permissions
its entirety can be found online at:
Information about reproducing this article in parts (figures,tables) or in
Reprints
http://n.neurology.org/subscribers/advertise
Information about ordering reprints can be found online:
rights reserved. Print ISSN: 0028-3878. Online ISSN: 1526-632X.
1951, it is now a weekly with 48 issues per year. Copyright © 2016 American Academy of Neurology. All ® is the official journal of the American Academy of Neurology. Published continuously since