LEAK-BEFORE-BREAK DEMONSTRATIONS FOR SODIUM FAST
REACTORS
Hubert Deschanels1, Philippe Gilles2, Laurent Vinçon1, and Yann Kayser 3
1
AREVA NP – 10-12 Rue J. Récamier 69456 LYON Cedex 06 FRANCE Email: [email protected], [email protected]
2
AREVA NP Tour AREVA 92084, Paris La Défense, FRANCE, Email: [email protected]
3
Commissariat à l'Energie Atomique CEN SACLAY 91191 GIF sur YVETTE Cedex FRANCE Email: [email protected]
ABSTRACT
The Leak-Before-Break (LBB) methodology for Sodium Fast Reactor’s (SFRs) and the relevant procedures have been an on-going development for a long run. First, the main features of the methodology are outlined.
Large experimental programs were conducted and then have supported evolutions of the RCC-MRx Appendix A16 LBB’s procedure, and its improvements.Thus, major R&D works conducted in that framework and main improvements of the procedures are recalled.
The needs and main goals of the LBB contributions to safety demonstrations required for SFRs are emphasized in this paper regarding the main vessel and large secondary pipings.
On-going work for pipings aims at checking accuracy of the current methodology and at making progress. Finally, this paper points out several ways for improvements that would be helpful in a near future for potential SFRs applications, regarding evaluation of:
- the “complex” shape of detectable crack (leak detection),
- the Crack Opening Profile for such ”complex” Through-Wall Crack (TWC) and then the leak rate, - the critical crack length under large ductile crack growth.
INTRODUCTION
In France, applications of LBB analysis have been conducted, on the main vessel as well as on large secondary pipings, for SUPERPHENIX and PHENIX plants. Thus, over the years, large experimental works have been performed for SFRs. On-going work is presented and available results are discussed. In addition, further needs for improvements for SFRs are pointed out.
DEVELOPMENT OF LBB METHODOLOGY FOR SFRs
As a matter of fact, complex crack shapes and openings, across the wall thickness, may happen in Sodium-Fast-Reactor’s components because, under operating conditions, the thermal stresses are significant and the mechanical stresses are low.
The development of the methodology takes into account the prior work carried out in the frame of the former European Fast Reactor (EFR) project and the DCRC report 13 [1].
RCC-MRx APPENDIX A16 LBB PROCEDURE
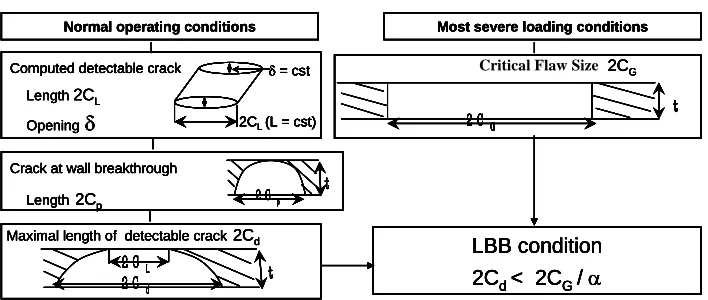
The overall scheme of the RCC-MRx [2] Appendix A16 LBB’s procedure is given by figure 1.
Figure 1: LBB Flow chart
Normal operating conditions
Computed detectable crack
Length2CL
Opening
Most severe loading conditions
Limiting through-wall crack length2CG
Crack at wall breakthrough
Length2Cp 2 Cp t
Maximal length of detectable crack2Cd
LBB condition 2Cd < 2CG /
2 CG t
2 CL
2 Cd t
= cst
2CL (L = cst)
Normal operating conditions
Computed detectable crack
Length2CL
Opening
Most severe loading conditions
Limiting through-wall crack length2CG
Crack at wall breakthrough
Length2Cp 2 Cp t
2 Cp t
Maximal length of detectable crack2Cd
LBB condition 2Cd < 2CG /
2 CG t
2 CG t
2 CL
2 Cd t 2 CL
2 Cd t
= cst
2CL (L = cst) = cst
2CL (L = cst)
Normal operating conditions
Computed detectable crack
Length2CL
Opening
Most severe loading conditions
Limiting through-wall crack length2CG
Crack at wall breakthrough
Length2Cp 2 Cp t
Maximal length of detectable crack2Cd
LBB condition 2Cd < 2CG /
2 CG t
2 CL
2 Cd t
= cst
2CL (L = cst)
Normal operating conditions
Computed detectable crack
Length2CL
Opening
Most severe loading conditions
Limiting through-wall crack length2CG
Crack at wall breakthrough
Length2Cp 2 Cp t
2 Cp t
Maximal length of detectable crack2Cd
LBB condition 2Cd < 2CG /
2 CG t
2 CG t
2 CL
2 Cd t 2 CL
2 Cd t
= cst
2CL (L = cst) = cst
2CL (L = cst)
Critical Flaw Size
The lengths used in the LBB procedure are the dimensions of the detectable crack or those of the critical crack, as illustrated in figure 1. The crack length at wall breakthrough (just TWC), 2Cp, is evaluated by using the master curve. The length 2Cd (2Cp + 2CL) is the maximal dimension of the detectable crack, t is the wall thickness and 2CG is the smallest critical flaw size.
Calculation Of The Critical Flow Size 2CG
Fracture instability assessment is performed through analysis of ductile tearing - As a matter of fact, the ability to accounting for large ductile crack growths, is a major issue. Prior work from Turner [5], based on energetic approach, aims to split energy dissipated in the cracked structure into global plasticity and energy dissipated by fracture process noted (Gfr). From PhD work, S. Marie 1999 [6], evaluation of the critical fracture energy dissipation rate Gfr has been developed and codified in the RCC-MRx. It is worth to mention that the procedure requires only the J-integral values. Evaluation of the crack driving force J can be conducted by using the simplified approach given by RCC-MRx appendix A16. The J-estimation scheme procedure is based on the reference stress technique introduced by Ainsworth.
Calculation Of The Maximal Length, 2CL, of The Detectable Crack
The detectable leak rate is an input data of the analysis. Note that technology to detect a leak and the required equipment are not described in the A16 procedure.
The length (2CL) of the TWC corresponding to the detectable leak rate, during normal operation, is determined. The evaluation of 2CL needs the evaluation of the Crack Opening Area (COA) and the leak rate.
- Current procedure:
For the evaluation of the Crack Opening Mouth Displacement (CMOD), , and the COA, the only crack length (2CL) is considered (minimal length). The shape of the crack across the wall thickness is supposed to be rectangular, such assumption leads to minimizing the COA and so, the leak rate.
The approach involves the assumption of an elliptical shape for the COA, expressed by, COA =
(membrane and bending) across the wall thickness: = 4 C/E (km Sm – kb Sb) where km and kb are tabulated, and E is the Young’s modulus.
Further improvements are foreseen in order to calculate thoroughly the COA, at internal and external sides, and by considering inelastic deformations.
- Potential improvement for the evaluation of leak path with complex crack shape:
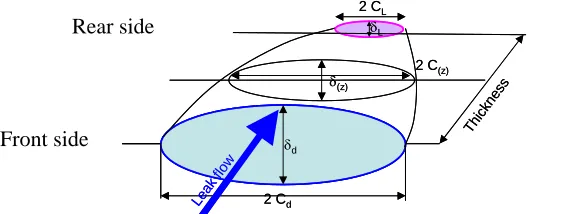
Paper [7] provides an analytical formulation for the 3D geometry of a postulated circumferential, semi-elliptical TWC defect in a tube, depending on the thermo-mechanical loading and the geometry of the structure. This formulation is based on the simplified assumptions given by the current A16 Appendix of the RCC-MRx. It is a generalization, through the thickness of the structure, of the COA formula that is commonly used at the rear side (minimal opening).
Figure 2: Description of the 3D Crack Geometry and the Crack Opening Profile (COP)
Rear side
Front side
2 Cd d
2 CL
Thi ckne
ss
2 C(z) L
(z)
Leak flow
2 Cd d
2 CL
Thi ckne
ss
2 C(z) L
(z)
Leak flow
In addition, 3D Finite Elements calculations are also performed in order to validate the proposed analytical description of defect opening. This work mainly shows that the LBB procedure of the A16 appendix [2] leads to significant overestimations of expected detectable crack sizes, and that a reduction of margins might be justified. Thus, evaluation of rather realistic COP across the wall thickness is a significant issue and may be done, at present time, by conducting detailed computations.
EXPERIMENTAL WORK
Paper [8] presents experimental work carried out by CEA in the nineties. The experimental work conducted for SFRs pipings is detailed here after.
CHARLIE – FAR 1 Test
An actual TWC is obtained after 499 cycles under creep-fatigue crack growth. The lengths, L1 = 47,5 mm and L2 = 7 mm (See figure 3), are respectively the dimensions of the crack on the internal side and external side of the tube. The thickness, t, is 8 mm. After the loading is applied, the COA is then measured, and finally, water leak tests are performed.
Figure 3: CHARLIE - FAR 1 Test: Calculated/experimental crack opening
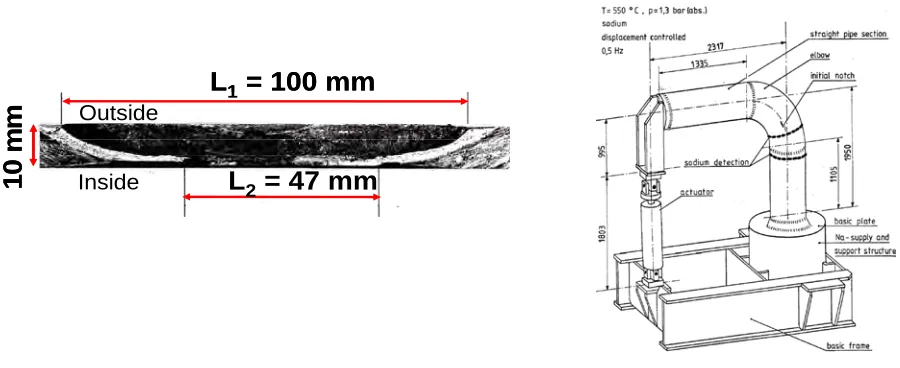
SPX1 Elbow Test
A full-scale elbow is submitted to a cyclic bending load [10], figure 4 shows experimental device. A longitudinal initial crack (see figure 4) is located at the crown (outer surface), which is well known to be the worst location for LBB demonstration. The master curve is found to be quite pessimistic, leading to about two times the crack length at wall breakthrough. In addition, the rear side crack length (L2) is significant (47 mm). The ratio (L1-L2)/L1 is then about 0.53 (see figure 4).
Figure 4: SPX1 Elbow Test - Just TWC at wall breakthrough
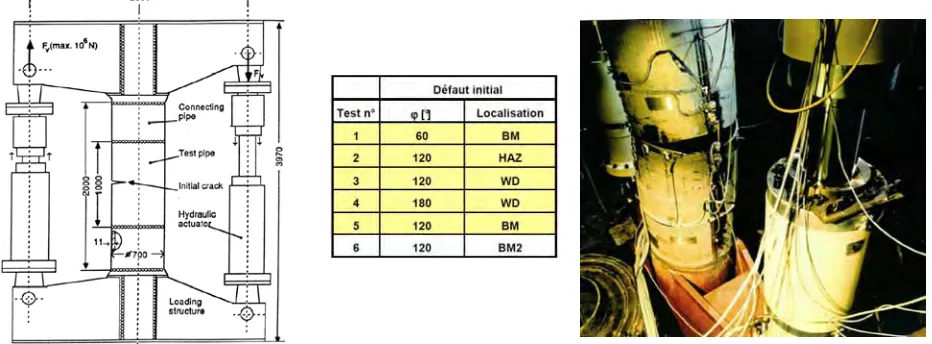
SPX1 Straight Pipe Test
Full-scale pipe bend experiments were conducted in the nineties in the framework of a cooperative programme involving INTERATOM, EDF and FRAMATOME on SUPERPHENIX’s straight pipes.
Six pipe specimens with different crack lengths 60°, 120° and 180° are tested. The crack is located in Base Metal (BM), in Heat Affected Zone (HAZ) or in Weld metal (WD). Pipes are made of austenitic stainless steel.
Outside
Inside
10 m
m
L
1= 100 mm
L
2= 47 mm
Outside
Inside
10 m
m
L
1= 100 mm
L
2= 47 mm
min (rear)= cst
2CL(L = cst) min (rear)= cst
2CL(L = cst) min (rear)= cst
2CL(L = cst) L2 = 7 mm (rear surface)
rear
L1= 47.5 mm (front surface)
front
L2 = 7 mm (rear surface)
rear
L1= 47.5 mm (front surface)
front
t
t min (rear)= cst
2CL(L = cst) min (rear)= cst
2CL(L = cst) min (rear)= cst
2CL(L = cst) L2 = 7 mm (rear surface)
rear
L1= 47.5 mm (front surface)
front
L2 = 7 mm (rear surface)
rear
L1= 47.5 mm (front surface)
front
min (rear)= cst
2CL(L = cst) min (rear)= cst
2CL(L = cst) min (rear)= cst
2CL(L = cst) L2 = 7 mm (rear surface)
rear
L1= 47.5 mm (front surface)
front
L2 = 7 mm (rear surface)
rear
L1= 47.5 mm (front surface)
t
front
The details of the experimental set-up and the overall experimental results can be found in reference [12].
Figure 5: Full scale pipe tests
Large ductile crack growths (100 to 300 mm), which are experimentally observed [12] in base metal and in weldment, always remain into the initial crack plane. Ductile tearing is associated with large pipe deflection and crack opening, as illustrated by the figure 5.
Results obtained by using assessment procedures available at that time (GE-EPRI, R6,…) are compared with experimental results [11] and [12]. These experimental results and available measurements could be used to check current procedures and on-going developments.
LBB APPLICATIONS FOR SFRs IN FRANCE
Applications of LBB concept were conducted on the main vessel as well as on large secondary pipings for SUPERPHENIX and PHENIX plants ([13] and [14]).
Crack growth analyses are conducted and the obtained margins on propagation are required substantial, before the wall may be breached.
However, despite the unlikelihood of such an event, an hypothetical TWC is considered.
For the main vessel, the goal is to rule out any failure of the core supporting line. Thus, LBB is then part of the Break Exclusion demonstration.
For large secondary pipings, the guillotine break and potential consequences are taken into account. Thus, the aim of LBB arguments is to take part in the demonstration that the probability of failure remains low and finally to allow to classify such event as a more unlikely situation.
ON-GOING DEVELOPMENTS AND WORK FOR PIPINGS
On-going developments deal with a comprehensive evaluation of the behaviour of circumferentially through-wall cracked straight pipes. It aims at the calculation of main fracture mechanic parameters, commonly used for LBB analysis, such as:
- the J-integral,
- the CMOD () and the COA.
This work is conducted by AREVA NP for PWRs (thick pipes) and for SFRs (thin walls). One goal is to lead to an harmonization of current and future approaches of the AFCEN procedures [2]: As a matter of fact, such harmonization has already been done for surface crack assessments.
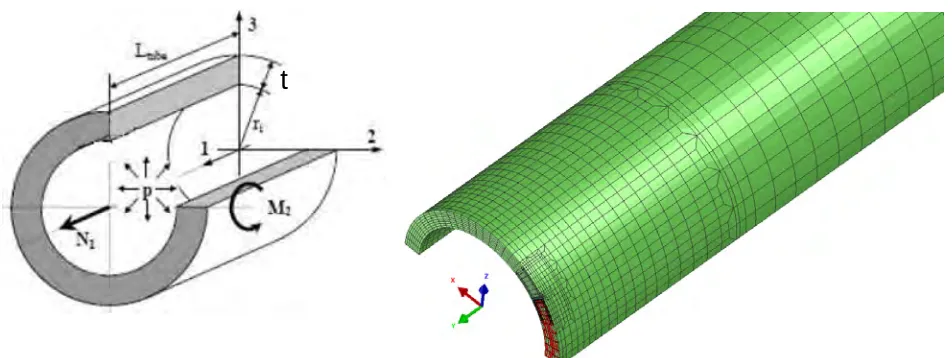
Symmetry boundary conditions are applied so that a quarter model is simulated (see figure 6): The crack plane ligament (first) and the meridian plane of the tube crossing the middle of the crack (second).
Figure 6: F.E. model and loads considered
tt
The loads comprises, the bending moment (M2), the tension (N1) and the internal pressure (P), considered separately or through combined mechanical loading.
It is important to mention that the welded junctions are often the weakest point of the structure because of greater risk of defects, the heterogeneity of the microstructure of the weld, and plastic deformations induced by two materials with different yield stress (mismatch). As a result, welds have to be considered in the investigations. Two F.E. models are set up, the one without weld is named,
monomat, as the other one with weld (used for butt welding junctions) is named, bimat.
Elastic and elastic-plastic computations are then made by using FE model, both for uncracked and cracked components, up to about 2.5 times the limit load noted, QLY_A1.
As far as the elastic part of J-integral is concerned, very good accuracy has to be noticed from RCCMRx Appendix A16 evaluation. Thus, the study focuses on plastic effects. The geometry of F.E. models is not a full scale pipe but is characterized by dimensionless parameters: the ratio Rm/t and the crack angle /, the total crack angle being 2. An example is given for illustration, the computations described here after are conducted with the following geometry: mean radius Rm = 50 mm and thickness h = 10 mm (Rm/t=5). The length of the pipe model is chosen long enough to prevent size effects.
J-Integral Computation
Comparisons of F.E. results (at mid-thickness) with those obtained through analytical solutions proposed by RCC-MRx appendix A16 are made in order to check their accuracy. Short cracks are going to be considered (encountered in crack assessments), because most results are commonly available for rather long cracks. For the following study case (monomat pipe under bending moment M2), the crack length is almost short (2 = 33.7°). Pure bending is applied to the F.E. model in the form of a rotational boundary condition. For these analyses, 14,000 20-noded isoparametric elements are used.
So, the ratio Je_A16 / Je_EF is then 0.98: Je_A16 and Je_F.E. being respectively obtained with RCC-MRx
appendix A16 or from the F.E. analyses.
As far as plastic effects are concerned, a rather good agreement is obtained on the ratio J/Je (see
Figure 7: Comparison of J-integral obtained by simplified approach with F.E. results
"Monomat" - Total crack angle 2=33.7° Comparison
RCCMRx A16 / F.E. of the ratio J / Je
0 5 10 15 20
0 0.5 1 1.
Q / QLY_A1
J
/ J
e
5 F.E.
A16
Comparison RCCMRx A16 / F.E.
of the ratio J /Je
0 0.2 0.4 0.6 0.8 1 1.2
0.0 0.5 1.0 1.5
Q / QLY_A1
J/
Je_
A
16
/ J
/Je_E
.F
.
In addition to the monomat pipe (base metal
)
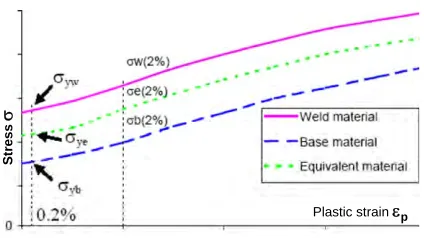
, circumferential welds are modelled with a constant width (30 mm) across the wall thickness. The crack is then located in the center of the weld. In order to account for the strength mismatch of welds, RCCMRx Appendix A16 [2] proposes to use an equivalent material monomat (see figure 8) based on a mix law. A prior work is provided by R6 [15], which introduces and also supports that approach.Figure 8: Stress-strain curve of an equivalent material
St
ress
Plastic strainp
St
ress
Plastic strainp
In a first step, stress strain curves, used for F.E. computations, are given by Ramberg-Osgood behaviour laws. The same exponent (n= 5) is used, both for the base metal and for the welds. The strength mismatch ratio M is obtained from the yield stress y (weld / base metal):M = 2 = yw=200 MPa / yb=100 MPa
Figure 9: Welds - Ratio J/Je, bimaterial model or equivalent “monomat”
Total crack angle 2 = 90°
0.0 25.0 50.0 75.0
0.0 0.5 1.0 1.5 2.0
Q / QLY_A1
J/J
e
BIMAT n5n5
BM: MONOMAT Sy=100 Mpa n=5
MONOMATeq Sy=125MPa n = 5
Total crack angle 2 = 33.7°
0 25 50 75
0.0 0.5 1.0 1.5 2.0
Q / QLY_A1
J /
Je
BIMAT n5n5
BM MONOMAT: Sy=100 n=5
Results obtained by using an equivalent material with ”monomat” F.E. models, are in good agreement with those calculated from detailed computations by using a “bimaterial” F.E. model. The figure 9 shows the evolution of the ratio J/Je depending on the dimensionless load, Q/QLY_A1 (the ratio of
the load applied Q on the limit load of the cracked component). The comparison (bimat results) with the ”base metal” results (green curve) shows that overmatch effect is significant both for long cracks (2 = 90°) and also for short cracks (2 = 33.7°).
CMOD And COA Computations
The figure 10 shows an opening, ext at the external side, two times larger than at the opposite one.
So the leak flows through a complex COP (different COA at the opposite side).
Figure 10: Bimaterial model for welds – COA and an illustration of the COP
Total crack angle 2 = 33.7°
0,0 1,0 2,0 3,0
0,0 0,4 0,8 1,2 1,6
Q / QLY_A1
[m
m
]
CMOD_int CMOD_ext
COP through the wall thickness
Crack length
ext
int
Wall
thick
ness
Crack length
ext
int
Wall
thick
ness
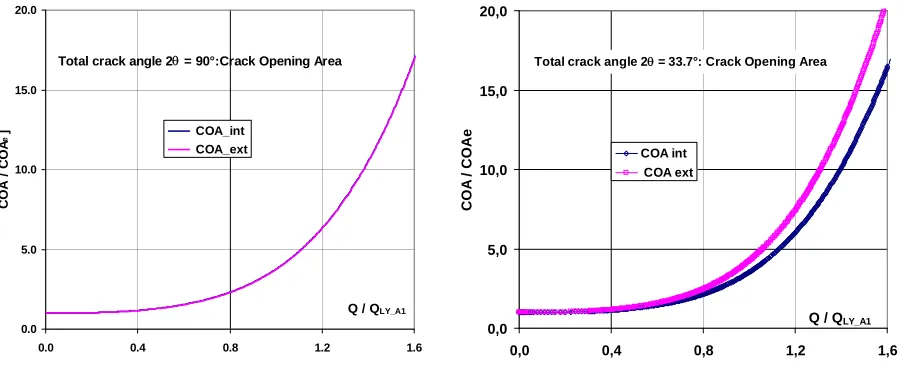
For long cracks, the difference between internal side (int.) and external side (ext.) on results (, COA), is mainly due to the difference in the elastic domain. The figure 11 shows that the plastic contribution is almost the same for both sides. For short cracks, the difference on the plastic contribution is higher than for long cracks and may be significant (see figure 11).
Figure 11: Bimaterial model for welds – ratio of COA (total) under COAe (elastic)
Total crack angle 2 = 90°:Crack Opening Area
0.0 5.0 10.0 15.0 20.0
0.0 0.4 0.8 1.2 1.6
Q / QLY_A1
COA /
COA
e
] COA_int
COA_ext
Total crack angle 2 = 33.7°: Crack Opening Area
0,0 5,0 10,0 15,0 20,0
0,0 0,4 0,8 1,2 1,6
Q / QLY_A1
COA
/ C
O
Ae
COA int COA ext
For all these computations, the value of the exponent (n) is set to 5, for both the base metal and the weldment. Further computations where an higher n value is considered for the weldment, nWD=7
In addition, other axial locations of the crack into the weld are going to be investigated, then the meshing of half the structure is required.
POTENTIAL IMPROVEMENTS FOR SFRs
In order to perform LBB applications for SFRs, further needs for improvements in some parts of the A16 LBB’s procedure are pointed out. Main technical issues are in connexion with the evaluation of:
- the "complex" shape of TWC, with variable crack length across the wall thickness, which characterises the detectable crack: It results from crack growth before and after the wall is breached.
- the leak path given by the COP: As far as this "complex" TWC are concerned, detailed analysis could lead to thoroughly evaluating the COP across the wall thickness and so the corresponding leak rate. A first step is underway for piping.
L2 (rear surface)
rear
L1 (front surface)
front
L2 (rear surface)
rear
L1 (front surface)
front
t
L2 (rear surface)
rear
L1 (front surface)
front
L2 (rear surface)
rear
L1 (front surface)
front
t
- the critical flow size, by using a ductile tearing analysis able to accounting for large crack growth: As a matter of fact, RCC-MRx provides procedures for evaluation of the critical-fracture-energy-dissipation-rate Gfr. Work is on-going regarding J evaluation which is required for the tearing analysis procedure. It aims to better account for large range of pipe geometry, from short to large cracks and welds.
CONCLUSIONS
In the framework of the RCC-MRx Appendix A16 LBB’s procedure, a lot of work and large experimental programs have been conducted for SFR applications.
Regarding the crack length at wall breakthrough, the well-known master curve, previously established for fatigue crack growth, still leads to pessimistic results under creep-fatigue conditions. The comparison with experimental results shows margins both for fatigue or creep-fatigue crack propagation.
are due to assumptions made on the COP. This paper outlines some needs for improvements that would be helpful in future LBB applications for SFRs, mainly regarding the COP evaluation.
The evaluation of the critical fracture energy dissipation rate, Gfr, through the RCC-MRx Appendix A16 procedure is a suitable approach for analyses of large ductile tearing. It only requires the J-integral computation. As far as J parameter is concerned, very accurate results are obtained on the elastic calculation by using the A16 procedure for thick and thin pipings (3 < Rint. / t) < 80.
This paper also mentions a work, conducted by AREVA
,
which is currently underway for pipings. It aims at thoroughly accounting for welds and plasticity in the calculation of main fracture mechanic parameters, commonly used for LBB assessment, such as the J-integral or the COA.REFERENCES
[1] DCRC report n°13 “Leak-before-break procedure for sodium boundary components” EFR B 40151465/B
[2] RCC-MRx 2012 “Design and Construction Rules for Mechanical Components of Nuclear Installations”, edited by AFCEN, Association Française pour les Règles de Conception et de Construction des chaudières Electro-Nucléaires (www.afcen.org)
[3] Marie S., Kayser Y., Drubay D., Nédélec M., Deschanels H., Sperandio M. Overview of the AFCEN RCC-MRx CODE Appendix A16 devoted to Leak-Before-Break procedure and defect assessment
[4] Kayser Y., Marie S., Poussard Ch. and Delaval Ch, Leak before break procedure – Recent modifications of RCC-MR Appendix and proposed improvements, International Journal of
Pressure Vessels and Piping, IPVP-D-07-00003
[5] Turner C.E. and Kolednik O., Application of energy dissipation rate arguments to stable crack growth, Fatigue and Fract. Eng. Mate. And Struct., Vol. 17, n°10, 1994, pp 1990-1127
[6] Marie S. (1999). Approche énergétique de la déchirure ductile, PHD of Poitiers University, report CEA-R-5871
[7] Krakowiak C., Kayser Y., and Deschanels H., Leak before break procedure for high temperature reactors – Crack opening profile studies for complex-shaped defects in thick components
[8] Deschanels H., Drubay B., Michel B., Cambefort P. and Marie S. (May 4-7 2003)., “Leak Before Break procedure for high temperature applications – Improvements and Validation” ICAPP’03 Cordoba, Spain, Paper 3139
[9] AHN S. H. and al (1997), Fatigue crack growth and penetration behaviour in pipe subjected to bending load, SMIRT 14, Lyon
[10] Large scale elbow test “Fracture mechanics considerations in breeder reactor design” Final report 1984, Novatome-Ident No.AFAL.MAT.850.GEN.SN.001
[11] Bhandari H., Deschanels H., Spérandio M., Faidy C., Setz A. W. (15-20. Aug. 1993). Tests on large scale LMFR piping Part II:Analysis of through-cracked straight pipes DN 700 tested under bending at RTand 550°C, SMIRT 12 Conference, Stuttgart paper GF10/2
[12] Setz W., Fôrster K., Bhandari S., Debaene J. P. and Faidy C. (September 2, 1995). Tests on large scale LMFR piping Part I: crack resistance properties of through-cracked straight 700 mm nominal diameter pipes tested under bending at ambient temperature and 550°C, Nuclear Engineering and
design, Volume 158, issue 2-3, p. 203-215 ISSN: 0029-5493
[13] Turbat A., Deschanels H., Sperandio M. and Faidy C., The use of LBB concept in French fast reactors: Application to SPX plant, LBB 95 Lyon
[14] Deschanels H., Spérandio M., Turbat A. (August 1995). Numeric simulations of crack opening areas for LBB applications, SMIRT 13 Conference, paper E01/3 – Porto Alegre, Brasil
[15] May Milne I. et al. May 2006. Assessment of the integrity of the Structures Containing Defects”,