University of Windsor University of Windsor
Scholarship at UWindsor
Scholarship at UWindsor
Electronic Theses and Dissertations Theses, Dissertations, and Major Papers
2014
Effect of suction on local scour around circular bridge piers
Effect of suction on local scour around circular bridge piers
Mohammed Jahan
University of Windsor
Follow this and additional works at: https://scholar.uwindsor.ca/etd
Recommended Citation Recommended Citation
Jahan, Mohammed, "Effect of suction on local scour around circular bridge piers" (2014). Electronic Theses and Dissertations. 5136.
https://scholar.uwindsor.ca/etd/5136
This online database contains the full-text of PhD dissertations and Masters’ theses of University of Windsor students from 1954 forward. These documents are made available for personal study and research purposes only, in accordance with the Canadian Copyright Act and the Creative Commons license—CC BY-NC-ND (Attribution, Non-Commercial, No Derivative Works). Under this license, works must always be attributed to the copyright holder (original author), cannot be used for any commercial purposes, and may not be altered. Any other use would require the permission of the copyright holder. Students may inquire about withdrawing their dissertation and/or thesis from this database. For additional inquiries, please contact the repository administrator via email
i
EFFECT OF SUCTION ON LOCAL SCOUR AROUND CIRCULAR BRIDGE PIERS
By
Mohammed Jahan
A Thesis
Submitted to the Faculty of Graduate Studies
through the Department of Civil and Environmental Engineering in Partial Fulfillment of the Requirements for
the Degree of Master of Applied Science at the University of Windsor
Windsor, Ontario, Canada
2014
ii
EFFECT OF SUCTION ON LOCAL SCOUR AROUND CIRCULAR BRIDGE
PIERS
by
Mohammed Jahan
APPROVED BY:
______________________________________________ R. Barron
Department of Mathematics and Statistics, University of Windsor
______________________________________________ V. Roussinova
Department of Civil and Environmental Engineering, University of Windsor
______________________________________________ R. Balachandar, Co-Advisor
Department of Civil and Environmental Engineering, University of Windsor
______________________________________________ T. Bolisetti, Advisor
Department of Civil and Environmental Engineering University of Windsor
iii
AUTHOR’S DECLARATION OF ORIGINALITY
I hereby certify that I am the sole author of this thesis and that no part of this thesis has
been published or submitted for publication.
I certify that, to the best of my knowledge, my thesis does not infringe upon anyone‟s
copyright nor violate any proprietary rights and that any ideas, techniques, quotations, or
any other material from the work of other people included in my thesis, published or
otherwise, are fully acknowledged in accordance with the standard referencing practices.
I declare that this is a true copy of my thesis, including any final revisions, as approved
by my thesis committee and the Graduate Studies office, and that this thesis has not been
iv
ABSTRACT
An experimental study was conducted in the Hydraulics Laboratory of the University of
Windsor, involving analysis of local scour around circular model bridge piers placed on a
non-cohesive sand bed, with suction and no suction conditions. Experiments were
conducted using three model circular piers. The results show that a narrower pier will
induce a large value of depth averaged channel mean velocity in comparison to a wider
pier in the same flow field. Furthermore, suction generally creates larger equilibrium
scour depth, and increases near bed velocity, and decreases friction velocities with
increasing suction. The present results indicate that, generally, scour rate with suction at
the beginning of the test is higher than the scour rate with no suction condition. It was
also observed in the present study that the percentage increase of equilibrium scour depth
was almost 23% for 5% suction and 42% for 10% suction in comparison to no suction
v
ACKNOWLEDGEMENTS
First of all, I would like to express my gratitude to Almighty ALLAH for giving His
blessings to complete this thesis. I also like to express my sincere appreciation and deep
sense of gratitude to my Advisor Dr. Tirupati Bolisetti for his guidance, encouragement
and personal concern throughout the course of this research work. My sincere
acknowledgement also goes to co-Advisor Dr. Ram Balachandar for his invaluable and
helpful suggestions and guidance in this work.
Special thanks to Matt St. Louis and Mr. Prashanth for their assistance and help
throughout the laboratory program of my research. I want to use this opportunity to
express my sincere thankfulness to my wife, daughter and son for their constant support
vi
DEDICATION
This thesis is dedicated to my late mother Mrs. Rawshan Ara Parul. The dedication also
goes to my father Md. Golam Mostofa who is 83 years old and gave me continuous
encouragements over the telephone from my back home country (Bangladesh).
vii
TABLE OF CONTENTS
AUTHOR‟S DECLARATION OF ORIGINALITY ... iii
ABSTRACT ... iv
ACKNOWLEDGEMENTS ... v
DEDICATION ... vi
LIST OF TABLES ... ix
LIST OF FIGURES ... x
NOMENCLATURE ... xiv
INTRODUCTION ... 1
1.1 Background ... 1
1.2 Objectives ... 4
1.3 Scope ... 4
1.4 Organization of Thesis ... 5
LITERATURE REVIEW ... 6
2.1 Introduction ... 6
2.2 Seepage Effect on Local Scour ... 7
2.3 Scouring Processes... 11
2.4 Prediction Methods for Bridge Pier Scour ... 13
2.5 Some Important Scour Equations ... 14
2.6 Past Experimental Studies... 16
2.7 Issues with Experimental Studies ... 19
EXPERIMENTAL SETUP AND PROCEDURE ... 22
3.1 Experimental Setup ... 22
3.2 Test Procedure and Details of ADV ... 26
3.3 Experimental Program ... 29
RESULT AND ANALYSIS ... 32
4.1 Introduction ... 32
4.2 Effect of Flow Shallowness ... 34
4.3 Temporal Effect on Local Scour Depth ... 48
4.4 Suction Effect on Local Scour ... 58
viii
CONCLUSIONS AND RECOMMENDATIONS ... 68
5.1 Conclusions ... 68
5.2 Recommendations ... 69
REFERENCES ... 70
APPENDIX A ... 78
APPENDIX B ... 80
APPENDIX C ... 84
APPENDIX D ... 86
ix
LIST OF TABLES
Table 2.1: Summary of results of previous investigations ... 10
Table 3.1: Experimental program: effect of flow shallowness ... 30
Table 3.2: Experimental program: temporal effects on local scour depth ... 30
Table 3.3: Summary data of experimental runs ... 31
Table 4.1: Percentage of equilibrium scour depth and deposit with 7% suction and no suction for different time durations... 58
Table 4.2: Comparisons of percentage change of equilibrium scour depth ... 65
x
LIST OF FIGURES
Fig. 2.1. Definition sketch of flow field in the vicinity of a pier ... 11
Fig. 2.2. Schematic of local scour showing horseshoe and wake vortices around cylindrical pier (adapted from Yu and Yu, 2010) ... 12
Fig. 2.3. Schematic diagram of velocity profile over permeable bed with suction ... 19
Fig. 3.1. Schematic profile for the flume and pier model ... 22
Fig. 3.2. Sieve analysis of sand ... 23
Fig. 3.3. Longitudinal view of model pier in suction zone ... 25
Fig. 3.4. Plan view of model pier in suction zone... 25
Fig. 3.5. Velocity in water (left part) and in air (right part) ... 28
Fig.4.1. Schematic diagram of Measurement system for scour features and profiles ... 33
Fig. 4.2. Ripple formation at locations far upstream and downstream of the pier study area ... 33
Fig. 4.3. Experimental velocity profiles for experiment 1, 3 and 4 in outer layer ... 36
Fig. 4.4. Experimental velocity profiles for 1, 3 and 4 in inner layer ... 36
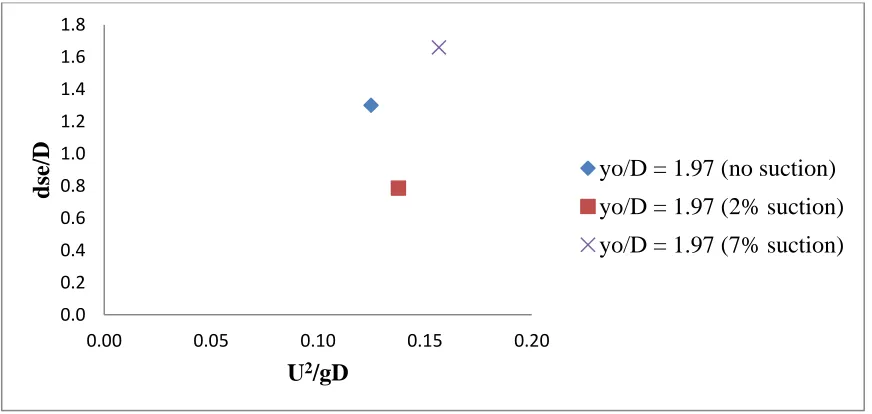
Fig. 4.5 Variation of dse/D with Euler number (U2/gD) for the same y0/D = 1.67 with suction and no suction ... 38
Fig. 4.6. Variation of dse/D with Euler Number (U2/gD) for the same y0/D = 1.97 with suction and no suction ... 38
Fig. 4.7. Variation of scour hole for the same y0/D with suction and no suction ... 40
Fig. 4.8. Variation of deposit for the same y0/D with suction and no suction ... 40
Fig. 4.9. Variation of scour hole for the same y0/D = 1.67 with suction and no suction .. 41
xi
Fig. 4.11. Variation of scour hole for different y0/D with no suction ... 42
Fig. 4.12. Variation of deposit for different y0/D with no suction ... 42
Fig. 4.13. Influence of y0/D on local scour depth expressed as dse/D ... 43
Fig. 4.14. Schematic illustration of the scour hole development for the plain pier a) scour
pattern b) sketches of scour hole with time ... 49
Fig. 4.15 Temporal variation of scour depth for the experiment no. 2 (without seepage)
and experiment no. 11 (with 7 % suction) in Arithmetic scale ... 51
Fig. 4.16. Time evolution of scour depth (Y vs. T) with 7% suction and no suction ... 52
Fig. 4.17. Scour rate for 7% suction and with no suction (dY/dT vs. Y) ... 52
Fig. 4.18. Dimensional centerline profiles for Experiment 2 (no suction) and Experiment
11 (7% suction) after 1 hour ... 53
Fig. 4.19. Non-dimensional centerline profiles for Experiment 2 (no suction) and
Experiment 11 (7% suction) after 1 hour ... 54
Fig. 4.20. Dimensional centerline profiles for Experiment 2 (no suction) and Experiment
11 (7% suction) after 4 hours ... 54
Fig. 4.21. Non-dimensional centerline profiles for Experiment 2 (no suction) and
Experiment 11 (7% suction) after 4 hours ... 55
Fig. 4.22. Dimensional centerline profiles for Experiment 2 (no suction) and Experiment
11 (7% suction) after 8 hours ... 55
Fig. 4.23. Non-dimensional centerline profiles for experiment 2 (no suction) and
experiment 11 (7% suction) after 8 hours ... 56
Fig. 4.24. Dimensional centerline profiles for experiment 2 (no suction) and experiment
xii
Fig. 4.25. Non-dimensional centerline profiles for experiment 2 (no suction) and
experiment 11 (7% suction) after 24 hours ... 57
Fig. 4.26. Mean velocity profiles for Experiment 6 (no suction) and Experiment 7 (2%
suction) ... 59
Fig. 4.27. Mean velocity profiles for Experiment 2 (no suction) and Experiment 8 (5 %
suction) ... 59
Fig. 4.28. Mean velocity profiles for Experiment 2 (no suction) and Experiment 10 (6 %
suction) ... 60
Fig. 4.29. Mean velocity profiles for Experiment 2 (no suction) and Experiment 11 (7 %
suction) ... 60
Fig. 4.30. Mean velocity profiles for Experiment 2 (no suction) and Experiment 12 (10 %
suction) ... 61
Fig. 4.31. Dimensional scour hole with no suction and 2 %, 5%, 6%, 7%, and 10%
suction (48 hours test) ... 62
Fig. 4.32. Non-Dimensional scour hole with no suction and 2 %, 5%, 6%, 7%, and 10%
suction (48 hours test) ... 63
Fig. 4.33. Dimensional deposit profile for no suction and different suction (2%, 5%, 6%,
7%, and 10%) after 48 hours test duration ... 63
Fig. 4.34. Non-Dimensional deposit profile for no suction and different suction (2%, 5%,
6%, 7% , and 10%) after 48 hours test duration ... 64
Fig. 4.35. Dimemensional centerline profile for no suction and different suction (2%, 5%,
xiii
Fig. 4.36. Non-dimensional centerline profile for no suction and different suction (2%,
5%, 6%, 7%, and 10%) after 48 hours test duration ... 65
xiv
NOMENCLATURE
ACRONYMS
ADV Acoustic Doppler Velocimeter
CSU Colorado State University
WDOT Washington State Department of Transportation
FHWA‟s HEC-18 Federal Highway Administration, Hydrological Engineering Circular
SYMBOLS
dse equilibrium scour depth
D model pier diameter
yo approach flow depth
y vertical or wall normal distance
d50 diameter of sand, 50% of which is finer by weight
σg geometric standard deviation of sand bed particle
Cu uniformity coefficient of sand bed particle
Cc coefficient of gradation
U* shear velocity
U+ velocity in inner coordinate (velocity scaled by the friction velocity = U/U*)
y+ depth in inner coordinate (or depth scaled by friction velocity = yU*/ ν)
Ue free stream velocity
δ boundary layer thickness
xv ks bed roughness coefficient
Uc critical mean flow velocity
critical shear velocity
Fdoppler change in received frequency (Doppler shift)
F source frequency of transmitted sound
V velocity of source relative to receiver
C speed of sound
τw wall shear stress
ρ density of water
𝛾 specific weight of water
ν kinematic viscosity of water
U turbulence intensity
dse equilibrium local scour depth
dst scour depth at time t
Y dimensionless time-dependent scour depth = dse/dst
1
CHAPTER 1
INTRODUCTION
1.1 Background
Bridges on a river or a stream play a vital role for economic, social and cultural
improvement in any country. More than 1000 bridges have collapsed over the past 30
years in the USA, with 60% of the failures occurring due to scour. This serious problem
also happens in many East Asian countries, such as Taiwan, Japan, Korea, owing to the
fact that these areas are subjected to several typhoon and flood events each year during
the summer and fall seasons. St. Anthony Falls Hydraulics Laboratory recently conducted
an automated scour monitoring system due to recent flooding to protect Minnesota
bridges in USA [50]. Scour failure tends to occur suddenly and without prior warning or
sign of distress to the structure (Lin et al., 2004). According to the National
Transportation Safety Board [39] the 1989 catastrophic collapse of the several bridges
over the Hatchie River in Tennessee (USA) resulted in the death of eight people. In an
intensive study of bridge failures in the United States, Ross et al. (1993) reported that the
Federal Highways Administration in 1978 claimed that damage to bridges and highways
from major regional floods in 1964 and 1972 estimated about $100 million per event.
There are mainly two types of scour; general and local. General scour occurs due to
natural processes and excessive shear stress at the bottom of a channel, and this type of
scour is greatly influenced by the cross-sectional shape of a river or stream (Breusers and
Raudkivi, 1991). On the other hand, local scour at a bridge pier is due to the obstruction
to the flow. Local scour is defined as “the abrupt decrease in bed elevation near a pier due
2
et al., 1969). Local scour results from the development of secondary circulation due to
curvature in the stream lines around bridge pier and vertical velocity components
(Herbich and Brennan, 1967). Further, local scour can be classified into two types: a)
clear-water scour and b) live-bed scour. In clear-water scour the bed material upstream of
the scour area remains stationary. In this case the bed shear stresses away from the
structure are less than sediment critical shear stress, which is defined as the stress when
sediment movement just starts On the other hand live-bed scour occurs when there is
general bed load transport by the stream. Here the bed shear stresses away from the
structure are greater than the critical stress. By using flow intensity (U/Uc) it is said that
clear-water scour occurs when U/Uc ≤ 1 and live-bed scour occurs when U/Uc ≥ 1. Here,
U is the depth averaged approach velocity and Uc is the critical depth averaged approach
velocity.
When a bridge is constructed on a river and the flow is partially obstructed by a bridge
pier, the flow pattern in the channel is significantly changed. The shear stresses around
the pier increase due to the formation of vortices, which aid in scouring the bed and the
bank of the channel. Accurate prediction of the scour pattern near any obstacle, such as a
bridge pier, helps to compute sediment transport and bed morphodynamics around the
obstacle. Scour reduces pier support and the effective length of friction bearing piles
which results in pier settlement, bottom rotation and/or top rotation of the pier.
Ettema et al., (2006) noted that due to the presence of an obstruction, a complex flow
field evolves with horseshoe vortices, surface rollers, and wake vortices. High
concentrations of velocities, bed shear stresses, vortices, down-flows and turbulence
3
factors leads to the removal of bed sediments from around the cylinder and the
development of a local scour hole.
A river bed of permeable material (e.g. cohesionless sand) induces suction, which can be
defined as drawing water downward, either artificially (engineering structures such as a
river intake) or naturally (surface water level of river is higher than surrounding
groundwater level) through the river bed. Suction has a significant influence on the near
bed flow field, which can change bed load movement and boundary stresses that may
lead to scouring. The study of bed-suction effects on the structure of turbulent open
channel flow has both practical and theoretical interest. Prinos (1995) found that the near
bed flow field variation due to suction (in the presence of a river intake structure)
increases boundary shear stresses, which may increase local scour and damage the intake
structure. Prinos (1995) also noted that with increasing suction rate, near bed velocities
were increased and the excess bed shear stress was calculated to be in the order of three
to eight times the respective one with no suction.
Numerous laboratory investigations of local scour around structures have been reported
in the hydraulics engineering literature. Nevertheless, there is no unifying theory to use
with confidence for safe and economic design. One of the main reasons to study local
scour around bridge piers is the uncertainty of scour failure. There is considerable
uncertainty in the use of the various existing scour depth formulae to predict scour in
field settings (Mia and Nago, 2003). Mohammed et al., (2006) stated that many
researchers developed numerous formulae for estimating maximum local scour based on
limited data, and the use of these formulae in design is uncertain because laboratory
4
banks. Therefore, it is very important to understand the local scour phenomenon which is
vital for the design of pier foundations.
1.2 Objectives
The objectives of this study are the following:
i) To review the relation between depth of flow and bridge pier diameter, and to
investigate time variations of equilibrium scour depth with no suction and
with suction
ii) To understand the effect of suction on equilibrium local scour depth
1.3 Scope
To achieve the objectives, the following steps are needed:
i) Review present and past experimental programs with suction
ii) Analyze scour geometry and deposit profiles obtained from experiments with
no suction and with varying suction rates. As stated later, six experiments
were performed for each case.
iii) Review velocity profiles with different suction rates and with no suction
5
1.4 Organization of Thesis
Appropriate literature review of experimental study on local scour around bridge piers
and seepage effect on local scour is presented in Chapter 2. The details of the acoustic
Doppler velocimeter (ADV) system, experimental set-up and procedures, and the
description of the flow system are provided in the Chapter 3. The results and the analysis
are presented in Chapter 4. Finally, conclusions and recommendations are presented in
6
Chapter 2
LITERATURE REVIEW
2.1 Introduction
This chapter discusses the current state of literature dealing with pier scour. The role of
seepage in open channel flow is discussed and the existing literature is analyzed to
evaluate the potential influence of seepage on scour. Scour around cylindrical bridge
piers in a non-cohesive sediment bed has been extensively studied in the last few decades
(e.g., Melville and Raudkivi, 1977; Melville and Sutherland, 1988; Chiew and Melville,
1987; Hoffmans and Pilarczk, 1995).
The National Cooperative Highway Research Program Project 24-27(01) discusses scour
as a design concern (Ettema et al., 2011). In addition, the report discusses the pier scour
interaction process, the influence of primary and secondary parameters, pier site
complications, leading prediction formulae, proposed design methodology, and research
needs for single-column piers and complex pier-forms. Some key aspects in the report are:
i) The flow field and the potential maximum scour depth change in accordance
with three variable- effective pier width, undisturbed approach flow depth and
erodibility of the boundary material
ii) The flow field differs substantially for narrow piers, transition pier, and wide
pier categories
iii) Estimation of potential maximum scour depth is preferred rather than the
7
depth attainable for a given pier flow field, and can be determined using the
primary variables
iv) Flow conditions commonly vary with time
Ettema et al., (2006) suggested the need for the inclusion of Euler number (U2/gD) effects
in scour prediction methods. Parameter U2/gD is useful for describing energy gradients
for flow around a pier. It can be considered to express the ratio of stagnation head U2/2g
to pier width. To preserve flow patterns, pressure head along flow paths scale directly
with the geometric scale relating a model pier in the laboratory to a pier in the field.
Based on their laboratory data, they defined a correction factor that could be used to
account for Euler number effects in laboratory scale tests.
2.2 Seepage Effect on Local Scour
Limited literature can be found on the effect of seepage on local scour around bridge
piers. Generally, seepage flow remains insignificant in comparison to the main flow.
However, sometimes it may be large enough to adversely affect the existing situation of
local scour. Since seepage can change the flow boundary condition and existing sediment
transport, scouring of the river bed would be changed accordingly. Seepage flow which
occurs at the interface between the sand-bed and the flowing water is very complex.
Results of many past investigators were sometimes contradictory in nature (Francalanci et
al., 2008; Liu and Chiew, 2012). The critical shear stress near a sediment bed and the
boundary shear stress are the two important factors which determine increase or decrease
of local scour depth under the influence of seepage. Many changes in the characteristics
of the flow in the presence of seepage are interrelated and apparently difficult to
8
Most researchers accept that bed suction increases the bed shear stresses as reported by
Maclean and Willets (1986), Maclean (1991), Prinos (1995) and Chen and Chiew (2004),
but the magnitude of the increase remains a point of contention. The extent of increase or
decrease of sediment transport rate depends upon the flow regime (which relates
bed-forms in alluvial channels to flow velocity). Richardson and Richardson (1985) found
that for the lower flow regime the sediment transport rate increased with injection
seepage. In the lower flow regime, sediment transport rate becomes very low due to flow
velocity remains below critical entrainment velocity resulting in lower plane bed, ripples
marks, and slightly larger dunes. Oldenziel and Brink (1974) observed that injection
increased the sediment transport. Willets and Drossos (1975) concluded that suction near
the sand bed enhanced the rate of sediment transport if the extent of the suction zone was
limited. Seepage injection inhibits the motion of bed particles, while suction enhances it.
Using one of the flumes at the Hydraulic Engineering Laboratory at the University of
Windsor, Faruque (2009) conducted experiments by introducing various degrees of
suction and injection. He showed that for two different flow rates, suction increases the
near-bed velocity and decreases bed shear stress, resulting in reduced bed stability. On
the other hand, injection decreases the near-bed velocity and increases the bed shear
stress, resulting in increased bed stability. Faruque (2009) also showed that the effect of
seepage on different turbulent characteristics was not restricted to the near-bed region but
could be seen throughout the flow depth. Seepage can change the rate of sediment
transport and eventually affect the depth of local scour.
Chiew and Hong (2013) conducted experiments in the presence of a pier with 2% suction.
9
located near the pier and 6.4D downstream distance from the pier centre repectively (D =
pier diameter) in comparison with the no suction condition.
Dey and Sarker (2007) conducted an experimental study of injection seepage through the
river bed downstream of an apron of a sluice gate. They found that equilibrium scour
depth and many other scour geometry parameters increased with increase of injection.
Francalanci et al., (2008) showed experimentally that suction caused scour and injection
produced deposition. Francalanci et al., (2006) also showed that the flow field in the
vicinity of bridge piers was characterized not only by highly non-hydrostatic pressure
fields, but also by two dimensional patterns of boundary shear stress.
Maclean and Willetts (1986) experimentally measured the shear stress using indicator
grains and reported an increase in bed shear stress over a suction zone associated with a
submerged type of river intake structure. In later work, Maclean (1991) conducted
laboratory experiments to determine the increase in bed shear stress and local scour with
a mobile bed, and the final scour depth was found to be directly proportional to the
difference between the initial bed shear stress because of suction and the threshold bed
shear stress for the bed grains in the presence of suction. Prinos (1995) reported much
higher bed stresses than that obtained by Maclean and Willets (1986) for the same suction
rate.
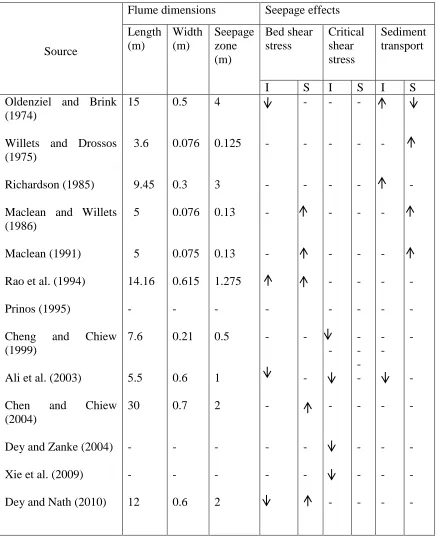
The following table shows the research findings of past studies on the effect of seepage
10
Table 2.1. Summary of results of previous investigations (Source: Liu and Chiew, 2012)
Source
Flume dimensions Seepage effects
Length (m) Width (m) Seepage zone (m) Bed shear stress Critical shear stress Sediment transport
I S I S I S Oldenziel and Brink
(1974)
Willets and Drossos (1975)
Richardson (1985)
Maclean and Willets (1986)
Maclean (1991)
Rao et al. (1994)
Prinos (1995)
Cheng and Chiew (1999)
Ali et al. (2003)
Chen and Chiew (2004)
Dey and Zanke (2004)
Xie et al. (2009)
Dey and Nath (2010) 15 3.6 9.45 5 5 14.16 - 7.6 5.5 30 - - 12 0.5 0.076 0.3 0.076 0.075 0.615 - 0.21 0.6 0.7 - - 0.6 4 0.125 3 0.13 0.13 1.275 - 0.5 1 2 - - 2 - - - - - - - - - - - - - - - - - - - - - - - - - - - - - - - - - - - - - - - - - - - - - - - - - - - - - - - - - - - - -
Letter „I‟ denotes Injection and „S‟ denotes Suction, and means increasing and
11
2.3 Scouring Processes
When a structure is placed in a current, the flow is accelerated around the structure and
the vertical velocity gradient of the flow is transformed into a pressure gradient on the
leading edge of the structure. This pressure gradient results in a downward flow that
impacts the bed. At the base of the structure, this downward flow forms vortices whose
ends are swept around and downstream of the structure by the surrounding flow field (Fig.
2.1). The downward flow velocity at the nose of a bridge pier and a vortex system
(comprised of a horseshoe-vortex, a wake vortex and a surface roller) are the basic
components of flow fields that cause local river-bed scour at or near bridge piers.
Surface roller D Pier Water Surface
Wake vortex
y0 Horseshoe vortex
scour depth
12
Fig. 2.2. Schematic of local scour showing horseshoe and wake vortices around cylindrical piers (adapted from Yu and Yu, 2010)
According to Muzzammil and Gangadhariah (2003), the power of the vortices in front of
the pier is proportional to the mean flow velocity, U. The vortices contain an energy that
is dissipated in the following form:
Power per unit mass = = Ap (1)
Where v is the mean velocity of the vortex, lv is the length defined as the vortex size, and
Ap is constant of the order one, independent of the Reynolds number.
The relationship between the vortex velocity and the flow velocity is nearly constant in a
circular pier. The mean velocity of the flow can be expressed as:
U = q/ (y0 + dse) (2)
Here, y0 is the water depth, dse is the equilibrium scour depth measured from the bed level
and q is the unit flow discharge
Experiments by Ettema (1980) revealed that for a circular cylinder and no scour hole, the
maximum downward velocity is approximately 40% of the mean approach velocity.
13
The maximum scour depth has been the primary concern in the study of local scour
around bridges and most researchers have concentrated on this measurement, which has
been expressed as the relative scour depth, dse/D for clear-water and live-bed scour. Many
researchers, e.g., Shen et al., (1969), and Jain and Fischer (1980) have recognized the two
independent components of scour depth: i) scour depth due to pier, and ii) change in bed
elevation due to bed features.
2.4 Prediction Methods for Bridge Pier Scour
By conducting extensive research with laboratory and field data, various prediction
methods for bridge pier scour have been developed, (e.g. Melville and Sutherland, 1988;
Mia and Nago, 2003; Ashtiani et al., 2009). More than 35 different formulae have been
proposed for scour estimation since 1949. Hopkins et al., (1980) stated that over the past
century many investigators attempted to develop a simple scour prediction formula, and it
appeared that a set of variables were arbitrarily selected and data collected over a limited
range to determine their relationship to scour depth. This approach has left engineers with
a large number of sometimes conflicting formulae to predict scour.
Breusers et al., (1977) identified many variables which influence local scour. To lessen
cost and complexities, Copp and Johnson (1987) limited these variables to eight
considering alluvial, non-cohesive, uniform particle-sized bed materials, and working
with single piers that were perfectly smooth and aligned with the approach flow and
without scour protection systems. The functional relationship was expressed as:
14
Where ρ is the density of water, υ is the kinematic viscosity of water, g is the acceleration
due to gravity, d is the grain diameter, ρs is the density of sediment, y0 is the approach
flow depth and D is the diameter of pier.
2.5 Some Important Scour Equations
Dimensional analysis provides (Breusers, 1967)
[
] (4)
Where U* is the friction velocity and is a constant
Truc and Khai (1982) used the diameter of the primary forced vortex,
and available experimental and field data to develop a new practical design relation.
( )nkdkαksh (5)
Where U is the mean velocity of flow directly upstream of pier(m/s), Vc is the tangential
velocity at the edge of the vortex, kd is the relative sediment factor = 1+ , Vc
= √ (m/s), ωd is the circular characteristic velocity with sediment, K =
0.93, n = 1.5 for V≥ Vc, and K = 1.21, n = 0.57 for V< Vc, and k and ksh = correction
factors for angle of attack and pier shape respectively
Hafez (2004) developed an equation using energy balance theory. The energy balance
theory assumes that at the equilibrium geometry of the scour hole, the work done by the
attacking fluid flow upstream the bridge pier is equal to the work done in removing the
15
coming from upstream of the bridge pier in the stagnation symmetry plane was expressed
as:
W = (y0/2 + dse/2) (6)
Where Vx is the longitudinal flow velocity of the jet attacking the bridge in the direction
normal to the pier, d is the bed material sediment diameter, is the transfer coefficient of
the horizontal momentum into a vertical momentum in the downward direction, and B is
the channel width
The work done in removing the bed material from the scour hole is equal to:
W = ( d) (1- ϴ) (γs – γ) (7)
Where υ is the slope of the scour hole in symmetry plane, ϴ is bed material porosity, γs is
bed material unit weight, and γ is fluid unit weight
This equation yielded much superior agreement with field data than any other existing
empirical equation when applied to the average and maximum of 515 field data. It
showed better results than many other equations when applied to Imbaba and El-Tahreer
bridges near Cairo, Egypt.
In the late twentieth century the Washington State Department of Transportation (WDOT)
utilized the Laursen and Toch (1956) equation to estimate scour depth:
dse/D = 15 (y0/D) (8)
Ettema et al., (2001) developed an equation for the scour depth as:
( ) = ( )0.62( )0.2(
)
0.08
(9)
16
The Federal Highway Administration‟s Hydraulic Engineering Circular No.18 (HEC-18)
U.S. Department of Transport (1993) recommends the use of the local scour formula of
Colorado State University (CSU):
= 2.0 K1K2( )0.65 (10)
Where K1 is correction factor for pier nose shape, K2 = correction factor for angle of
attack, Fr1= Froude number at upstream of the pier and y is the vertical or wall normal
distance.
Melvile and Sutherland (1988) developed a scour formula based on extensive laboratory
experimentations. The formula is:
dse = KlKdKyKaKsD (11)
Where Kl is the flow intensity factor, Kd is the sediment size factor, Ky is the flow depth factor, Ka is the pier-alignment factor and Ks is the pier-shape factor.
2.6 Past Experimental Studies
Hodi (2009) studied the effect of blockage and densimetric Froude number on bridge pier
local scour by doing experimental studies. Experiments were conducted in two flumes of
different widths utilizing piers of various diameters. Significant blockage effect (greater
difference in scour geometry) was observed increasing the blockage ratio from 2.2% to
5%. Further he noted that small changes in the absolute value of densimetric Froude
number can have a large influence on maximum scour depth and scour geometry.
Mohamed et al., (2006) carried out laboratory experiments and field data studies to obtain
pier scour information. They compared the measured scour depths obtained from the
laboratory experiments with computed scour depths using selected formulae. It appears
17
Melvile and Sutherland (1988) formulae appear to over-predict the depth of scour for
both the laboratory model and field prototype. The over prediction in the case of field
results is even greater compared with that of the laboratory model.
Ettema et al., (2006) experimentally established a direct trend (values of normalized
scour depth increased when cylinder diameter decreased) between equilibrium scour
depth and the intensity and frequency of large-scale turbulence shed from each vertical
cylinder in a sand bed. Carollo et al., (2008) described the results of the turbulence
intensity in gravel bed channels by using an acoustic Doppler velocimeter (ADV) in a
laboratory flume. The collected data allowed the velocity fluctuations to be measured and
the large-scale turbulent structure to be analyzed. On the basis of their measurements, the
writers observed an ordered sequence of long-term large-scale vortices moving
downstream with the same velocity as the mean, and producing a motion of fluid toward
both the bed and the free surface, involving the whole flow depth. Moving from the bed
towards the free surface, even if the size of the large scale vortices increases, the
turbulence phenomenon intensity decreases. The longitudinal turbulence intensity
decreased progressively as the distance from the bed increases, with the exception of the
thin layer close to the wall (depth scaled by friction velocity = yU*/ ν = y+ 10-20) ,
where the viscous effects exceed the turbulent fluctuations (Nezu and Nakagawa 1993).
Ettema et al., (2001) presented the data suggesting that the scour depth at piers did not
scale linearly with pier width unless there was more-or-less complete geometric
similitude of pier, flow and bed sediment particles. The non-linearity can result in
laboratory flume studies of local scour (at scale-reduced model piers) leading to deeper
18
associated with turbulence structures in the pier flow field can be characterized in terms
of a pier Euler number, Eu = and the frequency of vortex formation and break-up or
shedding in terms of pier Reynolds number, which influences the frequency of shedding.
They noted that smaller cylinders in the same flow generate eddies at a greater rate.
Clark (1968) found that the distribution of turbulence intensity does not depend on either
the Reynolds number or the Froude number and can be described by a single curve. In the
three- dimensional case, because of the influence of the walls, the maximum value of
flow velocity appears at a distance from the bed, δ smaller than the water depth, y0.
Liu and Chiew (2012) conducted laboratory experiments with different suction to show
suction effects on sediment entrainment quantitatively. When the hydrodynamic forces
exerted on the sediment particles just exceed the resistive forces, particles begin to move.
This phenomenon is defined as the “incipient motion” or “threshold condition”. Only
visual observation is not sufficient to determine the precise threshold condition for a
specific case. Therefore, various investigators have conducted different methods to
identify the incipient motion. By using qb = 0.0432x 10⁻⁶ m2/s as the bed load transport
rate at the threshold condition, Liu and Chiew (2012) showed that the suction velocities
(Vs) help to initiate sand particle movement. The combined results provide an overall
view on suction effects on the initiation of cohesionless sediment motion, showing that
the downward seepage (suction) increases the critical shear velocity.
Chen and Chiew (2004) conducted experiments using a laser Doppler velocimeter by
Dantec, with and without suction, and suction rates were 1.53% and 0.86%. The
measured data confirmed a significant increase in the near bed velocity and the reduction
19
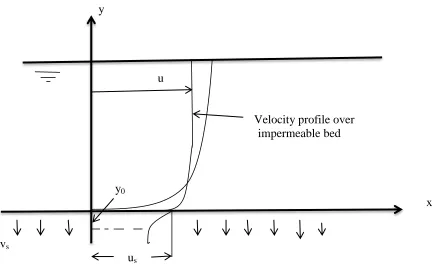
distribution with comparison to no suction condition. Schematic diagram of velocity
profile is shown in the following figure.
y
u
Velocity profile over impermeable bed
y0
x
vs
us
Fig. 2.3. Schematic diagram of velocity profile over permeable bed with suction
Where, u is the time-average streamwise velocity at a distance y from the boundary, y0 is
vertical displacement of the origin of the mean velocity profile, us is slip velocity at the
bed surface and vs is suction velocity
2.7 Issues with Experimental Studies
Depending on the water level and scour around the foundation, the flow field in the
vicinity of the pier may vary significantly. The inherent difficulty of scaling y0, D, and
d50 makes hydraulic modeling intrinsically approximate. After reviewing some past
experimental studies on bridge piers local scour, some similarity in the formulae for
20
equations are similar, their results differ widely from each other when applied to a
specific case. As there is no single, universally accepted equation was reported to date
because of the complexity of local scour. The choice of a scour prediction equation is
also subject to an unknown level of uncertainty. Experimental studies have been
conducted by considering only certain aspects of the problem and accepting the other
parameters as constants. Experimental relationships may be inadequate because of the
large number of parameters that affect scour. Potential maximum local scour depth from
experimental studies in the laboratory may vary significantly in real field because of the
following reasons:
i) Formulae are based on limited data
ii) Simplified conditions in the lab
iii) Generally laboratory flumes are rectangular in cross section and these have
smooth and fixed walls
iv) In real field situations, channels are non-rectangular in cross section with mobile
banks and over bank flow occurs frequently and lateral flow distribution is
non-uniform
v) Generally predictive scour equations from laboratory flume tend to estimate
excessive pier scour than real field
vi) Complexities of flow field
vii) Variation in channel boundary materials
Most of the investigators established scour equations based on the experiments carried
out in fixed wall laboratory flumes, which do not represent the real situation in the field.
21
experimental conditions are close to the field situation. The results from the experimental
approach should be compatible with the present-day theories of fluid mechanics and
sediment transportation. The factors affecting the scour phenomenon can be controlled in
the laboratory to an extent that is not possible in the field.
Melville and Chiew (1999) stated that due to poor correlation between scour-depths
observed in the field and these measured in the laboratory, and in order to achieve
equilibrium conditions in small-scale laboratory experiments of clear-water scour depth
development at bridge foundation, it was necessary to run the experiments for several
days. Data obtained after lesser time, say 10 to 12 h, can exhibit scour-depth less than 50%
of the equilibrium depth. The time for equilibrium depth of scour to develop and the
equilibrium depth of local scour at a circular pier are inherently interdependent. In the
literature there are limited information concerning the required time to reach the
22
CHAPTER 3
EXPERIMENTAL SETUP AND PROCEDURE
3.1 Experimental Setup
Experiments were conducted in a horizontal flume of 9.0 m long, 1.10 m wide, and 0.920
m deep at the University of Windsor. The bottom of the flume was made of aluminum
and the flume sides were made of Plexiglas supported by a metal frame. A schematic of
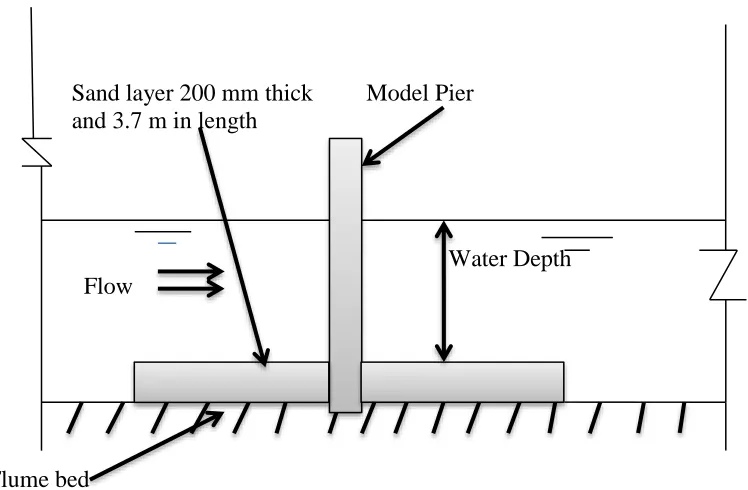
the side view of the experimental setup including sand bed, pier model and flume is
shown in Fig.3.1.
Sand layer 200 mm thick Model Pier and 3.7 m in length
Water Depth Flow
Flume bed
Fig. 3.1. Schematic profile for the flume and pier model
Twelve experimental runs were conducted in this proposed study. The experiments
utilized three different circular test cylinders with diameters of 51, 38 and 30 mm and a
23
make the flow two-dimensional the value of aspect ratio, B/yo (channel width/flow depth)
was maintained greater than 11, and velocity measurements were conducted along the
centerline of the flume (Nezu, 2005). Blockage ratio, D/B (model pier diameter/channel
width) was restricted to less than 5% (i.e. 2%- 4%) to reduce the blockage effect.
Uniform flow is achieved in the flume by using a variable speed pump, distribution
manifold and flow straighteners. The sand bed is 3.7 m long, 0.20 m deep and spans the
entire width of flume. The sieve analysis of the sand is shown in Fig. 3.2.
Fig. 3.2. Sieve analysis of sand
The mean particle size of sediment, d50 = 0.51 mm, was taken as the representative
particle size of the sediment. The sand size was selected to maintain D/d50 greater than 50
to overcome the influence of sediment size on local scour depth (Ettema, 1980). The
geometric standard deviation, σg, the uniformity coefficient, Cu, and coefficient of
gradation, Cc were calculated using following equations (Terzaghi et al., 1996).
0.0 20.0 40.0 60.0 80.0 100.0 120.0
0.00 0.20 0.40 0.60 0.80 1.00
%
p
assi
n
g t
h
ro
u
gh
th
e
si
e
ve
24
(12)
(13)
(14)
From the sieve analysis, σg, Cu and Cc have been found to be 1.14, 1.36, and 1.11,
respectively. A bed material is considered uniform when σg less than 1.5. Sand with Cu
less than 4 is considered uniform soil and Cc = 1 regarded as well graded soil (Das, 2005).
The physical characteristics of the sand are given below.
i) Specific gravity : 2.65
ii) Porosity : 39%
iii) Acid solubility : 1%
iv) Hardness (MOH) : 7
v) Grain shape : Round to sub-angular
Seepage effects on local scour were studied only for suction. The suction zone was 2.4 m
long, 1.10 m wide and 0.125 m deep, and consisted of natural sand bed, seepage console,
fifteen parallel perforated pipes, perforated plates, filter net, two separate pumps, two
flow meters with valves, and common feeder pipe with valve. The longitudinal and plan
view of a model pier in the suction zone are shown in Fig. 3.3 and Fig. 3.4.
25
Flow Model pier
Sand 200 mm
Perforated plate and Filter cloth
15 valves
Fig.3.3. Longitudinal view of model pier in suction zone
1100 mm Flow
Model pier
15 seepage holes
26
Uniform seepage velocity was maintained over the entire sand bed by using a seepage
console and controlling valves on each drainage pipe. One pump at the upstream and
another pump at the downstream location were installed to remove water from the flume
bed to maintain the flow rate for suction, which was monitored using flow meters. The
model pier is located 7.2 m from the upstream end of the flume. Perforated pipes are used
to withdraw water from the sand bed by creating suction. Filter net is used to prevent the
sediment particles from falling down.
3.2 Test Procedure and Details of acoustic Doppler velocimeter
Before starting the test, the model pier and sand bed were carefully examined. The model
pier was placed centrally and vertically in the working section so that movement does not
occur during the test. The sand bed was levelled. To protect sediment movement and to
remove trapped air bubbles among sediment grains, the flume was slowly filled with
water and the pump was started only after one hour. For each experimental run, the flume
was allowed to drain slowly after completing the test and detailed photographs of the
scour hole and deposit were taken with a digital camera. Scour hole and sediment deposit
measurements were accomplished using a manual traverse (point gauge). Scour hole
formation is frustum shaped around the pier‟s upstream perimeter due to downflow at the
pier face creating a groove. As the groove deepens, it triggers the formation of the scour
hole. A deposition dune or mound forms downstream of the pier due to deceleration of
the sediment particles entrained from the region of high bed shear stress and pressure
fluctuations. All tests were run for a period of 48 hours, and experiments 2 and 11 which
were run for different durations (1, 4, 8, 24 and 48 hours) to understand the temporal
27
Using acoustic Doppler velocimeter (ADV), the approach flow velocity profiles for each
experiment were measured at the centreline of the flume and the ADV instrument was set
at 1.25 m from pier centre in the upstream direction. For each profile, velocities were
recorded at various depths (from approximately 7 mm near the bed level up to the water
surface). ADV operates by the principle of Doppler shift. This shift in frequency can be
calculated using the following equation.
Fdoppler = - Fsource V/C (15)
where, Fdoppler is the change in received frequency (doppler shift), Fsource is the frequency
of transmitted sound, V is the velocity of source relative to receiver and C is the speed of
sound.
The ADV uses this principle to measure the velocity of water in three dimensions. The
device sends out a beam of acoustic waves at fixed frequency from a transmitter probe.
The receiver arm of ADV receives Doppler shift measurements from a small volume in
space referred to the sample volume. The ADV then calculates the velocity components
of the water in the x, y, and z direction. Vectrino Velocimeter (Nortek AS 2004)
measured 3D flow in a cylindrical sampling volume of 7 mm diameter, located about 50
mm from the sidelooking probe. The error in velocity measurements depend on
variability in the equipment, the processes, the environment, and other sources.
Vectrino software was installed on a computer before its use in the experimental runs.
After installing the software, a functional check has been done by selecting serial port and
communication and accepting the default baud rate (9600). Probe check was
accomplished for inspecting the region where ADV makes its measurement by showing
28
have been added for checking the transducer functional capability. While transducers are
in the air, the velocity measurement will look like random noise. After immersing the
transducers in the water the graphical view of the velocity has been changed to smooth
signal. This phenomenon has been explained in Fig. 3.5. One of the most important
parameters in the measurement is Signal-to-Noise Ratio (SNR) which is defined by the
following formula.
(16)
Fig. 3.5. Velocity in water (left part) and in air (right part)
Uncertainty analysis of VectrinoVelocimeter was done using the specifications given by
the manufacturer. To perform the uncertainty analysis the bias limit i.e., the design stage
uncertainty, the product of student„t‟ value at the assigned probability P%, and precision
index i.e., the estimate of precision error at 95% confidence were calculated. This
29
value of the velocity. Gratiot et al., (2000) stated that the ADV uses acoustic techniques
to measure the velocity in a remotely sensed volume so that the measured flow is
undisturbed by the presence of the probe. The primary use of the ADV in the present
research study was to measure the vertical velocity profile along the water depth around
piers, and initial velocity measurement is possible 7 mm from the flume bed. Laser
Doppler Velocimeter was used to measure the velocity very near flume bed which is not
possible with the use of ADV. Experiments on scour were performed near threshold
condition i.e. = 0.8 (U is the approach velocity and is the critical velocity for the
sediment movement).
3.3 Experimental Program
The experiments were conducted by using a visualization technique and measuring the
flow velocity by an acoustic Doppler velocimeter (ADV). In these experimental studies
only clear-water conditions with a flat sand bed were considered. No sediment inflow
was allowed into the scour hole from upstream. Several tests were performed to visualize
the influence of flow shallowness or relative approach flow depth (y0/D) on local scour
depth and to understand the effect of time on the development of depth of scour at
circular piers considering no suction. After introducing suction, changes in local scour
were examined experimentally. The flow shallowness ratio (y0/D) ranged from 0.98 to
3.33. A total of twelve experimental runs comprising piers with diameter of 51, 38 and 30
mm, approach flow depth 0.05 m - 0.1 m and bed material size, d50 as 0.51 mm were
carried out. Table 3.1 and 3.2 summarize the test conditions, and Table 3.3 shows
30
Table 3.1: Experimental program: effect of flow shallowness
Exper iment No
Pier Diameter, D (mm)
Approach flow depth, y0 (mm)
D/d50 Test condition
1 51 50 0.98 100 No suction
2 30 50 1.67 59 No suction
3 30 75 2.50 59 No suction
4 30 100 3.33 59 No suction
5 38 100 2.63 75 No suction
6 38 75 1.97 75 No suction
7 38 75 1.97 75 2% suction
8 30 50 1.67 59 5% suction
9 38 75 1.97 75 7% suction
10 30 50 1.67 59 6% suction
11 30 50 1.67 59 7% suction
12 30 50 1.67 59 10% suction
Table 3.2: Experimental program: temporal effect on the local scour depth
Exp No.
yo D Test
condition
Test duration(hrs)
2 50 30 no suction 1
2 50 30 no suction 4
2 50 30 no suction 8
2 50 30 no suction 24
2 50 30 no suction 48
11 50 30 7% suction 1
11 50 30 7% suction 4
11 50 30 7% suction 8
11 50 30 7% suction 24
31
Table 3.3: Summary data of Experimental runs
Experiment No.
y0 (mm)
D (mm)
Q (L/s) U* (m/s)
D/d50 y0/D B/y0
1 50 51 9.03 0.028 100 0.98 22
2 50 30 9.03 0.028 59 1.67 22
3 75 30 17.81 0.012 59 2.50 15
4 100 30 21.93 0.015 59 3.33 11 5 100 38 21.93 0.015 75 2.63 11
6 75 38 17.81 0.021 75 1.97 15
7 75 38 18.70 0.031 75 1.97 15
8 50 30 9.84 0.023 59 1.67 22
9 75 38 19.94 0.019 75 1.97 15
10 50 30 9.93 0.016 59 1.67 22
32
CHAPTER 4
RESULTS AND ANALYSIS
4.1 Introduction
The primary objectives of this research study were to review the effect of flow
shallowness and temporal effect on local scour depth with and without suction by
conducting a physical hydraulic model study in the hydraulics lab of the University of
Windsor. In this chapter the results obtained from the experiments are presented. First six
experiments were conducted without suction conditions, and the remaining six
experiments were conducted with different suction rates conditions (2% to 10%). To
show the temporal behaviour of local scour features and profiles without suction and with
suction, two experiments were conducted with different time durations (1, 4, 8, and 24
hours). Experiments were conducted for three water depths (50, 75, and 100 mm), and
three model piers (51, 38, and 30 mm) in turbulent flow and clear-water scouring
conditions. The detailed measurement of scour hole and deposit profiles were
accomplished by using manual traverse. The following Fig. 4.1 shows the schematic
33
Fig. 4.1. Schematic diagram of measurement system for scour features and profiles
The issue of initiation of sediment motion was also experimentally studied. For each test,
it was observed that small ripples formed on the sand bed of the flume, centerline starting
from the upstream end and progressing downstream toward the pier study area. A
photograph showing the ripples is shown in Fig. 4.2.
Fig. 4.2. Ripple formation at locations far upstream and downstream of the pier study area
34
The clear-water scour condition would not be applicable when the ripples reached the
pier study area and the particular test was stopped. For ripple-forming sediments, which
are classified as sediments having d50 less than 0.7 mm, it is seldom possible a plane bed
condition (Breusers and Raudkivi, 1991). It might be noted that the sand used in the
current study had a median grain size of 0.51 mm.
For different y0/D, the experimental velocity profiles and the distribution of turbulence
intensities with no suction condition are shown. The changes in equilibrium scour depth
with Euler number and y0/D for no suction and with suction were found by conducting
twelve experiments. To show temporal effect on local scour, two experiments (one with
suction and another with no suction) were conducted for different time durations
illustrating dimensional and non dimensional centerline profiles for scour hole and
deposit. Mean velocity profiles, dimensional and non dimensional scour hole and deposit
profiles were found by conducting six experiments with no suction and another six
experiments with different suction rates.
4.2 Effect of flow shallowness
For different y0/D, vertical velocity profiles, and turbulence intensity along the water
depth are analyzed experimentally by measuring velocity at different water depth with an
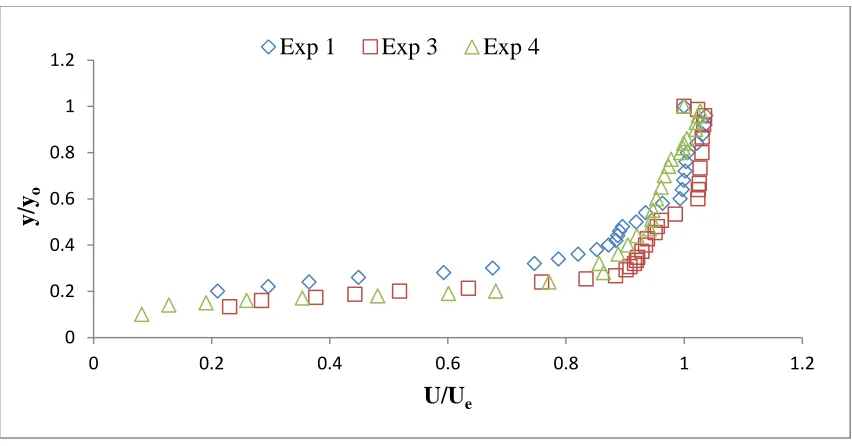
acoustic Doppler velocimeter (ADV). For experiment 1 (y0 = 50 mm), 3 (y0 = 75 mm)
and 4 (y0 = 100 mm), the velocity profiles in the outer layers are shown by plotting y/yo
versus U/Ue in the Fig. 4.3. For the shallow water depth (yo = 50 mm) the higher gradient
of velocity and shear stress attained near the bottom compared to deep water depth (yo =
35
surface. For 0.2 < y/y0 < 0.6 gradually increasing velocity and for 0.6 < y/y0 < 0.9 an
upward distribution appear for the velocity profiles. According to Pope (2000), the outer
layer corresponds roughly y+ > 50, where y+ = yU*/ν is a sort of local Reynolds number,
and a depth scaled by friction velocity. Its value is a measure of the relative importance of
viscous and turbulent transport at different distance from the wall. Free stream velocity
(Ue) and approach flow depth (yo) are used to non-dimensionalize the mean velocity (U)
and the wall normal distance (y). Faruque (2009) experimentally showed that, in the outer
region, each velocity profile shows a slight dip where the maximum velocity (Umax)
occurs slightly below the free surface, and this velocity dip would be the largest for the
sand bed among smooth, continuous roughness, and distributed roughness surface.
Roussinova et al. (2006) stated that velocity dip would not be significant when
measurements were made in the centre of the channel and the geometric channel aspect
ratio (channel width/ flow depth) is greater than five. It might be noted that the channel
aspect ratios for the experiment 1, 3, and 4 were 22, 14.67, and 11, respectively.
The velocity profiles for these three experiments in inner layers are shown in Fig. 4.4.
According to Pope (2000), the inner layer corresponds roughly to y/ δ < 0.1 or the region
over which the shear stress is approximately constant, where δ = boundary-layer
thickness. In the inner region, the flow depends on the wall shear stress (τw), the density
(ρ), the viscosity (μ) and the distance from the wall (y). For the region close to the bed,
the shear velocity is given by:
36
Fig. 4.3. Experimental velocity profiles for experiment 1, 3 and 4 in outer layer
Fig. 4.4. Experimental velocity profiles for experiment 1, 3 and 4 in inner layer
The friction velocity may be calculated for smooth and rough beds using the Clauser
method by fitting the mean velocity profiles with the classical log law, U+ = κ-1 ln y+ + B
- ∆U+ . Here, U+ = U/U*, y+ = yU*/ν, κ = 0.41 and B = 5 are log-law constants and ∆U+ is
the roughness function representing the downward shift of the velocity profile (Faruque,
0 0.2 0.4 0.6 0.8 1 1.2
0 0.2 0.4 0.6 0.8 1 1.2
y/
yo
U/Ue
Exp 1 Exp 3 Exp 4
0 4 8 12 16 20
1 10 100 1000 10000
U
+
y+
37
2009). The shear velocity was computed from the velocity profiles measured along
the centre-line of the suction zone. The critical shear velocity was calculated by using
Shields (1936) entrainment function for the of bed material and using some empirical
formulae. The relation between critical shear velocity and mean grain size can be
expressed as:
(18)
(19)
where, is in m/s and is in mm
The velocity profiles are fully developed because these profiles do not change with
downstream distance. Fully developed flows are encountered in long, straight channels
and pipes. The open channel flow is typically turbulent, and the flow is fully developed
by the time uniform flow is established.
In the same flow field, irrespective of no suction or with suction condition (from 5%
suction to 10% suction) from the same y0/D = 1.67, relative equilibrium scour depths are
increasing with the increase in Euler number. This phenomenon can be explained from
the following Fig. 4.5, and it shows that minimum Euler number attains for no suction
condition and maximum Euler number attains for 10% suction condition. The following
Fig. 4.6 shows that for the same y0/D = 1.97, relative equilibrium scour depth is reduced
for 2 % suction condition and increased for 7% suction condition in comparison to no
suction condition. Ettema et al.‟s (1998) data show that scour depth relative to pier width,
38
Fig. 4.5. Variation of dse/D with Euler number (U2/gD) for the same y0/D = 1.67 with
suction and no suction
Fig. 4.6. Variation of dse/D with Euler number (U2/gD) for the same y0/D = 1.97 with
suction and no suction 0.0 0.5 1.0 1.5 2.0 2.5
0.00 0.05 0.10 0.15 0.20
d
se
/D
U2/gD
yo/D = 1.67 (no suction) yo/D = 1.67 (5% suction) yo/D = 1.67 (6% suction) yo/D = 1.67 (7% suction) yo/D = 1.67 (10% suction) 0.0 0.2 0.4 0.6 0.8 1.0 1.2 1.4 1.6 1.8
0.00 0.05 0.10 0.15 0.20
d
se
/D
U2/gD
yo/D = 1.97 (no suction)
yo/D = 1.97 (2% suction)
39
For the same y0/D (1.97 and 1.67) the equilibrium scour hole and deposit dimension in
y-direction versus equilibrium scour hole and deposit in x- y-direction for no suction and with
2% through 10% suction have been plotted in the following Fig. 4.7 through 4.10. These
figures indicate that 2% suction creates reduced scour hole perimeter and deposit
expansion compared to no suction condition, and 7% suction creates more scour hole
perimeter comparison to 2% suction condition, and larger deposit expansion compared to
no suction condition. Maximum and minimum scour hole perimeter occur for 10%
suction and 5% suction conditions, respectively. Scour hole perimeter with no suction
condition remains second largest among 5% suction through 10% suction conditions
(shown in Fig. 4.9). Maximum and minimum deposit expansion occur for 10% suction
and no suction condition, respectively. The deposit expansions are gradually increasing
40
Fig. 4.7. Variation of scour hole with suction and no suction for y0/D = 1.97
Fig. 4.8. Variation of deposit with suction and no suction for y0/D = 1.97
-100 -80 -60 -40 -20 0 20 40 60 80 100
-100 -50 0 50 100
Y ( m m ) X (mm)
yo/D= 1.97 ( no suction)
yo/D=1.97(2%suction)
yo/D=1.97( 7% suction)
-120 -100 -80 -60 -40 -20 0 20 40 60 80 100
0 50 100 150 200 250
Y ( m m ) X (mm)
yo/D= 1.97(no suction)
yo/D=1.97(2% suction)