ISSN: 2319-8753
I
nternational
J
ournal of
I
nnovative
R
esearch in
S
cience,
E
ngineering and
T
echnology
(An ISO 3297: 2007 Certified Organization)
Vol. 2, Issue 12, December 2013
Evaluation of The Local Scour Around Group
Piers
(Babil Bridge as Case Study)
Saleh I. Khassaf
1,
Saja Sadeq Shakir
2Professor, Dept. of Civil Engineering, University of Kufa, Iraq1
M.Sc. Student, Dept. of Civil Engineering, University of Kufa, Iraq2
Abstract: The hydraulic bridges are one of the important structures that must be protected from the failure by continuous monitoring. Hence, this study is about the most common causes of bridges failure which is the local scour. In this research Hydrologic Engineering Center River Analysis System (HEC-RAS) program will be used to evaluate local scour around group piers of Babil Bridge in the middle of Iraq.
It was found that the HEC-RAS model is a good tool for predicting local scour depth for bridge piers. Where found that the computed scour depth from HEC-RAS program compares well with the observed value.
The local scour depth at group piers of Babil Bridge were calculated and found that the piers of the bridge are safe against scouring in the present time because the depth of the maximum local scour is less than the depth of foundation of the bridge.
Keywords: Babil Bridge, group piers, scour, local scour.
I. INTRODUCTION
Bridges at river crossings are critical structures that require a substantial investment to construct and has an important role in economic development. The major damage to these bridges that occurs during floods. This damage is caused by various reasons. The main reason is the local scour at bridge foundations, namely piers and abutments.
The scour can be defined as the lowering of the level of the riverbed by water erosion such that is a tendency to expose the foundations of a bridge (Melville and Coleman, 2000).
The history of bridges hydraulics is replete with incidents of failed bridges whose design did not adequately account for the capacity of alluvial rivers to erode, or scour, channel beds and banks. Images of undermined piers, undercut abutments, and washed-out bridge approaches have haunted bridge engineer since antiquity.
Investigators have used several ways and gave various of equations for estimation the depth and pattern of scour around piers.
In this study, provide a description of the methodology used to develop the hydraulic model of Babil Bridge in Al-Hilla city in Iraq. The hydraulic modeling was performed using the one-dimensional U.S. Army Corps of Engineers Hydrologic Engineering Center River Analysis System, HEC-RAS version (4.1.0, 2010). Babil Bridge model was developed to evaluate the maximum local scour depth which formed around its group piers.
II. SITE DESCRIPTION
ISSN: 2319-8753
I
nternational
J
ournal of
I
nnovative
R
esearch in
S
cience,
E
ngineering and
T
echnology
(An ISO 3297: 2007 Certified Organization)
Vol. 2, Issue 12, December 2013
Fig 1, Babil Bridge in Al-Hilla City in the Middle of Iraq
III.FIELD DATA MEASUREMENTS
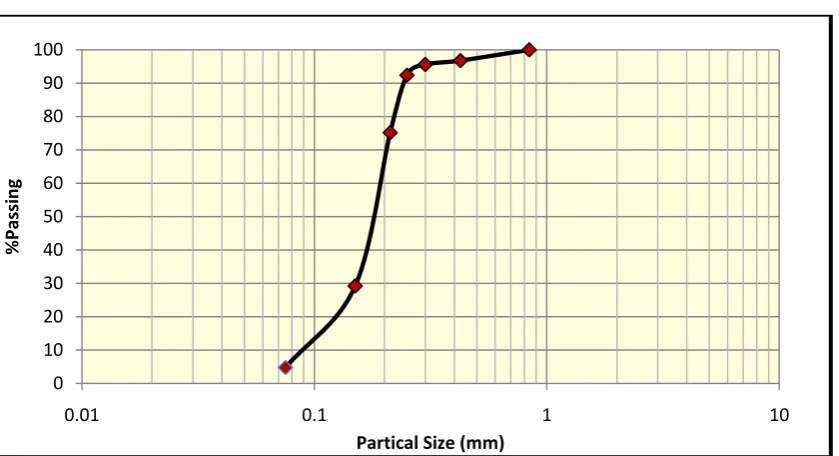
The field work are bed material sampling and the collected geometric data for the bridge. The bed material sampling was done by taking three samples from the bed material of the section near piers, at the location of 0.25, 0.5 and 0.75 the width of the river in the cross section in order to conduct the grain size analysis. These samples finally mixed well to reduce the error of measurement and get a homogenous sample.
The cross section data are obtained from Babil Water Resources Directorate (BWRD).
IV.LABORATORY MEASUREMENTS
It involves collecting of laboratory data including measurements of A- specific gravity
B- Mechanical analysis of the bed sample from which the size distribution curve can be constructed. Where the experiments was conducted in the laboratories Faculty of Engineering at University of Kufa.
ISSN: 2319-8753
I
nternational
J
ournal of
I
nnovative
R
esearch in
S
cience,
E
ngineering and
T
echnology
(An ISO 3297: 2007 Certified Organization)
Vol. 2, Issue 12, December 2013
Fig.2 Grain Size Distribution Curve of Bed Material for Shatt Al-Hilla
V.THE EFFECTIVE WIDTH OF THE PIER
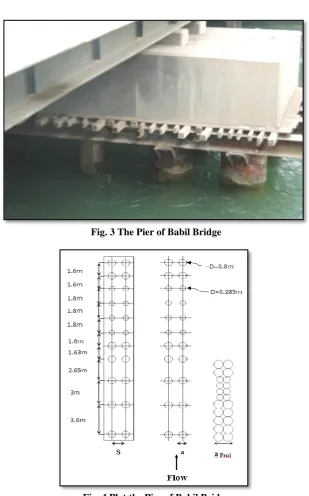
For determining the local scour around group piers in HEC-RAS program by applying the equation of HEC-18, it should use the effective width of group piers (a*pg). Where it is the product of the projected width of the piers onto a plane normal to the flow multiplied by a spacing factor and a number of aligned rows factor. Figures (3) and (4) show the pier of Babil Bridge.
a*pg = aproj Ksp Km (1)
Where:
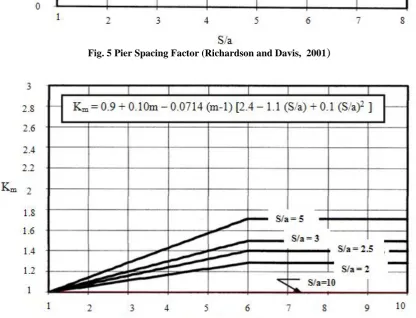
a*pg is the effective width of group piers, aproj is sum of the non-overlapping projected widths of piers, Ksp is coefficient for pier spacing as shown in figure (5), Km is coefficient for the number of aligned rows (m) as shown in figure (6). Note that Km is constant for all S/a values when there are more than six rows of piers and Km is equal to (1.0) for skewed or staggered group piers and S is spacing between piers. (Richardson and Davis, 2001; Ataie-Ashtiani and Beheshti, 2006).
For Babil Bridge, a = 80 cm, aproj = 160 cm, S = 140 cm and Ksp= 0.816 see figure (5), m = 11(number of rows) and Km = 1.21 see figure (6), then equation (1) is used to find that the effective width of group piers a*pg= 1.58 m.
0 10 20 30 40 50 60 70 80 90 100
0.01 0.1 1 10
%
Pas
si
n
g
ISSN: 2319-8753
I
nternational
J
ournal of
I
nnovative
R
esearch in
S
cience,
E
ngineering and
T
echnology
(An ISO 3297: 2007 Certified Organization)
Vol. 2, Issue 12, December 2013
Fig. 3 The Pier of Babil Bridge
ISSN: 2319-8753
I
nternational
J
ournal of
I
nnovative
R
esearch in
S
cience,
E
ngineering and
T
echnology
(An ISO 3297: 2007 Certified Organization)
Vol. 2, Issue 12, December 2013
Fig. 5 Pier Spacing Factor (Richardson and Davis, 2001
)
ISSN: 2319-8753
I
nternational
J
ournal of
I
nnovative
R
esearch in
S
cience,
E
ngineering and
T
echnology
(An ISO 3297: 2007 Certified Organization)
Vol. 2, Issue 12, December 2013
VI.BABIL BRIDGE SCOUR MODELING IN HEC-RAS PROGRAM
For this study, hydraulic model was developed using HEC-RAS [Version 4.1.0,(2010)]. The HEC-RAS model allows to perform simulation steady and unsteady flow evaluation in single or networked channels. It is an integrated system of software, designed for interactive use in multitasking, multi-user network environment.
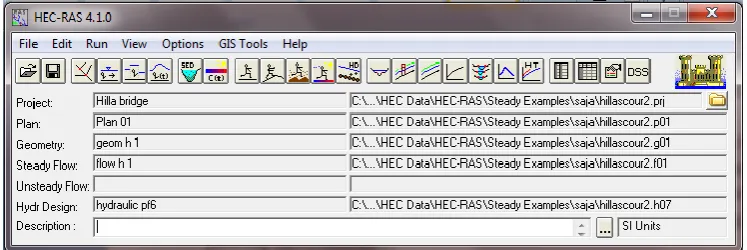
The system is comprised of a graphical user interface (GUI), separate hydraulic analysis components, data storage and management graphics and reporting facilities (HEC-RAS, 2010). Figure (7) showing the main window when you first start HEC-RAS model.
Fig. 7 Main Menu of HEC-RAS Model
To apply a bridge for a steady flow hydraulic model and to find the magnitude of maximum scour at bridge piers, two necessary file types are required:
1) The geometry file contains the necessary physical description for the stream reach and the bridge.
2) The flow file describes all the flow inputs and relates reach boundary conditions needed for the steady flow analyses.
The data required to represent the bridge model are roadway data, piers data and sloping abutment data, these data were measured. For steady flow hydraulic model are flow regime, boundary conditions and peak discharge information are taken from Babylon Water Resources Directorate (BWRD).
From these data, the model is applied using HEC-RAS one dimensional analysis to calculate the maximum scour at bridge piers.
All the input data required to run a bridge HEC-RAS model are presented in the following sections.
VII. THE GEOMETRIC DATA
The first step to develop HEC-RAS model is to create a HEC-RAS geometric file. The basic geometric data consists of establishing how the various river reaches are connected (River System Schematic); cross section data; reach lengths; energy loss coefficients (function losses, contraction and expansion losses); and stream junction information. These data were inputted to the model through the menu of cross section geometrical data as shown in figure (8).
ISSN: 2319-8753
I
nternational
J
ournal of
I
nnovative
R
esearch in
S
cience,
E
ngineering and
T
echnology
(An ISO 3297: 2007 Certified Organization)
Vol. 2, Issue 12, December 2013
ISSN: 2319-8753
I
nternational
J
ournal of
I
nnovative
R
esearch in
S
cience,
E
ngineering and
T
echnology
(An ISO 3297: 2007 Certified Organization)
Vol. 2, Issue 12, December 2013
Fig.9 Input Menu of Bridge Data for Babil Bridge
VIII. THE RIVER SYSTEM SCHEMATIC
The schematic defines how the various river reaches are connected. The model can handle simple single reach modules or complex networks. The river system schematic is developed by drawing and connecting the various reaches of the system within the geometric data editor. This schematic data must be the first input into the HEC-RAS model. For this study, the model of river system schematic is single reach.
A schematic diagram of the river system is drawn as shown in Figure (9). The reach is drawn from upstream to downstream (in the flow direction), because the HEC-RAS model assumes this to be true.
IX.CROSS SECTION GEOMETRY
Boundary geometry for the analysis the flow in river stream is specified in terms of ground surface profiles (cross sections) .The measured distance between any two cross sections is referred to a reach length. Cross sections should be perpendicular to the anticipated flow lines and extend across the entire flood plain (these cross sections may be curved or bent).
ISSN: 2319-8753
I
nternational
J
ournal of
I
nnovative
R
esearch in
S
cience,
E
ngineering and
T
echnology
(An ISO 3297: 2007 Certified Organization)
Vol. 2, Issue 12, December 2013
Fig.10 Some of Cross Sections
X.ENERGY LOSS COEFFICIENTS
Energy losses are represented by channel expansion, contraction and by friction losses. Explaining these losses are in the following sections.
Manning’s Coefficient (n)
The value of n depends on: surface roughness, vegetation, channel irregularities, channel alignment, scour and deposition, obstructions, size and shape of the channel, stage and discharge, seasonal change, temperature, and suspended material and bed load (Chow, 1959; Henderson, 1966). One value of (n) will be selected for all cross sections as shown in figure (10), for the reach in this study Manning’s coefficient was taken 0.032 (Othman, 2006).
Contraction and Expansion Coefficients
ISSN: 2319-8753
I
nternational
J
ournal of
I
nnovative
R
esearch in
S
cience,
E
ngineering and
T
echnology
(An ISO 3297: 2007 Certified Organization)
Vol. 2, Issue 12, December 2013
XI.BRIDGE GEOMETRY
Bridge geometry consists of the necessary data that related to the bridge:
The location of the bridge by entering new river station for the bridge in the reach.
Roadway data that include the distance between the upstream cross section and bridge, the width of bridge in direction of flow and the thickness of bridge is described by entering the stations and elevations of bridge (x-y) data from left to right.
Pier data that include the distance from the left to the centerline of each pier, the width of the pier and the height of the pier represented by elevations.
These data are entered to the model through the menu of bridge data as shown in figure (11).
Fig.11 Bridge Data Menu for Babil Bridge
XII. STEADY FLOW DATA
Steady flow data are required in order to perform a steady water surface profile calculation. Steady flow data contain details on flow regime, boundary conditions and peak discharge information.
Flow regime (subcritical, supercritical or mixed flow regime) is specified on the steady flow analysis window of the user interface as shown in figure (12).
Fig.12 Input Menu of Steady Flow Data
Boundary conditions are necessary to establish the starting water surface at the ends of the river system (upstream and down-stream). A starting water surface is necessary for the program to begin the calculations. For this case, boundary condition in down-stream is the slope of reach for normal depth computation and it equals to (0.00012) (BWRD, 2013). Discharge for the reach that measured by Acoustic Doppler Current Profiler (ADCP) device in (February, 2013) is equal to (70 m3/s).
ISSN: 2319-8753
I
nternational
J
ournal of
I
nnovative
R
esearch in
S
cience,
E
ngineering and
T
echnology
(An ISO 3297: 2007 Certified Organization)
Vol. 2, Issue 12, December 2013
flow data as shown in figure (13).
Fig.13 Input Menu of Steady Flow Data for Babil Bridge
XII. BABIL BRIDGE SCOUR
For Babil Bridge the data that required to be entered are a d50 size fraction for the bed material which is equal to (0.19 mm) from the grain size distribution curve of bed material. The correction factor of pier nose shape (K1) which is equal to (1) for round nose, the correction factor of angle of attack for flow hitting the piers (K2) which is determined by entering the angle of attack, the correction factor of condition of the bed (K3) and a d95 size fraction for the bed material which is equal to (0.29 mm).
To determine whether the flow condition is either clear-water or live-bed, the channel velocity (V1) which equal to (0.68 m/s) as shown in figure (14) is compared to the critical velocity of the d50 size for sediment movement (Vc) by using this formula :
Vc = 6.19 (y1)1/6 (D50)1/3 (2)
The found value for Vc is (0.39 m/s), henceV1>Vc, that means the flow condition is live-bed (Richardson and Davis, 2001; Barbhuiya and Dey, 2004), therefore selected plane bed and anti-dunes in bridge scour window.
The result of scour at piers can be computed from this window which appears at the figure (14), the scour for this case is equal to (1.68 m).
ISSN: 2319-8753
I
nternational
J
ournal of
I
nnovative
R
esearch in
S
cience,
E
ngineering and
T
echnology
(An ISO 3297: 2007 Certified Organization)
Vol. 2, Issue 12, December 2013
Fig.14 Scour at Babil Bridge Window
XIV. CONCLUSIONS
In this research, when the discharge equal to (70 m3/s) the maximum local scour depth that measured was found equal to (1.43m) and the evaluated maximum local scour depth is (1.68m) at Babil Bridge piers by HEC-RAS program. The difference between the computed and measured local scour depth showed that the HEC-RAS model is a good tool for predicting local scour for bridge piers. Hence, it could be used to determine the type of bridge pier foundations before constructing.
The study showed that the piers of Babil Bridge is safe against scouring because the depth of the equilibrium scour is less than the depth of foundation of the bridge. The scouring around the piers should be evaluated from time to time because the local scour could be a major cause of bridge failures which the hydraulic conditions may change.
REFERENCES
[1] Ataie-Ashtiani, B. and Beheshti, A. A., (2006) “Experimental Investigation Of Clear-Water Local Scour At Pile Groups ”, Journal of Hydraulic Engineering, ASCE, October.
[2] Babylon Water Resources Directorate (BWRD) data, 2013.
[3] Barbhuiya, A.K., and Dey, S., (2004), “Local Scour At Abutments: A Review”, Sadhana Vol. 29, Part 5, pp. 449–476. [4] Chow, V.T, (1959), “ Open-Channel Hydraulics ”, McGraw-Hill Book, , New York, USA.
[5]Henderson, F.M., (1966), “ Open Channel Flow ”, Macmillan Publishing company, New York.
[6]Melville, B.W. and Coleman, S.E., (2000) “Bridge Scour. Water Resources Publications”, LLC, Colorado, U.S.A.
[7]Othman, N.Y., (2006) “Hydraulic Control Of Shatt-AL-Hilla Within Hilla City”. M.Sc. thesis, College of Engineering, University of Babylon, Iraq.