University of Windsor University of Windsor
Scholarship at UWindsor
Scholarship at UWindsor
Electronic Theses and Dissertations Theses, Dissertations, and Major Papers
10-19-2015
Experiments with Point Placement Algorithms and Recognition of
Experiments with Point Placement Algorithms and Recognition of
Line Rigid Graphs
Line Rigid Graphs
Pijus Kumar Sarker
University of Windsor
Follow this and additional works at: https://scholar.uwindsor.ca/etd
Recommended Citation Recommended Citation
Sarker, Pijus Kumar, "Experiments with Point Placement Algorithms and Recognition of Line Rigid Graphs" (2015). Electronic Theses and Dissertations. 5450.
https://scholar.uwindsor.ca/etd/5450
and
Recognition of Line Rigid Graphs
By
Pijus Kumar Sarker
A Thesis
Submitted to the Faculty of Graduate Studies
through the School of Computer Science
in Partial Fulfillment of the Requirements for
the Degree of Master of Science at the
University of Windsor
Windsor, Ontario, Canada
2015
c
Experiments with Point Placement Algorithms
and
Recognition of Line Rigid Graphs
by
Pijus Kumar Sarker
APPROVED BY:
Dr. Esaignani Selvarajah Odette School of Business
Dr. Xiaobu Yuan School of Computer Science
ORIGINALITY
I, Pijus Kumar Sarker, declare that I am the sole author of this thesis titled,
’Experiments with Point Placement Algorithms and Recognition of Line Rigid
Graphs’ and that no part of this thesis has been published or submitted for
pub-lication.
I certify that, to the best of my knowledge, my thesis does not infringe upon
anyones copyright nor violate any proprietary rights and that any ideas,
tech-niques, quotations, or any other material from the work of other people included
in my thesis, published or otherwise, are fully acknowledged in accordance with
the standard referencing practices. Furthermore, to the extent that I have
in-cluded copyrighted material that surpasses the bounds of fair dealing within the
meaning of the Canada Copyright Act, I certify that I have obtained a written
permission from the copyright owner(s) to include such material(s) in my thesis
and have included copies of such copyright clearances to my appendix. I declare
that this is a true copy of my thesis, including any final revisions, as approved by
my thesis committee and the Graduate Studies office, and that this thesis has not
ABSTRACT
The point placement problem is to determine the position of n distinct points on a line, up to translation and reflection by fewest possible pairwise adversarial
distance queries. This masters thesis focusses on two aspects of point placement
problem. In one part we focusses on an experimental study of a number of
de-terministic point placement algorithms and an incremental randomized algorithm,
with the goal of obtaining a greater insight into the behavior of these algorithms,
particularly of the randomize algorithm.
The pairwise distance queries in the point placement problem creates a type of
graph, called point placement graph. A point placement graphGis defined as line rigid graph if and only if the vertices of G has unique placement on a line. The other part of this thesis focusses on recognizing line rigid graph of certain class
based on structural property of an arbitrarily given graph. Layer graph drawing
To my loving parents,
ACKNOWLEDGEMENTS
I would like to express the deepest appreciation to my advisorProf. Asish
Mukhopad-hyay. Without his inspiration and supervision this thesis would not have been
possible.
I would like to thank my committee members, Prof. Xiaobu Yuan and Prof.
Esaignani Selvarajah for their, patience, objectivity and observations.
A number of people who motivated me and supported time to time, and credit
goes to:
-Ajay Kumar Sarker for believing on my belief.
-Joiotsna Rani for being my first teacher.
-Mousumi Saha for her continuous support to make me strong and believe on
DECLARATION OF ORIGINALITY iii
ABSTRACT iv
DEDICATION v
ACKNOWLEDGEMENTS vi
LIST OF FIGURES x
LIST OF TABLES xiii
1 Introduction 1
1.1 Introduction . . . 1
1.2 Problem Statement . . . 2
1.2.1 Experimental Study of existing Point Placement Algorithms 2
1.2.2 Recognizing Line Rigid Graphs . . . 3
Table of Contents
1.4 Chapter Outline . . . 4
2 Experimental Study on Point Placement Algorithms 5 2.1 Introduction . . . 5
2.2 Motivation . . . 6
2.3 Overview of contents . . . 7
2.4 Overview of some current point placement algorithms . . . 8
2.4.1 4-cycle algorithm . . . 10
2.4.2 5-cycle algorithm . . . 10
2.4.3 3-path algorithm . . . 11
2.4.4 Randomized algorithm . . . 13
2.5 Experimental Results . . . 14
2.6 Discussion . . . 15
2.6.1 Deterministic versus Randomized . . . 18
3 Recognizing Line Rigid Graphs 19 3.1 Introduction . . . 19
3.2 Motivation . . . 21
3.3 Main Idea . . . 22
3.4 Recognition Scheme . . . 23
3.4.1 Initial Pruning . . . 24
3.4.2 Generate an Planar Embedding . . . 26
3.4.3.2 Choose four corner vertices . . . 39
3.4.3.3 Rectangular Drawing . . . 44
3.4.4 Layer Graph representation of Rectangular Drawing . . . 52
4 Conclusion 57
4.1 Experimental Study on existing Point Placement Algorithm . . . . 57
4.2 Recognizing Line Rigid Graphs . . . 58
Bibliography 59
List of Figures
2.1 Graphs quoted in Theorem 2.1 . . . 8
2.2 Query graph using triangles. . . 9
2.3 Two different placements of a parallelogram p1p2p3p4 . . . 9
2.4 Query graph for first round in a 2-round algorithm using quadrilat-erals. . . 10
2.5 Query graph for the 5-cycle algorithm . . . 11
2.6 Query graph for the 3-path algorithm . . . 11
2.7 A 3-path component . . . 12
2.8 Query Complexity Graph . . . 15
2.9 Time Complexity Graph . . . 15
2.10 A query graph on 3 vertices . . . 17
3.1 Layout of a 4-cycle graph . . . 21
3.2 Line rigid graphs . . . 21
3.3 Difference between layer graph drawing and rectangular drawing . . 23
3.4 (a) Adjacency list of G (b) Embedding of G (c) Appropriate four vertices are chosen as corners (d) Rectangular drawing (e) Layer graph representation . . . 25
3.5 Triangulated graphs . . . 26
3.6 Check 3-cycles in G . . . 26
3.9 Conflicts in DFS tree . . . 30
3.10 DFS tree of a graph . . . 30
3.11 Subgraphs after removing largest cycle from a graph . . . 31
3.12 Embedding of subtrees and combine the embedding to get entire
embedding ofG . . . 31 3.13 (a) Cyclically 4-edge connected graph (b) Not cyclically 4-edge
con-nected (c) Four chains in a graph (d) Subdivision of a graph . . . . 33
3.14 Legged Cycles . . . 34
3.15 (a)A cycle C with four hands (b) Regular-2-handed cycle C and
regular-2-legged cycleC0 . . . 35 3.16 (a) Γ, Embedding of a graph G (b) Add dummy vertex z and
dummy edges (xi, z) and (yi, z) (c) z is embedded on outer face of G+ (d) Removed dummy vertex and dummy edges . . . 37
3.17 (a)-(d) Four embedding created by flipping C1 and C2 around leg
vertices (e) Rectangular drawing obtained from Γ2 . . . 38
3.18 (a) Γ, Embedding of a graph G (b) Rectangular drawing of G (c) Wrong corner vertices . . . 39
3.19 (a) A graph G(b) C0-components of G (c) Four chains in a graph . 40
3.20 (a) Two Independent 2-legged cycles (b) Four Independent 3-legged
cycles . . . 41
3.21 (a) A graph G1 with two chains (b) Rectangular drawing of G1 (c)
A graphG2 with three chain (d) Rectangular drawing of G2 . . . . 42
3.22 (a) A graph with two chains (b) A graph with three chains . . . . 43
3.23 (a) Three independent 3-legged cycles in G (b) Two independent
2-legged cycles inG . . . 43 3.24 (a) Faces of a 3-legged cycle (b) Clockwise critical cycleC attached
LIST OF FIGURES
3.25 (a) Faces of a 3-legged cycle (b) Clockwise critical cycleC attached to pathP . . . 48 3.26 (a)PcandPcc inG(b) Subgraphs ofG(c) Subgraph formed byP
0
cc
(d) Subgraph formed byPc0 . . . 49 3.27 (a) Two alternative embeddings ofCi (b) Embedding of a
partition-pair . . . 50
3.28 (a) Rectangular drawing of a graph G (b)-(c) Two different layout of G, vertices fall on top of each other . . . 52 3.29 Layer graph representation from rectangular drawing of G . . . 54 3.30 Layer graph representation of rectangular drawing of G in Fig. 3.28 54 3.31 Rectangular drawing of a graph . . . 55
2.1 The current state of the art . . . 8
2.2 Performance of 2-round randomized algorithm . . . 16
2.3 Performance of incremental randomized algorithm for nearly
Chapter 1
Introduction
1.1
Introduction
Recently researchers from computer science showed a great interest in biological
problems. Researchers came up with a number of interesting problems from
biol-ogy that can be analyzed or solved theoretically. One of the interesting problem
is DNA mapping problem. In general the goal is the recover the whole DNA
se-quence for an organism. An approach is to use some known substrings which are
called markers orrestriction site. Pairwise distances between the markers can be
measured with flourescent in situ hybridization (FISH) experiment. The problem
is to find relative position of the markers in the DNA sequence. The researchers
reduced the problem to a point placement problem and tried to solve it efficiently
using graph theories and distance geometry approach. In the point placement
problem the markers are represented as points(each of them are distinct) and the
distances between pair of marker represents the distance between pair of points.
The point placement problem is to find unique position of a set of distinct points
on a line with minimum number of distance queries between the points, where
model and inexact model. In exact model distance between all pair of points are
known whereas in inexact model distance between all pair of points are not known
and each distance is bounded by upper bound and lower bound. In the first part
of this thesis we are focussing on the exact model where distance between all pair
of points are known.
The distance queries in the point placement problem createspoint placement
graph(ppg)which is the input to point placement algorithm. In the point placement
graph the each vertex corresponds to point, every edge corresponds to connection
between two points and edge length correspond to the distance between pairs of
points. If the vertices of point placement graph have unique placement on a line
then the graph is called line rigid graph or rigid point placement graph. Thus the
point placement problem reduces to construction of line rigid graph. Researchers
have studied the problem to construct rigid point placement graphs [1], [2], [3], [4].
In this thesis, we have formulated a new problem. The problem is to recognize line
rigid graphs based on structural charactarization. In another part of this thesis,
we focus on the recognition problem.
1.2
Problem Statement
1.2.1
Experimental Study of existing Point Placement
Al-gorithms
The point placement problem is to determine the position ofndistinct points on a line, up to translations and reflections by the fewest possible pairwise (adversarial)
Chapter 1. Introduction 3
of deterministic point placement algorithms and an incremental randomized
al-gorithm, with the goal of obtaining a greater insight into the behavior of these
algorithms, particularly of the randomized one.
1.2.2
Recognizing Line Rigid Graphs
A graph G is line rigid if it has an unique linear layout, up to translation and
re-flection. Every line rigid graph is associated with a functionl that assigns positive
lengths to the edges and an assignment of edge length called valid if the graph
has unique linear layout. The problem is to verify whether an arbitrarily given
graph is line rigid or not. In this thesis we have presented a scheme to recognize
line rigid graphs with some properties. The given graph G must be planer,
2-connected and maximum degree of the vertices are three. A graph is planar if it
can be embedded in the plane so that no two edges intersect geometrically except
at a vertex to which they are both incident. And in 2-connected graphs at least 2
vertices needed to remove to disconnect the graph.
1.3
Contributions
In this thesis we have worked on two aspects of point placement problem. In
first part of this thesis we have done an experimental study of the various point
placement algorithms in order to study the trade-off between query and time
com-plexities. We have specially focus on the randomized point placement algorithm
and compare with other deterministic point placement algorithm.
In the second part we have worked on a new problem, Line Rigid Graph
graph. We have established an connection between line rigidity and graph drawing
and proposed a scheme that recognizes line rigid graphs of a class,2-3 planar graph.
1.4
Chapter Outline
The list bellow presents the organization of the chapters with summary of the
contents.
• Chapter 2 contains a detailed study of existing point placement algorithms
and measure performance of the algorithms by observing the experimental
results.
• Chapter 3 contains a proposed scheme to recognizes line rigid graphs with
some constraints.
Chapter 2
Experimental Study on Point
Placement Algorithms
2.1
Introduction
The point placement problem: Let P = {p1, p2, ..., pn} be a set of n distinct points on a lineL. The point location problem is to determine the locations of the points uniquely (up to translation and reflection) by making the fewest possible
pairwise distance queries of an adversary. The queries can be made in one or
more rounds and are modeled as a graph whose nodes represent the points and
there is an edge connecting two points if the distance between the corresponding
points is being queried. The distances between the pairs of points returned by the
adversary are exact.
A special version of this problem is when a query graph is presented with
as-signed edge lengths and all possible placements of its vertices are to be determined.
A classical version of this problem is the construction of the coordinates of
a set of n points, given exact distances between all pairs of points (see [5], [6]). Algorithms exist that not only determine the coordinates but also the minimum
dimension in which the points can be embedded (see [7]).
2.2
Motivation
The motivation for studying this problem stems from the fact that it arises in
diverse areas of research, to wit computational biology, learning theory,
computa-tional geometry, etc.
In learning theory this problem is one of learning a set of points on a line
non-adaptively, when learning has to proceed based on a fixed set of given distances, or
adaptively when learning proceeds in rounds, with the edges queried in one round
depending on those queried in the previous rounds.
The version of this problem studied in Computational Geometry is known as
the turnpike problem. The description is as follows. On an expressway stretching
from town Ato town B there are several gas exits; the distances between all pairs of exits are known. The problem is to determine the geometric locations of these
exits. This problem was first studied by Skienaet al.[8] who proposed a practical
heuristic for the reconstruction. A polynomial time algorithm was given by Daurat
et al. [9].
In computational biology, it appears in the guise of the restriction site
map-ping problem. Biologists discovered that certain restriction enzymes cleave a DNA
sequence at specific sites known as restriction sites. For example, it was
discov-ered by Smith and Wilcox [10] that the restriction enzyme Hind II cleaves DNA
Chapter 2. Experimental Study on Point Placement Algorithms 7
means of fluorescent in situ hybridization (FISH experiments) biologists are able to
measure the lengths of such cleaved DNA strings. Given the distances (measured
by the number of intervening nucleotides) between all pairs of restriction sites, the
task is to determine the exact locations of the restriction sites. The point
loca-tion problem also has close ties with the probe localoca-tion problem in computaloca-tional
biology (see [11])
The turnpike problem and the restriction mapping problem are identical,
ex-cept for the unit of distance involved; in both of these we seek to fit a set of points
to a given set of inter-point distances. As is well-known, the solution may not be
unique and the running time is polynomial in the number of points. While the
point placement problem, prima facie, bears a resemblance to these two problems
it is different in its formulation - we are allowed to make pairwise distance queries
among a distinct set of labeled points. It turns out that it is possible to determine
a unique placement of the points up to translation and reflection in time that is
linear in the number of points.
2.3
Overview of contents
In the next section we briefly review some of the well-known deterministic
algo-rithms and the only known incremental randomized algorithm. In the following
section we report on the experimental results obtained by careful implementations
of several deterministic algorithms and the incremental randomized algorithm.
This is followed by a detailed discussion of the results and we conclude in the next
2.4
Overview of some current point placement
algorithms
Several algorithms are extant that work in one or more rounds. The current state
of the art is summarized in Table 2.1.
Table 2.1: The current state of the art
Algorithm Rounds Query Complexity Time Complexity Upper Bound Lower Bound
3-cycle 1 2n−3 4n/3 O(n)
4-cycle 2 3n/2 9n/8 O(n)
5-cycle 2 4n/3 +O(√n) 9n/8 O(n) 5:5 jewel 2 10n/7 +O(1) 9n/8 O(n) 6:6 jewel 2 4n/3 +O(1) 9n/8 O(n)
3-path 2 9n/7 9n/8 O(n)
randomized 2 n+O(n/logn) ? O(n2/logn)
Comment: The 9n/8 lower bound on 2-round algorithms was proved in [4], improving the lower bound of 30n/29 by Damaschke [12] and the subsequent im-provement to 17n/16 by [1] and the further improvement to 12n/11 by [3]. As for the lower bound on 1-round algorithms, the following result was proved in [12].
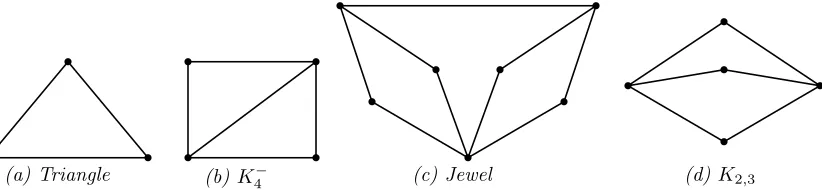
Theorem 2.1. The density of any line rigid graph is 4/3 with the exception of the jewel, K2,3, K3 and K4− (shown in Fig 2.1).
Jewel graph K2,3 graph K4− graph K3 graph
Figure 2.1: Graphs quoted in Theorem 2.1
The density, multiplied byn, gives the lower bound of 4n/3.
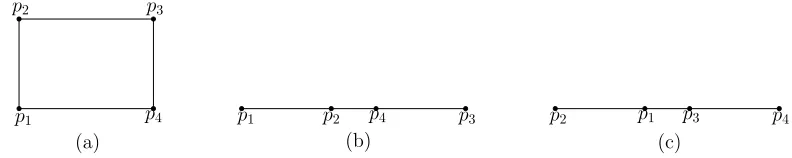
The simplest of all, the 3-cycle 1-round algorithm, has the query graph shown in
Chapter 2. Experimental Study on Point Placement Algorithms 9
p1 p2
p3
p4
pn
Figure 2.2: Query graph using triangles.
The query complexity of this algorithm is 2n−3 self-evident as this is the number of edges in the graph. The 4-cycle 2-round algorithm is typical of the
other 2-round algorithms listed in Table 2.1 and thus merits a brief description.
If G = (V, E) is a query graph, an assignment l of lengths to the edges of
G is said to be valid if there is a placement of the nodes V on a line such that the distances between adjacent nodes are consistent with l. We express this by the notation (G, l). By definition (G, l) is said to be line rigid if there is a unique placement up to translation and reflection, whileGis said to be line rigid if (G, l) is line rigid for every valid l. A 3-cycle (or triangle) graph is line rigid, which is why the 3-cycle algorithm needs only one round to fix the placement of all the
points. A 4-cycle (or quadrilateral) is not line rigid, as there exists an assignment
of lengths that makes it a parallelogram whose vertices have two different
place-ments as in Fig. 2.3.
p1 p2 p4 p3 p2 p1 p3 p4
(a) p1
p2 p3
p4
(b) (c)
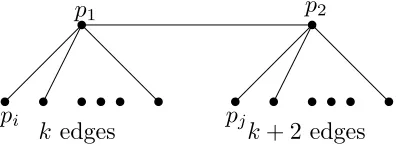
2.4.1
4-cycle algorithm
For this algorithm, the query graph presented to the adversary in the first round
has the structure shown in Fig. 2.4.
p1 p2
k edges k+ 2 edges
pi pj
Figure 2.4: Query graph for first round in a 2-round algorithm using quadri-laterals.
Making use of the following simple but useful observation,
Observation 1. At most two points can be at the same distance from a given
point p on a line L
In the second round we query edges connecting pairs of leaves, one from the group
of sizekand the other from the group of sizek+ 2, making quadrilaterals that are not parallelograms (the rigidity condition |p1pi| 6=|p2pj| ensures that the quadri-lateral p1pipjp2 is not a parallelogram).
2.4.2
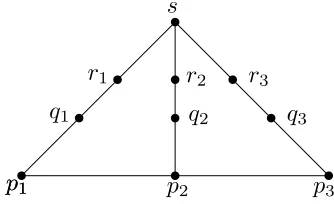
5-cycle algorithm
In the 5-cycle algorithm [1], the query graph submitted to the adversary in the
first round is shown in Fig. 2.5.
Each five cycle is completed by selecting edges to ensure that the following
rigidity conditions are satisfied. For more details on this algorithm see [1].
Chapter 2. Experimental Study on Point Placement Algorithms 11
r
qi
pi
si
tik
Figure 2.5: Query graph for the 5-cycle algorithm
3. |piqi| 6=||rsj| ± |sjtjk|| 4. |sjtjk| 6=|qir|
5. |sjtjk| 6=||piqi| ± |qir||
2.4.3
3-path algorithm
In the 3-path algorithm [13], the query graph submitted to the adversary in the
first round is shown in Fig. 2.6.
Line rigid subgraph of 36 points ofS
...
...
... ...
sl
qil
ril rjl rkl
pi
12b+ 7 3-links
b+ 124 leaves
pj pk
qjl qkl
b+ 124 leaves b+ 124 leaves
... ...
Figure 2.6: Query graph for the 3-path algorithm
In the second round, the algorithm select edges suitably to satisfy the
1. |p1p2|∈ {|/ r1s|,|r2s|,||r1s| ± |r2s||},
2. |p2p3|∈ {|/ r2s|,|r3s|,||r2s| ± |r3s||},
3. |p3p1|∈ {|/ r3s|,|r1s|,||r3s| ± |r1s||},
4. |p1q1|∈ {|/ r1s|,|r2s|,||r1s|±|r2s||,||p1p2|±|r1s||,||p1p2|±|r2s||,||p1p3|±|r1s||,
||p1p3| ± |r3s||, ||p1p2| ± |r1s| ± |r2s||,||p1p3| ± |r1s| ± |r3s||},
5. |p2q2| ∈ {|/ r1s|, |r2s|, |p1q1|, ||r1s| ± |r2s||, ||p1p2| ± |r1s||, ||p1p2| ± |r2s||,
||p2p3| ± |r2s||, ||p2p3| ± |r3s||,||p1q1| ± |r1s||,||p1q1| ± |r2s||,||p1p2| ± |r1s| ±
|r2s||, ||p2p3| ± |r2s| ± |r3s||, ||p1q1| ± |r1s| ± |r2s||, ||p1q1| ± |p1p2| ± |r1s||,
||p1q1| ± |p1p2| ± |r2s||, ||p1q1| ± |p1p2| ± |r1s| ± |r2s||},
6. |p3q3|∈ {|/ r1s|,|r2s|,|r3s|,|p1q1|,|p2q2|,||r2s| ± |r3s||,||r3s| ± |r1s||,||p1p3| ±
|r3s||,||p2p3|±|r3s||,||p1q1|±|r1s||,||p1q1|±|r3s||,||p2q2|±|r2s||,||p2q2|±|r3s||,
||p1p3|±|r1s|±|r3s||,||p2p3|±|r2s|±|r3s||,||p1q1|±|r1s|±|r3s||,||p2q2|±|r2s|±
|r3s||,||p1q1|±|p1p3|±|r3s||,||p2q2|±|p2p3|±|r3s||,||p1q1|±|p1p3|±|r1s|±|r2s||,
||p2q2| ± |p2p3| ± |r2s| ± |r3s||}.
on each 3-path component shown in Fig. 2.7. For more details on this
algo-rithm see [13].
p1
p1 p2 p3
q1 q2 q3
r1 r2 r3
s
Chapter 2. Experimental Study on Point Placement Algorithms 13
2.4.4
Randomized algorithm
Damaschke [14] proposed an incremental randomized algorithm (for an
introduc-tion to randomized algorithms see [15]) that expands a set L of points whose positions have been fixed. The setLis initialized by picking an arbitrary point p0
fromS and setting it as the origin of the line on which the points lie. Relative to
p0 a random path P = p0p1p2... is incrementally constucted by choosing a point
pi at random from the set S−L, and measuring the distance d(pi, pi+1) for each
i = 0,1,2, ... Simultaneously, the algorithm maintains all possible signed sums
±d(p0p1)±d(p1p2)± · · · ±d(pi, pi+1)· · ·, until for some pk+1 the signed sums are
no longer all distinct.
If a signed sum that repeats is the actual distance of pk+1 from p0, then
the placement of pk relative to pk+1 becomes ambiguous. We stop at this point,
query the distance d(p0, pk) and use the signed sum equal to this distance to fix the placements on L of all the points on the path from p1 to pk (in Damaschke’s description the position of pk is fixed relative to two points in L and the signed sum corresponding to this position is chosen to fix the placements of the other
points on the path constructed thus far). Resetting pk as the new p0 and pk+1 as
the new p1, the algorithm repeats until L=S.
Damaschke proved the following result.
Theorem 2.2. The above randomized algorithm for the point location problem
has, for any instance, performance ratio 1 + O(1/ log n) with high probability.
The term performance ratio is the number of distance queries divided by the
points to be placed and submit this query graph to the adversary. As before, we
compute signed sums, stopping when two signed sums are equal when we have
reached the point pk+1 on P. We resolve the ambiguity in the placement of pk+1
by adding edges from pk+1 top0 and p1, whose lengths we will query in the second
round. Continue as in the incremental algorithm from pk+1 on.
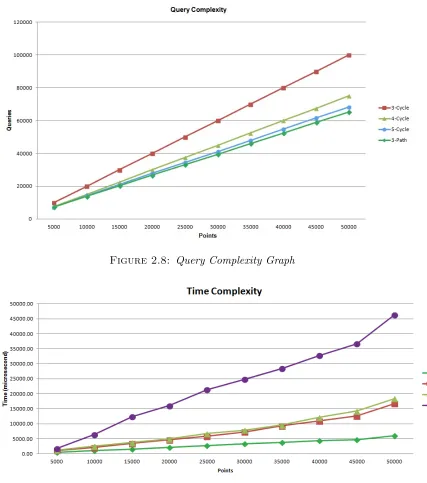
2.5
Experimental Results
We implemented all the four deterministic algorithms and the 2-round version of
the incremental randomized algorithm, discussed in the previous section. The
con-trol parameters used for comparing their performances are: query complexity and
time complexity. The results of the experiments for the deterministic algorithms
are shown in the graphs below. In our experiments, we simulated an adversary
by creating a linear layout and checking the placements of the points by the
algo-rithms against this. This also solved the problem of ensuring a valid assignement
of lengths to the queried edges. We will have more to say about this in the next
section.
Predictably enough, the above chart shows that the behavior of the
algo-rithms with respect to query complexity is consistent with the upper bounds for
these algorithms shown in Table 2.1. Each of these algorithms were run on points
sets of different sizes, up to 50000 points.
Clearly, 3-cycle is consistently the fastest; but despite its complex structure
the 3-path algorithm does well as compared to the 4-cycle and the 5-cycle
algo-rithms. We have not included the performance of the randomized algorithm in
the above graphs as it is incredibly slow and we ran it for point sets of size up to
Chapter 2. Experimental Study on Point Placement Algorithms 15
Figure 2.8: Query Complexity Graph
Figure 2.9: Time Complexity Graph
2.6
Discussion
The behaviour of the deterministic algorithms with respect to time complexity is
opposite to their behaviour with respect to query complexity. The growth-rate of
the running time versus the size of the input point-set is also near-linear. Both
Number of points Number of Distance Queries Running time (hrs:mins:secs)
2000 2382 0:10:41
4000 4712 0:57:32
6000 7048 2:25:38
8000 9348 5:27:53
10000 11668 8:38:34
12000 13999 13:25:24
14000 16282 18:34:58
16000 18625 23:19:40
Table 2.2: Performance of 2-round randomized algorithm
As reported, in none of the deterministic algorithms it was explicitly stated
how to obtain an actual layout from the rigid graph constructed on the input
point set. In our implementations we devised a signed-sum technique to generate
a layout.
The assumption that an assignment of lengths is valid is a strong one and, as
mentioned earlier, we circumvented this problem by creating a layout and reporting
quried lengths based on this. The correctness of the placements of the points by
an algorithm is verified by checking that it generates a layout identical to the one
used to report queried lengths.
An algorithmic approach to the solution of this problem is based on
con-structing the Cayley-Menger matrix out of the squared distances of a query graph.
For a query graph with n vertices, the pre-distance matrix D = [Dij] is a symmetric matrix such that Dij = d2ij, where dij is the distance between the vertices (points)iandj of the query graph. The Cayley-Menger matrix,C = [Cij] is a symmetric (n+1)×(n+1) matrix suchC0i =Ci0 = 1 for 0< i≤n,C[0,0] = 0
and Cij =Dij for 1≤i, j ≤n [16], [5].
The vertices of the query graph has a valid linear placement provided the
Chapter 2. Experimental Study on Point Placement Algorithms 17
exists a d-dimensional embedding of the query graph if the rank of B is at most
d+ 2; our claim follows by setting d= 1) [5].
It’s interesting to check this out for the query graph in Fig. 2.10 on 3 points.
p1
p2
p3
1 2
Figure 2.10: A query graph on 3 vertices
The Cayley-Menger matrix B for the above query graph is:
B =
0 1 1 1
1 0 1 x2
1 1 0 4
1 x2 4 0
,
wherex=d13, the unknown distance bewteen the points p1 and p3.
By the above result, the 4×4 minor, det(B) = 0. This leads to the equation
x4−10x2+ 9 = 0
which has two solutions x = 3 and x = 1, corresponding to the two possible placements (embeddings) of the points p1, p2 andp3. Assumingp2 is placed to the
right of p1, in one of these placements p3 is to the right of bothp1 and p2; in the
2.6.1
Deterministic versus Randomized
Table 2.2 lends credence to the claim by Damaschke [14] that the number of
distance queries of the incremental randomized algorithm is bounded above by
O(n(1 + 1/logn)) in the worst case. Unfortunately, it is too slow to be run with very large inputs.
We suspect that the number of times signed sums become equal is intimately
connected with the distribution of the points that we generate by pretending to be
the adversary. To test this we generated the layout by picking a point at random
in a fixed size interval, and picking the next random point in the same fixed-size
interval whose left end point is the last point selected. In our experiments we
varied this fixed interval from 5 units to 500000 units and reported the number
of times we got equal signed sums for points sets of sizes varying from 20 to
1000. Interestingly enough, as can be seen from Table 2.3 below that the numbers
decrease as the interval-size increases.
Range
# of points 1-5 1-10 1-20 1-50 1-100 1−103 1−104 1−5∗104 1−105 1−5∗105
20 7 7 6 5 4 3 3 2 2 1
50 16 13 11 10 9 7 6 6 5 4
100 25 23 20 19 15 11 9 8 8 7
200 45 39 35 33 29 22 18 17 16 400 78 70 61 56 49 41 39 34
1000 167 149 140 123 111 94 82 76
Table 2.3: Performance of incremental randomized algorithm for nearly uni-form distributions
The incremental randomized algorithm is often held up as an example of
sim-plicity in comparison to deterministic algorithms, like the 3-path one, for example.
The above experiments paint a completely different picture. From a practical point
of view, it is completely ineffective as it is essentially a brute-force algorithm. The
3-path algorithm, on the other hand, scores high on both parameters - low query
Chapter 3
Recognizing Line Rigid Graphs
3.1
Introduction
Graph recognition problem is very old and researchers have studied various graph
recognition problems, like interval graph [17], laman graph ( [18], [19]), clique
graph [20], cographs [21] , circle graphs [22] and many more. But line rigid graph
recognition problem is very new. As far our knowledge no prior work has been
done on this problem.
A graph is called line rigid if all the vertices of the graph has unique position
on a line up to translation and reflection; and distance between any two point
consistent with the graph. Consider a graph G= (V, E) consisting withnvertices and m edges and each edge associated with weights. Now the problem is to assign coordinates to each vertex so that the Euclidean distance between any
two vertices is equal to the weight associated with that edge. This is the graph
realization problem [23]. Thegraph realization problemis about computing relative
Graphs with unique graph realization in one dimension refers to line rigid graphs.
Hendrickson et. al. [23] proposed some conditions for unique graph realization in
any dimension.
Consider a graph G. If G is line rigid then the vertices of G must have unique placement on a line such that the distances between adjacent nodes are
consistent with the corresponding edges of G. The uniqueness of a layout refers to the layouts obtained after translation or reflection is same. According to Chin
et. al. [1], a graph is line rigid if and only if it can’t be drawn as layer graph. In
layer graph representation of a graph G must hold the following conditions,
• all the edges are drawn as horizontal(parallel to x) or vertical(parallel to y) line in xy-plane. i.e. |v1−v2 |= (v1−v2).x or (v1−v2).y
• length of edge |v1v2 |, is same as the weight of the edge.
• there are two verticesv1andv2with differentx-coordinates andy-coordinates.
i.e. (v1−v2).x6=|v1−v2 | and (v1−v2).y 6=|v1−v2 |
• when the angle between x and y tends to 0o or 180o, no vertices will fall on top of another.
A graphG has two layout ifG haslayer graph drawing. Fig. 3.1 shows four layout
of a graph that haslayer graph representation. Considerxy,yz,xw edges are given
for a 4-cycle and zw edge is free. There are four possible placements of node w
and z
1. w can be left of x and right of y
2. w can be right of x and y
Chapter 3. Recognizing Line Rigid Graphs 21
w
x
y z
z
y x
w
y x
z w
y z x w y z w x z y x w
(a)4-Cycle Graph (b)Layer Graph (c)Layout 1
(d)Layout 2 (e)Layout 3 (f)Layout 4
Figure 3.1: Layout of a 4-cycle graph
4. z can be right of y and left ofx
Line rigid graph doesn’t have layer graph representation. Some line rigid graphs
are shown in Fig. 3.2. We can’t draw these graphs as layer graph. Now the line
rigid graph recognition problem is reduced to layer graph drawing problem. In
this chapter our goal is to find out whether a given graph has layer graph drawing
or not. If the graph doesn’t have layer graph drawing, then the graph recognized
as a line rigid graph.
(a) Triangle (b)K4− (c) Jewel (d)K2,3
Figure 3.2: Line rigid graphs
3.2
Motivation
up to translation and reflection with fewest possible pairwise distance queries. The
point placement algorithm creates a point placement graph after making pairwise
distance queries. A point placement graph is line rigid for some valid assignment
of edge lengths. Few interesting question arises from the point placement problem,
1. How to generate arbitrary line rigid graphs ?
2. How to verify line rigid graphs based on the structural property ?
In this thesis we are concentrating on the verification problem.
3.3
Main Idea
Our main idea is based on the layer graph representation of line rigid graph
pre-sented by Chin et. al. [1]. Layer graph drawing of a graph is same as the
rectan-gular grid drawing. In rectanrectan-gular grid drawing the faces of a graph are drawn as
rectangular shape where each vertex is located on a grid point and each edge is
drawn as a horizontal or vertical line segment. There are two difference between
rectangular drawing and layer graph drawing. In rectangular drawing there are no
bends in the inner subgraph but in layer graph bends are allowed. Furthermore in
layer graph no vertices will fall on top of another one when the angle between the
vertical and horizontal edges are 0o or 180o. But there are no such restriction on
rectangular drawing. In Fig. 3.3 shows that difference. Our intension is to find a
rectangular drawing of arbitrary graph and ensure that no vertex will fall on top
of another vertex when the angle between x-coordinate and y-coordinate is 0o or
180o
Our proposed scheme recognizes arbitrary line rigid graphs with some
prop-erty: the graph must be 2-connected, planar and maximum degree of vertices are
Chapter 3. Recognizing Line Rigid Graphs 23
a
b
c
d
e
f
(a) valid layer graph but not rectangular drawing
(b) valid layer graph and rectangular drawing
g
h
i
j k
l
a
b
c
d
e
f
g
h
i
j
k
l
bends
Figure 3.3: Difference between layer graph drawing and rectangular drawing
removing at most one vertex. On the other way we can say that at least two
ver-tices needed to remove to disconnect the graph. At first we will create an planar
embedding of the given graph G. A graph may have exponential number of plane
embedding and all the embeddings may not have rectangular drawing. If any one
of the embedding has a rectangular drawing then we consider G has rectangular
drawing. It is inefficient to check all the embeddings. To solve this issue three more
embeddings are created wisely from the first embedding so that we can decided
whether the graph has rectangular drawing or not by checking these four
embed-ding only. After creating the embedembed-dings four vertices are chosen appropriately
from the outer face of an embedding. These four vertices represents four corner of
a rectangle and all other edges and vertices are either on the boundary or inside of
the rectangle. Then the subgraph inside the rectangle drawn as rectangles faces.
3.4
Recognition Scheme
We consider the arbitrary graph G is 2-connected, planar and maximum degree
of any vertex is three. The adjacency list of G is known. Now we will propose a
Phase 2: Generate a planar Embedding( Γ) of G
Phase 3: Rectangular Drawing of Γ
Phase 4: Layer Graph representation of Rectangular Drawing
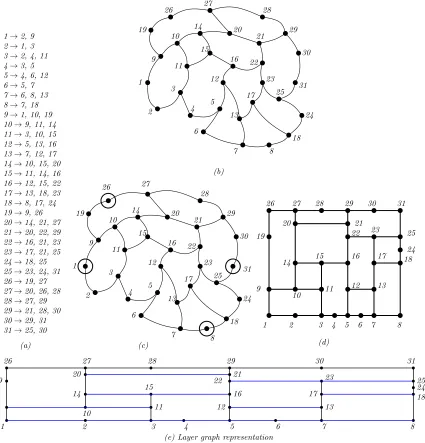
The overview of the whole process is visualized in Fig. 3.4. Initially the
adjacency list of a graph Gwith 31 vertices is given as shown in Fig. 3.4(a). After that we create an planar embedding Γ of G shown in Fig. 3.4(b). There can be many embeddings of G. So we create four possible embeddings wisely based on some structural characterization of Γ. Then we pick each embeddings one by
one and try to obtain rectangular drawing. To obtain rectangular drawing we
need to chose four vertices in the outer face of Γ as shown in Fig. 3.4(c). These
four vertices will be the corners of rectangle. Considering those four vertices as
four corners of a rectangle we obtain the rectangular drawing of inner subgraph
as shown in Fig. 3.4(d). After obtaining the rectangular drawing we adjust the
horizontal edges to ensure that no vertices will fall on top of each other when the
angle between horizontal lines and vertical lines are 0o or 180o. Now the modified
rectangular drawing satisfies all the characteristics of layer graph drawing. The
layer graph drawing of G is shown in Fig. 3.4(e).
3.4.1
Initial Pruning
In this phase we will check some structural property for which there no layer graph
drawing is possible. The graph has to be connected. Triangulated graphs can’t be
drawn as a layer graph as they are line rigid. So if the given graph is triangulated
then we can say that the graph G is line rigid. Some triangulated graphs are shown in Fig. 3.5.
Triangles are intrinsically line rigid and layer graph drawing is not possible.
Chapter 3. Recognizing Line Rigid Graphs 25
1→2, 9 2→1, 3 3→2, 4, 11 4→3, 5 5→4, 6, 12 6→5, 7 7→6, 8, 13 8→7, 18 9→1, 10, 19 10→9, 11, 14 11→3, 10, 15 12→5, 13, 16 13→7, 12, 17 14→10, 15, 20 15→11, 14, 16 16→12, 15, 22 17→13, 18, 23 18→8, 17, 24 19→9, 26 20→14, 21, 27 21→20, 22, 29 22→16, 21, 23 23→17, 21, 25 24→18, 25 25→23, 24, 31 26→19, 27 27→20, 26, 28 28→27, 29 29→21, 28, 30 30→29, 31 31→25, 30
(a)
19
9
26 27 28
29 21 20 14 10 1 2 3 11 15 16 22 23 25 31 30 4 5 12 13 17 6 7 8 18 24
1 2 3 4 5 6 7 8 9
10 11
12 13 14 15 16 17 18 19
20 21
22 23
24 25 26 27 28 29 30 31 (b) (d) 19 9 26 27 28 29 21 20 14 10 1 2 3 11 15 16 22 23 25 31 30 4 5 12 13 17 6 7 8 18 24 (c)
1 2 3 4 5 6 7 8
9 10 11 12 13
14 15 16 17 18
19 20 22 21 23
24 25
26 27 28 29 30 31
(e) Layer graph representation
Figure 3.4: (a) Adjacency list of G (b) Embedding of G (c) Appropriate four vertices are chosen as corners (d) Rectangular drawing (e) Layer graph
representation
Depth-first search can be used to check for any cycle with length three. The back
edges in the depth-first search represent cycle. Our intension of check cycles with
length three. For each back edge we will look for common adjacent vertex from
the vertices of the back edge. A common vertex from end vertices of a back edge
represents a cycle with length three. There can be more than one common vertex
Figure 3.5: Triangulated graphs
vertex of a back edge ensures existence of K4−. Fig. 3.6 shows clear representa-tion of the process. Fig 3.6 (a) shows the adjacency list of the given graph, (b)
a b c f d e
BE3
BE1
BE2
(a) Adjacency List of G (b) Depth-first Search
a
c
f d
e
(c) Graph G b
a→b, d, e b→a, c, d c→b, d, f d→a, b, c, e, f e→a, d, f f→c, d, e
BE4
BE5
Figure 3.6: Check 3-cycles inG
represents an random Depth-First search tree where the bold edges with arrow
are back edges. There are five back edges BE1, BE2, BE3, BE4 and BE5. The
end vertices f and e of back edge BE1 has a common vertex d. Hence there is
3-cycle, def associated with BE1. The same way back edge BE2 is associated
with 3-cycles, ade. Here all the back edges associated with at least one 3-cycle which shows that all the faces ofGare triangular. HenceGis a triangulated graph.
3.4.2
Generate an Planar Embedding
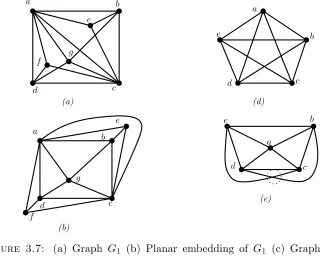
An embedding of a graph Gon a surface is a representation ofGwhere the points are associated to vertices and arcs are associated to edges. An embedding is
planar if no two arcs intersect geometrically. GraphG1 in Fig. 3.7(a) has a planar
Chapter 3. Recognizing Line Rigid Graphs 27
In this phase we will create an planer embedding of an arbitrary graph G
using the algorithms given by Hopcroft et. al. [24] and Mehlhorn et. al. [25].
Hopcroft presented a efficient algorithm to testing planarity of an given graph and
also provided idea to create an embedding if exists. Later in 1996 K. Mehlorn and
P. Mutzel provided a detailed description of the embedding phase of Hopcroft and
Tarjan planarity testing algorithm. Hopcroft used the original idea provided by
Bergs et. al. [26] and Auslander et. al. [27]. Bergs provided a characterization of
planar graph: a graph is planar if and only if all of its biconnected components are
planar. Auslander and Parter has given a idea of planar graph embedding. First,
find a cycle in a graph. After removing the cycle the graph falls into several pieces.
Then an algorithm will recursively embed each piece in the plane with the original
cycle. Lastly all the embeddings of the pieces are merged. If merging is possible
then the embedding of the graph is found otherwise embedding is not possible.
a
b
c d
e
a
e b
d c
a b
c d
e
f g
a
b e
c g
f d
(a)
(b)
(d)
(e)
Figure 3.7: (a) Graph G1 (b) Planar embedding of G1 (c) Graph G2 (d)
Planar embedding is not possible for G2
planar graph must be≤3|V|−3. If there are more edges inGthen we decide that
Gis nonplanar. In the next step, Gwill be divided into biconnected components. Then test planarity of each biconnected components and embed them.
A graph G = (V, E) with a set of finite number of vertices V and a set of finite number of edges E. A graph G = (V1, E1) is a subgraph of G = (V2, E2) if
V1 ⊆V2 andE1 ⊆E2. There is a path from vertexvitovj if there exists a sequence of vertices vx,i≤x≤j, and edges ey, i≤y≤j, such thatei = (vi, vi+1). A path
from a vertex to itself is a closed path. A closed path from vertex vi to vi with one or more edges is a cycle if all of its edges are distinct and only the vertex vi repeated twice.
The edges of depth-first tree are classified into four types: tree edge, back
edge, forward edge and cross edge. During a DFS execution, the classification of
edge (u, v), the edge from vertexuto vertexv, depends on whether we have visited
v before in the DFS and if so, the relationship between u and v.
1. If v is visited for the first time as we traverse the edge (u, v), then the edge is a tree edge.
2. Else, v has already been visited:
(a) Ifv is an ancestor of u, then edge (u, v) is a back edge.
(b) Else, if v is a descendant of u, then edge (u, v) is a forward edge.
(c) Else, if v is neither an ancestor or descendant of u, then edge (u, v) is a cross edge.
Chapter 3. Recognizing Line Rigid Graphs 29
a
b
c d e f g
h
Figure 3.8: Edges of a DFS tree
edges and back edges. Here we define back edge as an edge going from currently
visited vertex to any previously visited vertex.
A cycle in DF S tree consists of tree path and back edge. Tree path is a path between two vertices that uses tree edges only. Some cycle will consist of
simple path of edges not in previously found cycles, plus a simple path edges in
old cycles. Now consider the first cycle c. It will consist of a sequence of tree edges followed by one back edge in path P. The numbering of vertices along the cycle are ordered. Each piece not part of a cycle will consists either of a single
back edge (v, w) or of a tree edge (v, w) plus a subtree with root w, plus all back edges which lead from the subtree. Then each piece will be processed and add
them to a planar representation in decreasing order ofv. Each piece can be either
inside or outside of cycle c. We continue to add new pieces and move old pieces if necessary until either a piece cannot be added or the entire graph is
embed-ded in the plane. Fig. 3.9 shows the conflict between piece S2, S3 and S4. Two
ways to resolve the conflict between S2 and S3: (1) we can move S2 outside c(2)
or we can move S3 outside c. And two ways to resolve conflict between S3 and
S4: (1) move S4 outside c(2) move S3 outside c. In both case moving S3 outside
cresolve the conflicts. Fig. 3.9(b) shows the embedding after removing the conflict.
At first a depth-first tree will be generated. Depth-first tree can be achieve
by traversing the graph using depth-first tree traversal algorithm. A sequence of
c
s
1s
2s
3s
4c
s
1s
2s
3s
4 (a) (b)Figure 3.9: Conflicts in DFS tree
list of a graph G, Fig. 3.10 (b) represents the DFS tree. In the DFS tree the
back edges are F1, F2, F3, F4, F5, F6, F7 and F8 and the tree edges are in bold.
Fig. 3.10(c) represents the vertex numbering in theDFS tree.
a →b, d b →a, c, h c →b, m d →a, e, n e →d, f, o f →e, g, i g →f, h, j h →b, g, l i →f, p, j j →g, i, k k →j, l, q l →h, k, m m →c, l, r n →d, o o →e, n, p p →o, i, q q →p, k, r r →q, m
(a) Adjacency list of G
a d e f g h l k j i p o
n q r
m c b 0 1 2 3 4 5 6 7 8 9 10 11 12 13 14
15 16
17 F1 F2
F3 F4 F5 F6 F7 F8
(b) DFS Tree of G (c) Vertex numbering in DFS Tree
Figure 3.10: DFS tree of a graph
Now the largest cycle is choosen and remove from theDFS tree. In Fig. 3.11(a)
shows the largest cycle in bold lines. After removing the cycle divides the DFS
tree in two subtrees, T1 and T2, shown in Fig. 3.11(b) and Fig. 3.11(c). For each
subtree we will follow the same process: choose the largest cycle, remove it and
embed the pieces or subtrees. In subtree T1 there are two pieces s1 and s2 and in
Chapter 3. Recognizing Line Rigid Graphs 31 0 1 2 3 4 5 6 7 8 9 10 11
12 13 14 15 16 17 2 3 4 5 6 7 8 9 10 11 12 3 4 5 6 7 8 9 10 13 14 15 16 17
(a) Largest cycle is chosen (b) Subtree T1 (b) Subtree T2
1
s1
s2 s3
s4
s5
s6 s7
Figure 3.11: Subgraphs after removing largest cycle from a graph
In subtree T1 there is no conflict between the pieces. But in T2 there are
conflict between s3, s4 and s5, s6, s7. Fig. 3.12 (a) and (b) shows the embedding
of the subtrees and Fig. 3.12(c) is obtained by combining the embedding of each
subtree to the largest cycle.
0 1 2 3 4 5 6 7 8 9 10 11
12 13 14 15 16 17 2 3 4 5 6 7 8 9 10 11 12 3 4 5 6 7 8 9 10 13 14 15 16 17 1 s3 s4 s5 s6
s7 s7 s6
s5 s4
s3 s2 s1
(c) Combined the embedding of T1 and T2
(b) Embedding of T2
(a) Embedding of T1 s1
s2
3.4.3
Rectangular Drawing of an Embedding
In this phase we will generate rectangular drawing of Gfrom an embedding using the algorithm given by M.S Rahman et. al. [28]. Before starting the drawing
algorithm we will go through two preprocessing steps: (a) analyze embedding[29]
and (b) choose four corner vertices[30]. After these two steps we will engage the
drawing algorithm with a fixed embedding and four corner vertices in the outer
face of the embedding.
3.4.3.1 Analyze Embedding
First we will define few structural property of a graph which are necessary to
understand this phase. Suppose we have given a graph, G(V, E) where V is the set of vertices and E is the set of edges. The degree of a vertex, v is represented as d(v). In a cubic graph all the vertices are degree three vertices. A graph G
is k-connected if deletion of at least k vertices makes the graph disconnected. In a 2-connected graph a pair of vertices can disconnect a graph and such pair of
vertices called separation pair in G. There is no separation pair in 3-connected
graph.
Consider a path,P =v0, v1, v2, . . . vk+1, k ≥1, in G. InP, d(v0)≥3,
d(v2) =d(v3) =. . . =d(vk) = 2, d(vk+1) ≥ 3. The subpath P0 = v1, v2, . . . .
. vk is called a chain of G and the vertices v0 and vk+1 are the supports of the
chain P0. The graph shown in Fig 3.13(c) has four chains: P
1, P2,P3 and P4.
Subdividing an edge is to add one or more vertices of degree two between the
end vertices the edge and remove the old edge. Subdivision of a graph is shown in
Chapter 3. Recognizing Line Rigid Graphs 33
0≤i≤k. A graph is calledcyclically 4-edge-connected if the removal of any three or fewer edges leaves a graph such that exactly one of the connected components
has a cycle. Fig. 3.13(a) is cyclically 4-edge connected but not Fig. 3.13(b).
C00 C
F1
F2 F3
(a) (b)
C0
P1
P2
P3 P4
(c) (d)
Figure 3.13: (a) Cyclically 4-edge connected graph (b) Not cyclically 4-edge connected (c) Four chains in a graph (d) Subdivision of a graph
Consider a planar biconnected graph G and Γ is the embedding of G. The contour of a face in Γ is a cycle of G and called a f ace. The outer f ace of Γ is represented by F0(Γ). Let C be a cycle in Γ. The plane subgraph of Γ inside C
(including C) is denoted by inner subgraph ΓI(C) for C and the plane subgraph of Γ outside C(including C) is denoted by outer subgraph ΓO(C) for C. An edge connects to exactly one vertex of a cycle C and other end of the edge located outside C is called a leg of C. The vertex of C to which a leg is connected is called leg-vertex of C. A cycle C is called k-legged cycle of Γ if C has exactly k
(a) 1-legged cycle (b) 2-legged cycle (c) 3-legged cycle (d) 4-legged cycle
Figure 3.14: Legged Cycles
A face F of Γ is called peripheral face for a 3-legged cycle C in Γ if F is in ΓO(C) and the contour of F contains an edge on C. In any embedding Γ for any 3-legged cycle will have three peripheral faces. In Fig. 3.13(b) there are three
peripheral faces for a3-legged cycle drawn in thick solid lines. Ak-legged cycleCis called a minimal k-legged cycle if GI(C) does not contain any other k-legged cycle of G. Cycle C in Fig. 3.13(b) is not minimal 3-legged cycle. But C00 is minimal 3-legged cycle. Consider two cyclesCand C0 in Γ are called independent if there is no common vertex among theirInner subgraphs. A cycleC in Γ is calledregular if the plane graph Γ−ΓI(C) has a cycle. In the plane graph depicted in Fig. 3.13(b), the cycleC drawn by thick solid lines is aregular 3-legged cycle, while the cycleC0 indicated by thin dotted lines is not a regular 3-legged cycle. The 2-legged cycle
represented by a thin dotted line in Fig. 3.13(a) is not regular. A2-legged cycleC
in Γ is not regular if and only if Γ−ΓI(C) is a chain of Gand a 3-legged cycleC is not regular if and only if Γ−ΓI(C) contains exactly one vertex that has degree 3 in G.
An edgeeu,v of an embedding Γ which connects to exactly one vertex in the contour of a cycle C in Γ and located inside C is called an hand of C and the vertex of C to which hand connects is called hand-vertex of C. In Fig 3.15(a) cycle C represented in thick solid line has four hands, h1, h2, h3 and h4 and the
hand vertices are vh1, vh2, vh3 and vh4.
In a 2-handed cycle C there will be exactly two hands in Γ and there will be no edge which joins two vertices on C and located inside C. A 2-handed cycle
Chapter 3. Recognizing Line Rigid Graphs 35
h1
h2
h3
h4
C2 C1
vh1
vh2
vh3
vh4
C
(a) (b)
h1
h2
C0
vh1
vh2
C
Figure 3.15: (a)A cycleC with fourhands(b)Regular-2-handed cycleC and
regular-2-legged cycleC0
cycle is associated with a 2-legged cycle. In Fig. 3.15(b) cycle C drawn by thick solid line is a 2-handed cycle and there is a 2-legged cycleC0 inside C.
So far we have discussed about all the necessary terms which will be used
to analyze the given embedding. The goal to analyze the embedding to show its
structural property for which there is no rectangular drawing is possible and if we
don’t find those property then we will move to next preprocessing phase.
According to T. Nishizeki et. al. [31] if G is a subdivision of a 3-connected planar graph then their is exactly one embedding of G for each face embedded as the outer face. He also mentioned that for any two plane embedding of a
graph, any face cycle in one embedding will also represent a face cycle in another
embedding. Then multiple embeddings of Gare possible by choosing each face as outer face. M.S Rahman [29] provided following necessary and sufficient condition
for a graph to have a rectangular drawing.
face F such that
(a) F contains at least four vertices of degree 2. (b) there are at least two chains on F, and
(c) if there are exactly two chains on F, then they are not adjacent and each of them contains at least two vertices.
2. Let, G is not cyclically 4-edge connected. Then the embedding Γ of G has a regular 3-legged cycle C. Let F1, F2 and F3 are three peripheral faces for C,
and let Γ1, Γ2, and Γ3 be the plane embeddings of G taking F1, F2, and F3,
respectively, as the outer face. Then the planar graph G has a rectangular drawing if and only if at least one of the three embeddings Γ1, Γ2, and Γ3
has a rectangular drawing.
Algorithm: Theorem 3.1 leads to an algorithm to determine if an
embed-ding of a graph has a rectangular drawing. We will start with determining whether
the given graph G is a subdivision of a planar 3-connected cubic graph. Given a graphGand one of its arbitrary embedding Γ. First we will find a regular2-legged
cycle in Γ. If there is no regular 2-legged cycle in Γ then G is a subdivision of a planar 3-connected cubic graph. Then we call another subroutine subdivision
drawing to check existence of rectangular drawing ofGand if rectangular drawing exists, then we move to next preprocessing phase, choose four corner vertices.
Subdivision drawing: Let Γ be any embedding on a graph G. First, we will check if there is any regular 3-legged cycle in Γ. If Γ contains a regular 3-legged
Chapter 3. Recognizing Line Rigid Graphs 37
face F then create another embedding Γ0 of G whose outer face is F. Then we move to next preprocessing phase choose four corner vertices with graph G and the embedding Γ. Now consider that G is not cyclically 4-edge-connected and Γ has a regular 3-legged cycle, C. Next find three peripheral faces F1, F2 and F3 of
C. For each perifheral face create a new embedding of G where the face is the outer face inG. Lets Γ1, Γ2 and Γ3 are three new embeddings. Then for each new
embedding we go throught next preprocessing phase,choose four corner vertices.
If none of the embeddings pass through next phase then we conclude that G has no rectangular drawing.
C1 C2 x1 y1 x2 y2 x3 y3 x4 y4 C1 C2 x1 y1 x2 y2 x3 y3 x4 y4 C1 C2 x1 y1 x2 y2 x3 y3 x4 y4 C1 C2 x1 y1 x2 y2 x3 y3 x4 y4 (a) An embedding,Γ of G
(b) G+
(c)Γ+
(d)Γ∗
z
z
Figure 3.16: (a) Γ, Embedding of a graph G (b) Add dummy vertex z and dummy edges (xi, z) and (yi, z) (c) z is embedded on outer face of G+ (d)
Removed dummy vertex and dummy edges
vertexzand dummy edges (xi, z) and (yi, z); 1≤i≤l. Then we will test planarity of the of G+. If G+ is not planar, then we conclude that G has no rectangular
drawing. Otherwise find an embedding Γ+ of G+ such that z is embedded on the
outer face. Create new embedding Γ∗ by deleting the dummy vertexzand dummy edges (xi, z) and (yi, z). If there are three or more independent 2-legged cycles in Γ∗ then we conclude thatG has no rectangular drawing. Otherwise consider that Γ∗ has two minimal regular 2-legged cycles, C
1 and C2. Then create four plane
embeddings Γ1, Γ2, Γ3 and Γ4 from Γ∗ by flipping Γ∗I(C1) and Γ∗I(C2) around the
leg-vertices. Now for each embedding we move to next preprocessing step, choose
four corner vertices. If none of the embedding passes through the preprocessing
step then we conclude that G has no rectangular drawing.
C1 C2 x1 y1 x2 y2 x3 y3 x4 y4
(a)Γ1
C1 C2 x1 y1 x2 y2 x3 y3 x4 y4
(b)Γ2
C1 C2 x1 y1 x2 y2 x3 y3 x4 y4
(c)Γ3
C1 x1 y1 x3 y3 x4 y4
(d)Γ4
C2
x2
y2
y1
x1 x3 x
4 x2
y2 y4 y3
Rectangular drawing from (b)
Figure 3.17: (a)-(d) Four embedding created by flipping C1 and C2 around
Chapter 3. Recognizing Line Rigid Graphs 39
3.4.3.2 Choose four corner vertices
In this preprocessing phase we will use the algorithm given by M.S Rahman et.
al.[30] to find appropriate corner vertex. The algorithm works on a special kind
of graph called 2-3 plane graph. A 2-3 plane graph is a plane graph and each
vertex has degree 3 except the vertices on outer face which have degree 2 or 3.
The idea behind choosing four corner vertex prior to drawing is to check if we
can draw the outer face of a graph as a rectangle. It is important to choose right
vertices as corners otherwise it is not possible to draw G in rectangular shape.
In Fig 3.18(b) corner vertices are chosen correctly but in Fig 3.18(c) the corner
vertices are inappropriate and rectangular drawing is not possible.
a b c d e f g h i j k l m
a b d
c
e m
h i l
k f
g j
a b d
i e h c g f l m k j
(a) (b) (c)
Figure 3.18: (a) Γ, Embedding of a graph G (b) Rectangular drawing of G (c) Wrong corner vertices
A contour of a face F is defined by taking a clockwise cycle formed by the edges on the boundary of the face. The contour of the outer face of a graph
G by C0(G). Any vertex which is not on C0(G) is called inner vertex of G. In
Fig 3.18(a)C0(G) is drawn as thick solid line and theinner vertices aref,g andj.
In a rectangular drawing of a graphG, each faces are represented as a rectangular shape. The contour C0(G) of the outer face of G should be rectangular and has
four convex corners. But there will be no convex corners or bend in the inner
removingC0(G). Alternatively we can say that ifHis a singleC0−componentof a
graphG, thenG=H∪C0(G). The graphGin Fig 3.19 has fourC0−components:
F1, F2,F3 and F4.
F1 F2 F3
F4
(a) (b)
P1
P2
P3 P4
(c)
Figure 3.19: (a) A graphG(b)C0-componentsofG(c) Four chains in a graph
Theorem 3.2 (M.S Rahman et. al. [30]). A 2-3 plane graph has a rectangular
drawing if and only if it satisfies the following conditions
(a) G has no 1-legged cycle
(b) Every 2-legged cycle in G contain at least two degree 2 vertex. (c) Every 3-legged cycle in G contain at least one degree 2 vertex.
(d) If Gcontains c2 independent 2-legged cycle andc3 independent 3-legged
cycle then, 2c2+c3 ≤4.
From Theorem 3.2 (d) it is visible that if a graphGhas a rectangular draw-ing then G can have at most two independent 2-legged cycles and at most four independent 3-legged cycles. Fig. 3.20 shows maximum number of independent
Chapter 3. Recognizing Line Rigid Graphs 41
C1 C2
C3
C4
C1 C2
(a) (b)
Figure 3.20: (a) Two Independent 2-legged cycles (b) Four Independent 3-legged cycles
Algorithm: Consider that a graphGsatisfies the conditions in Theorem 4. This algorithm will help us to choose corner vertices appropriately. The graph G
and one of its embedding Γ is known a priori. Four corner vertices will be chosen
based on the structural property of G and its embedding.
Case 1: ConsiderGcontains at most three degree 3 vertices onC0(G). First
consider that there are only two degree 3 vertex on C0(G). G will have only one
C0-component. These two degree 3 vertex along with degree two vertices inC0(G)
create two chains. Furthermore, there are two 2-legged cycles C1 and C2 inG. In
Fig 3.21 (a) the cycles are shown as dotted lines. Since Gsatisfies condition (b) is Theorem 3.2, each2-legged cycle must contain at least two degree 2 vertices. Then
we can chose any two degree 2 vertices from the chains of each cycle as corners.
Fig 3.21 (a) and (b) shows the process to chose four corner vertices if G contains only two degree 3 vertices. Furthermore, G will have exactly one C0-component
if there are exactly three degree 3 vertices in C0(G). The C0-component has no
cycles andG has three 3-legged cycles C1, C2 and C3 identified by dotted lines in
Fig 3.21(c). There are three chains associated with three 3-legged cycles. Since
G satisfies condition (c) in Theorem 3.2, each 3-legged cycle contains at least one degree 2 vertex. Then we select one degree 2 vertex from chains of each 3-legged
cycles and the remaining one can be chosen arbitrarily.
Subcase 1: Gwill have exactly oneC0(G)-component ifGdoes not contain
pair of independent2-legged cycles. IfGhas no pair of independent3-legged cycles the we can choose four vertices of degree 2 as corners in a way that each chain
con-tains at most two vertices of degree 2 and each pair of consecutive chains concon-tains
at most three. In Fig 3.22(a) show that four corners are chosen from two
non-consecutive chains indicated with dotted regions and the graph in in Fig 3.22(b)
contains three chain chains.
a
b
c
d
C1
C2
a
b
d c
a
b
c d
a b
c d
(a) (b)
(c) (d)
C1
C2
C3
Figure 3.21: (a) A graph G1 with two chains (b) Rectangular drawing ofG1
(c) A graph G2 with three chain (d) Rectangular drawing of G2
IfG contains a pair of independent 3-legged cycles thenG has at most four independent 3-legged cycles. In this case first we need to find all independent
minimal 3-legged cycles in G. Lets say there are k independent 3-legged cycles in
G. Eachminimal 3-legged cycle contains at least one vertex of degree 2 on C0(G).
Then we arbitrarily choose a vertex of degree 2 from eachminimal 3-legged cycles.
Chapter 3. Recognizing Line Rigid Graphs 43
a b
c d
a b
c d
(a) (b)
Figure 3.22: (a) A graph with two chains (b) A graph with three chains
vertices of degree 2 onC0(G) which are not chosen so far in a way that each chain
contains at most two of the four chosen vertices. In Fig 3.23(b) four degree 2
vertices a, b, c and d are chosen as designated corners where vertices a, b and c
are chosen from three independent minimal 3-legged cycles and vertexd is chosen arbitrarily from rest of degree 2 vertices on C0(G).
a
b
d c
C
1 aC
2b
c
d
(a) (b)
Figure 3.23: (a) Three independent3-legged cycles inG(b) Two independent
2-legged cycles inG
Subcase 2: Consider G has two or more C0(G)-components.Then G has a
pair of independent 2-legged cycles. Let C1 and C2 be two independent minimal
2-legged cycles. We can assume that both C1 and C2 are minimal 2-legged cycles.
vertices of degree 2 on V(Ci) which are not chosen so far. In Fig 3.23(b) C1 and
C2 are two independent 2-legged cycles. Cycle C1 has two independent minimal
3-legged cycles and C2 has one independent minimal 3-legged cycle. Among four
corner vertices a, b, c and d; vertices a and b are chosen from two independent
3-legged cycles inC1; and vertex cis chosen from one independent 3-legged cycle,
and vertex d is chosen arbitrarily from the remaining vertices of degree 2 in C2.
3.4.3.3 Rectangular Drawing
In this section we will obtain rectangular drawing of a given graphG. We will use the rectangular grid drawing algorithm of Md. Rahman et. al.[28] to achieve the
rectangular drawing. So far we have an embedding Γ of G and appropriate four corner vertices a, b, cand d. So we can easily draw the outer face as rectangle by joining the four corner vertices. Now we will discuss on drawing all the inner faces
as rectangle.
A plane graph divides the plane into connected regions called faces. The
contour of a face is a clockwise cycle formed by the edges on the boundary of the
face. In a graph Gthe contour of the outer face of G is denoted byC0(G) or C0.
Theorem 3.3 (Md. Rahman et. al. [28]). G has no rectangular drawing if
(a) the C0-component has a cycle with less than four legs.
(b) Ghas a critical cycleC attached to pathPN, PE, PS or PW, except the outer cycle C0.
(c) Ghas a cycle withncc(C)=0 attached to pathP =PN+PE, PE+PS, PS+PW or PW +PN, except the outer cycle C0