ABSTRACT
MATALENAS, LAURA ANN. Examining Spatial Visualization Feedback Timing during Food Estimation. (Under the direction of Dr. Anne Collins McLaughlin).
The goal for this research was to determine the user needs for feedback timing for an Augmented Reality (AR) food estimation training technology for people with diabetes. For people with diabetes, food portion estimation can be a struggle. AR can provide benefits for training and improving the cognitive skills required for estimation. To provide appropriate AR training, it is important to examine feedback delay as it is crucial for enhancing skill acquisition. This experiment manipulated feedback delay to assess performance and learning in a food estimation task. Feedback was either immediate (real-time during practice), shortly delayed (immediately after practice), or longer delayed (10 seconds after practice).
by
Laura Ann Matalenas
A thesis submitted to the Graduate Faculty of North Carolina State University
in partial fulfillment of the requirements for the degree of
Master of Science
Psychology
Raleigh, North Carolina 2017
APPROVED BY:
_______________________________ _______________________________
Christopher B. Mayhorn Jing Feng
_______________________________ Anne Collins McLaughlin
BIOGRAPHY
TABLE OF CONTENTS
LIST OF TABLES ... vi
LIST OF FIGURES ... vii
Examining Spatial Visualization Feedback Timing during Food Estimation ... 1
Introduction ... 1
Feedback... 2
Feedback and transfer. ... 4
Application Domain ... 6
Preliminary Studies ... 7
Method ... 12
Participants ... 12
Materials ... 13
Ability tests and questionnaires ... 15
NASA-TLX ... 15
Paper folding... 15
Cube comparison ... 15
Task Specific Self-Efficacy Scale ... 16
Conservation Test ... 16
Procedure ... 21
Results ... 22
AR Feedback ... 22
Test Level Analysis ... 22
Trial Level Analysis ... 26
Practice Analysis ... 27
Behavioral Observations ... 29
Open-ended Responses and Strategies ... 29
Liquid Estimation ... 30
Spatial Ability Tests ... 32
AR Estimation Task... 32
Liquid Estimation Task ... 32
Self-efficacy and AR Estimation... 34
NASA-TLX and AR Estimation ... 34
Discussion ... 35
Limitations ... 37
References ... 39
Appendices ... 45
LIST OF TABLES
Table 1. Demographic information about participants. ... 13
Table 2. Mixed-design MANOVA results for “the average of the amounts they practiced.” 23 Table 3. Mixed-design MANOVA results for “one of the amounts they practiced” ... 23
Table 4. Mixed-design MANOVA results for near transfer ... 23
Table 5. Mixed-design MANOVA results for far transfer ... 24
Table 6. Results from the 2x2x2 RM-ANOVA. ... 30
LIST OF FIGURES
Figure 1. Results from experiment 1 ... 8
Figure 2. Results from experiment 2 ... 9
Figure 3. A flow diagram of estimation studies 1-3 ... 11
Figure 4. Experiment materials used for practicing and testing estimation skills ... 14
Figure 5. An example trial from the liquid estimation task ... 17
Figure 6. Properties of the right glasses ... 18
Figure 7. Visualization of volume of quinoa ... 19
Figure 8. A timeline of each condition in the experiment ... 20
Figure 9. A line graph of the absolute Error for “one of the amounts they practiced” across three feedback conditions ... 24
Figure 10. The z-scores for the absolute error of the DVs... 25
Figure 11. The 3-way feedback, learning stage, and trial interaction for “the average of the amounts they practiced.” ... 27
Figure 12. Interaction between feedback and trial at the practice phase ... 28
Figure 13. The interaction between radius and angle ... 31
Examining Spatial Visualization Feedback Timing during Food Estimation
Introduction
Charles is 67 and was recently diagnosed with diabetes. He tries to monitor his blood sugar levels and exercise according to his doctor’s recommendations; however, Charles does not always have the diabetes-related knowledge or skills to understand how his eating
behaviors affect his blood sugar levels. He enjoys going to lunch once a week with his nephew who lives nearby, but his blood sugar spikes higher than usual afterward and he is unsure why. He thinks it might have something to do with the portion sizes he eats at the restaurant, but it always looks the same to him as his lunch at home. Charles learns about a training tool that he can use to help manage his condition. The tool uses his personal Smartphone to create visualizations using augmented reality (AR) to provide a safe way to practice his food portion estimation skills without health consequences. This training program also gives him information to improve his knowledge about healthy food choices. Charles decides to start using the AR tool to help him manage his diabetes. He sets goals for himself, practices estimating the food measurements, and soon learns the right amount of which foods to eat. The AR tool helps him to obtain the knowledge and the skills to eat the right amount of food in the restaurant with his nephew, and he notices that his blood sugar levels stay in a healthy range afterward.
gaps in knowledge regarding the best way to present the training, such as how people should receive feedback via AR, and gaps in how to display those data to the user. The goal for this research is to determine the user needs for feedback, specifically timing of feedback
presentation, to promote learning and transfer for the food portion estimation training portion of this piece of the technology. To do so, we applied what is currently known about
developing feedback for training, diabetes interventions, and the unique affordances of augmented reality.
Feedback
Feedback is the knowledge of results provided to the learner in response to an outcome or a process of an action (Salmoni, Schmidt, & Walter, 1984). Augmented feedback, or information provided above that of the natural environment (e.g., score on a task, percentage correct on a test), has long been seen as important for learning, but its effectiveness depends on the context and skill being developed (Magill, 1994; Wulf & Shea, 2004). The findings concerning effectiveness of feedback are inconsistent; at times feedback increases performance, and others it does not contribute to, or even decreases, performance (Kluger & DeNisi, 1996; Salmoni, Schmidt, & Walter, 1984). When discussing feedback, it is important to differentiate learning from performance.
performance and learning are different, and performance gains or lack thereof may or may not predict learning (Soderstrom & Bjork, 2015). Different types of feedback may impact performance or learning more specifically. For example, outcome feedback, the immediate knowledge of results provided to a learner after a task, is commonly used in learning research, but more directly impacts performance and can cause detrimental effects to the learning of complex tasks if it does not promote understanding of procedural information (Kluger & DeNisi, 1996). Process feedback is a descriptive learning-oriented feedback type that encourages mastery and provides information to the learner about the procedure they used to practice the task (Dweck,1986; Johnson, Perlow, & Pieper, 1993). Further, outcome feedback is desirable for simple tasks, and process feedback is desirable for cognitively complex tasks. While feedback can be outcome-based or process-based, the benefits of more descriptive, process feedback for learning have been noted (Chase & Houmanfar, 2009); however, most experimental tasks utilize outcome feedback when drawing their conclusions. Timing of feedback is also important.
or that immediate feedback in which a student is forced to change their procedural actions is beneficial (VanLehn, 1996). Schroth & Lund’s 1993 experiment examining feedback delay followed the hypothesis of Kulhavy and Anderson (1972) which claimed that participants were able to learn better via interference-perseveration (i.e., delayed feedback is better for correcting errors because during the time before feedback, the memory of the incorrect response fades). However, Kulik & Kulik also found that different studies utilized different delays of feedback: some were as soon as the end of the task (e.g., Monaghan, 1961; Leeds 1970), a few seconds after the practiced item (e.g., Boersma, 1966; Van Dyke & Newton, 1972), a day later (e.g., Newman, Williams, & Hiller, 1974; Surber & Anderson, 1975), or as much as a week after the test (e.g., English & Kinzer, 1966). Interestingly, some of the definitions for immediate or delay contradicted each other; what was considered delayed feedback in one experiment (e.g., feedback a few seconds after each item) was considered immediate feedback in another. Thus, in this experiment, it was important to manipulate the length of feedback delay to try to understand the effect of different feedback delay timings on performance and learning.
Feedback and transfer. When examining feedback, it is also important to address transfer of learning. Transfer of learning is predicted by the number of pieces of knowledge shared between the training and transfer tasks, and thus, more shared pieces of knowledge between the training and transfer tasks should promote learning (VanLehn, 1996).
processing is processing that facilitates the retrieval of information during periods that share the state of processing as the initial state of learning (Schmidt & Bjork, 1992; Morris, Bransford, & Franks, 1977). Transfer appropriate processing provides benefit in tasks that require transfer; that is, it is helpful in situations where novel tasks were not present in learning, but their context was shared. One way in which it is possible to supply feedback and share context with a task in which feedback may not normally be present (thus,
increasing transfer appropriate processing) is by delaying the presentation of that feedback and allowing the learner to experience the learning task internally first.
Participants exposed to delayed feedback may display positive transfer, especially for learning (i.e., after an interval of retention; Schroth, 1992; Schroth, 1995). While many studies have found transfer effects, transfer is sometimes paradoxical, as discussed by
Application Domain
Health care provides an important context for the needs for cognitive skill training. Diabetes is a condition with unique cognitive challenges for self-management, including adhering to a medication regimen, monitoring complex health information, attending regular doctor’s visits, engaging in regular exercise, and following a diabetic diet. Weight loss is particularly important; one study found that for every kilogram of weight loss, there is a 16% reduction in risk of diabetes (Hamman et al., 2006). Although calorie restriction and diet have the highest effect on development and self-management of diabetes (Fung et al., 2004), approximately 48% of people with diabetes do not follow a meal plan (Shultz et al., 2001). Skills and self-efficacy are strongly related to diabetes self-management and are the targets for change to improve diet adherence (Trief, Teresi, Eimicke, Shea, & Weinstock, 2009; Persell et al., 2004). Because of this, skill acquisition, specifically feedback timing for food portion estimation, will be the focus of the proposed research.
Appropriate training interventions can be improved through interactivity that provides individualized feedback, rewards to support healthy behaviors, and situated learning in the environment. Augmented reality (AR) has the potential to provide interactive, situated learning. AR is a view of the real world in which elements are modified - or augmented - by computer-generated elements. For people with diabetes, the mismatch between the
to other health conditions. The results of this experiment will go toward the design of an augmented reality tool for the self-management of diabetes.
Preliminary Studies
The estimation of food is a unique cognitive perceptual task. Types of food modalities or states (i.e., liquid, solid, amorphous solid) is particularly important; specifically, people have a difficult time estimating amorphous foods (foods that, while are solid, lack a defined shape; Yuhas, Bolland, & Bolland, 1989). Overestimation of amorphous foods that lead to a high insulin response (e.g., rice) can be dangerous, especially if continued overestimation occurs. Estimation of food involves spatial working memory to estimate the amount of amorphous food currently on a plate. To influence this, researchers previously studied variable practice and its effects on being able to transfer to different tasks.
The 1971 experiment by Kerr and Booth applied a unique task to a beanbag toss. In their experiment, participants were children asked to complete a beanbag toss. The
participants practiced either one distance from the target (consistent) or many different distances (variable). The results were that participants who practiced many different
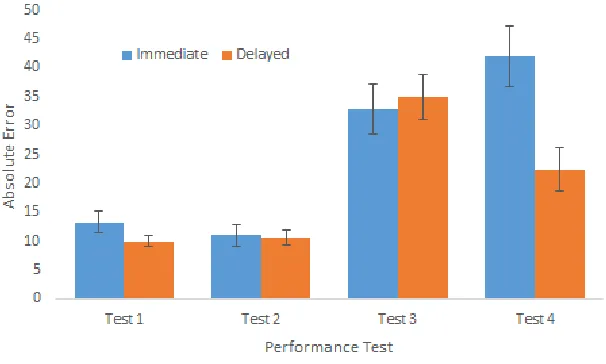
amounts practiced” in the varied feedback group (24g), or were a near transfer (i.e., an amount over two standard deviations larger than they practiced; 52g). Participants were also tested on a far transfer task using clay (32g) to simulate a solid food such as meat. Results from this experiment indicated that there was an effect of feedback timing on absolute error for the near transfer task (52g). There was no effect from practice on the absolute error. Results from this experiment can be seen in Figure 1 below.
Figure 1. Results from experiment 1. These results indicated a significant effect of feedback timing on test 3, the near transfer task. There were no significant effects of practice type on absolute error. Note: During test 1,
participants were asked to estimate “the average of the amounts they practiced” (for consistent, this was the
amount they practiced), during test 2, participants were asked to measure “one of the amounts practiced” by the
varied practice group, for test 3, participants were asked to measure an amount neither had practiced (near
transfer), and for test 4, participants were asked to measure the amount from test 1 with clay (far transfer). The
This task was limited by low practice variability. For the task in the current
experiment, we utilized practice with elements in blocks presented in a random order (e.g., AA, BB, CC, BB, CC, AA), as this promotes retention (Landin & Herbert, 1997).
We conducted a second experiment in which the variability was greater. Participants practiced either 64g for consistent practice or partially counterbalanced blocks of 32g, 49g, 78g, and 97g. They were again tested on either “the average of the amounts they practiced” (64g), “one of the amounts practiced” in the varied feedback group (49g), or a near transfer (152g). Participants were also tested on a far transfer task using clay (64g) to simulate a solid food such as meat. We found that delayed feedback groups had significantly lower absolute error on the far transfer task. Practice groups did not show significant differences, though both improved, indicating that varied practice groups were still learning along with the consistent groups. Results can be seen in Figure 2 below.
Figure 2. Results from experiment 2. These results indicated a significant effect of feedback timing on test 4, the far
transfer task. There were no significant effects of practice type on absolute error. Note: During test 1,
amount they practiced), during test 2, participants were asked to measure “one of the amounts practiced” by the
varied practice group, for test 3, participants were asked to measure an amount neither had practiced (near
transfer), and for test 4, participants were asked to measure the amount from test 1 with clay (far transfer). The
error bars display the standard error of the mean absolute error.
Limitations to these studies were that (1) feedback provided was numeric and used a measure of weight (i.e., was provided as a number of grams) and the task was more spatial and referred to volume; thus, augmented reality may afford better spatial visualization feedback, (2) the delayed feedback occurred immediately after the trial; there was no feedback timing condition with a longer delay, (3) there was no test of learning (i.e., after a retention interval); only performance was tested, (4) though many participants indicated their estimation strategies were visual, they practiced and were tested on weights instead of
Figure 3. A flow diagram of estimation studies 1-3. This figure outlines the independent variables and the goals for each estimation experiment.
The current experiment built on the previous findings by examining the effect of feedback timing (real-time, immediate, and delayed) on absolute error of volume through spatial visualization feedback provided using an AR display on a tablet, by providing an additional test for learning after a retention interval, and by adding a measure of self-efficacy.
It was hypothesized that delayed spatial visualization feedback provided via the tablet would show similar results to that of our previous studies: the immediate group would
one that occurred immediately after the trial, and another that occurred after a 10-second delay. It was hypothesized that participants exposed to the long delay would perform with less absolute error on learning tasks, but no differently from the short delay on performance. Participants with higher liquid estimation scores and participants with higher self-efficacy scores in these groups should also show lower absolute error.
Method
Participants
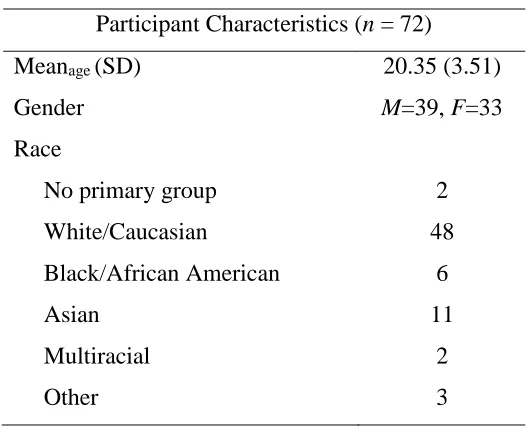
To achieve the appropriate power, we determined that 70 participants should be included in the experiment. This number was calculated in G*Power from a power analysis using the effect sizes from our previous studies. Participants were 72 adults recruited from the North Carolina State University’s Experimetrix participant pool (33F; Mage= 20.35).
Table 1.
Demographic information about participants.
Participant Characteristics (n = 72)
Meanage (SD) 20.35 (3.51)
Gender M=39, F=33
Race
No primary group 2
White/Caucasian 48
Black/African American 6
Asian 11
Multiracial 2
Other 3
Materials
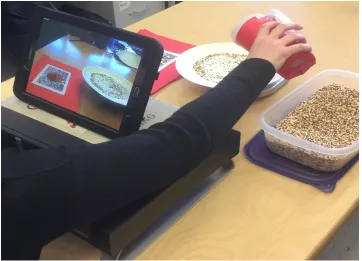
The measurement materials consisted of a digital scale, four pounds of dry quinoa (an amorphous food), a container to hold the quinoa, a covered container with a guard for
pouring attached to the lid, paper plates, modeling clay, and an android tablet capable of using Unity and Vuforia. We also included case with a stand for the tablet to ensure its protection and ability to stand upright during the estimation task. A digital scale was used to easily measure weight, and the volume of the amount was converted by the experimenter based on the density of the quinoa (.72 g/cm3) and the clay (1.85 g/cm3). Feedback was provided via a spatial representation of the amount on the screen of the tablet. The
was chosen for the measurement medium. Pilot testing was conducted using dry corn, and participants were able to roughly estimate the number of kernels to achieve high rates of accuracy after the first few trials. Quinoa gave the task more difficulty and allowed their skill acquisition to be measured over time. The container used was covered with paper to visually block the amount of quinoa so participants could not estimate using visual information. A lid with a hole was used so they could not see the inside of the container while pouring. A picture of the measurement materials is in Figure 4.
Ability tests and questionnaires
The following are ability tests and questionnaires that were administered during the retention interval of this task.
NASA-TLX
The NASA-TLX provides a subjective assessment of workload via an average of six items: mental demand, physical demand, temporal demand, personal performance, effort, and frustration (Hart & Staveland, 1988). The assessment takes approximately five minutes to complete, and is scored by averaging the six ratings. For this task, the NASA-TLX was used to specifically explore the difficulty of the task and how hard the participants were working. This was used to attempt to identify participants who were not giving the task enough effort and to see if effort was related to task performance.
Paper folding
The paper folding task consists of an image on the left displaying a piece of paper folded in various ways (Ekstrom, French, Harman, & Dermen, 1976; Thurstone, 1938). The final folded piece of paper has a dot representing a hole punched through the piece of paper. The task is to select the appropriate unfolded piece of paper from a list with resulting holes in the correct configuration based on the punched hole. The participant is aiming for high accuracy and quick response time.
Cube comparison
the two cubes are the same. None of the letters, numbers, or symbols on the cubes are repeated. The participant is aiming for high accuracy and quick response time.
Task Specific Self-Efficacy Scale
In this experiment, the general self-efficacy scale was modified for the estimation task and was used to see if there were relationships between belief in successful outcomes in the measurement task (task specific efficacy) and task performance. The general
self-efficacy scale is a self-report measure to assess personal beliefs of capacity to perform certain behaviors, meet goals, and achieve success in a general sense (Schwarzer & Jerusalem, 1995). The scale consists of 10 items and is scored by adding the items together. Total score is between 10 and 40 points.
Conservation Test
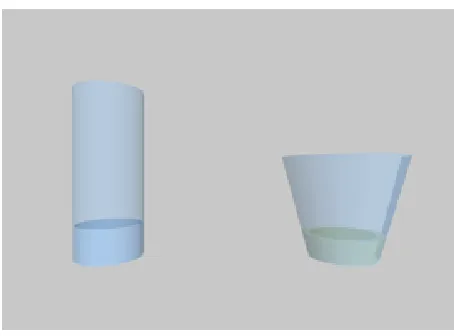
on the left was tall, had a small radius, and had a 0° slant angle (see Figure 5 for an example trial). Other glasses could vary on height (short, tall), radius (small, large), and angle (15°, 30°; Figure 6). We did not include right glasses with 0° slant angle. Performance was calculated as absolute error; that is, the absolute value of the difference between the true volume of liquid in the left glass and the volume filled by the participant in mL in the glass on the right. Accuracy in this task was related to estimation performance in the AR feedback portion of the experiment. Materials for the liquid estimation task included a computer, a mouse, and the liquid estimation program. The liquid estimation task was created in-lab using the Processing programming environment using the Java programming language. Participants saw the items on a grey screen with blue, semi-transparent glasses and blue and green liquid fill.
Figure 6. Properties of the right glasses.
Experiment Design
This experiment followed a mixed-design. The independent variables were (1) the between subjects factor, feedback timing, a 3-level variable that consists of either immediate (during the trial), shortly delayed (immediately after the trial), or longer delayed (10 seconds after the trial) feedback. The immediate feedback condition saw the correct amount via a spatial visualization in real-time, and were then asked to think about their performance for 10 seconds. The shortly delayed feedback group received spatial visualization feedback
seconds. The long delayed condition was asked to think about their performance for 10 seconds, and then they saw their feedback for 5 seconds. While participants were thinking about their performance (before or after seeing their feedback), all feedback was removed. For a timeline of each condition, see Figure 8.
Figure 7. Visualization of volume of quinoa. This figure shows the spatial visualization of the volume of the quinoa that is provided by the AR system. This feedback is transparent and colored to differentiate between the
Figure 8. A timeline of each condition in the experiment. The immediate condition will see their feedback in real-time and then reflect on their performance for 10 seconds after each trial, the short delay condition will see
their feedback for 5 seconds immediately after their trial and then be asked to reflect for 10 seconds, and the
long delay condition will reflect for 10 seconds before seeing their feedback for 5 seconds.
The within-subjects independent variable of learning stage (i.e., performance
main dependent variables were absolute error from the four trials each of four separate performance and learning tests (a total of 16 trials per test). We will also obtain participant characteristics such as self-efficacy score, NASA-TLX score, conservation score, and we will observe practice changes over time.
Procedure
When the participant arrived, the experimenter provided them with the consent forms to read and sign. After signing the consent forms, the experimenter gave one of the forms to the participant to keep for their records and then instructed the participant on the
scale, and the conservation task during a retention interval of one hour before being tested again for learning with the same amounts as the performance test. Finally, they were
provided the debrief, an open ended question about their techniques for estimating during the experiment, and the NASA-TLX.
Results
AR Feedback
We predicted that the immediate feedback group would have the least absolute error on performance tests. However, with the addition of the retention interval, we predicted that the long delayed feedback group would perform better than both other feedback groups on the retention tests. We predicted the long delayed feedback group would also perform better than immediate feedback group on the near and far transfer tasks for performance and learning.
Test Level Analysis
From the 3 (feedback) x 2 (learning stage) mixed-design MANOVA, with dependent measures of mean absolute error across the four trials of the four different tests, we found no significant effects of feedback on absolute error for “the average of the amounts they
Table 2.
Mixed-design MANOVA results for “the average of the amounts they practiced.”
df F Partial ƞ2 p
Feedback 2 1.596 .044 .210
Learning stage 1 10.769 .135 .002
Learning stage * Feedback Condition 2 .887 .416 .025
Table 3.
Mixed-design MANOVA results for “one of the amounts they practiced”
df F Partial ƞ2 p
Feedback 2 1.45 .040 .242
Learning stage 1 1.751 .025 .190
Learning stage * Feedback Condition 2 3.885 .101 .025
Table 4.
Mixed-design MANOVA results for near transfer
df F Partial ƞ2 p
Feedback 2 .320 .009 .727
Learning stage 1 2.831 .039 .097
Table 5.
Mixed-design MANOVA results for far transfer
df F Partial ƞ2 p
Feedback 2 .193 .006 .825
Learning stage 1 .717 .010 .400
Learning stage * Feedback Condition 2 2.196 .060 .119
Figure 9. A line graph of the absolute Error for “one of the amounts they practiced” across three feedback conditions. Note that the immediate practice group is decreasing in absolute error after the retention interval.
The error bars display the standard error of the mean absolute error.
0 2 4 6 8 10 12 14 16 18 Performance Retention Ab so lu te Erro r
Interaction Between Learning Stage
and Feedback for "One of the
Amounts They Practiced"
To allow visual comparisons between the dependent variables, we standardized the values using z-scores. We calculated the z-scores for this analysis by finding the grand mean for each test type across both performance and retention. We used that grand mean for each test to calculate the standard deviation. These results are in figure 9 below.
Figure 10. The z-scores for the absolute error of the DVs. (Top left) “the average of the amounts they practiced” for each feedback group (n.s.) with a general trend of shortly delayed feedback group performing
with the highest absolute error and the long delay feedback is performing with the least absolute error, (Top -0.6 -0.4 -0.2 0 0.2 0.4 0.6 0.8 Performance Retention
"The Average of the Amounts They Practiced"
Immediate Short Delay Long Delay
-0.6 -0.4 -0.2 0 0.2 0.4 0.6 0.8 Performance Retention
"One of the Amounts Practiced"
Immediate Short Delay Long Delay
-0.6 -0.4 -0.2 0 0.2 0.4 Performance Retention Near Transfer
Immediate Short Delay Long Delay
-0.6 -0.4 -0.2 0 0.2 0.4 0.6 Performance Retention Far Transfer
right) “one of the amounts practiced.” These results were statistically significant. The trend of long delay
feedback performing with the least absolute error is continued here. (Bottom left) The near transfer task for
each feedback group. The standard error here is high, but the amount of absolute error is still the least in the
long delay feedback condition. (Bottom right) The far transfer task for each feedback group. The groups are
similar for the performance task, but during the retention task, the immediate condition is the least (n.s.). The
error bars in this figure display the standard error of the mean absolute error.
Trial Level Analysis
We conducted a mixed-design MANOVA to investigate changes over trials in absolute error for each feedback group. For this model, we examined the effects of learning stage (2; performance, retention) and feedback (3; immediate, short delay, long delay) across each trial within each test (4 trials per test, a total of 16 trials). From this analysis, we found a significant effect of learning stage for “the average of the amounts they practiced”
Figure 11. The 3-way feedback, learning stage, and trial interaction for “the average of the amounts they practiced.”
Practice Analysis
amount with short delay feedback performing significantly worse than the other two feedback groups (F(2,70)=4.969, p=.01).
We also conducted a trial-level mixed design-MANOVA with trial (4) and feedback timing (3) on absolute error for each four amounts the participant practiced. We found a significant effect of trial for practice amounts 30mL (F(3,69)=7.72, p=.00006) and 5mL (F(3,69)=8.964, p = .00013). We also found a significant effect of feedback timing for 30mL (F(2,70)=4.556, p=.014) and 5mL (F(2,70)=3.565, p = .034) and found a significant trial by feedback timing interaction for 30mL (F(6,66)=2.803, p=.012; Figure 14). Further trial-level figures are in Appendix B.
Behavioral Observations
In general, participants were reluctant to redo any trials where they had incorrectly estimated. At certain points, participants told the experimenter that they suspected the amount was inaccurate, but it was “close enough.” We also noticed that participants seemed to be avoiding addressing the height of the quinoa when estimating. To get the height of the amount correct, at times they would have to shake or tap the plate to allow the quinoa to spread. Participants in general avoided doing this.
Open-ended Responses and Strategies
Select open-ended responses are reported in Appendix D. From these results, we identify a few strategies and their frequencies reported:
1. Direct comparison (23) 2. Mental imagery (23)
3. Comparison to an object with a known volume (9) 4. Comparison to a known amount (8)
5. Use of time to count the amount (6) 6. Use of height (6)
7. General estimation (4)
8. Creating small portions of known amounts (4) 9. Minimizing spread (4)
10.Use of width (3) 11.Use of weight (2)
For a visualization of this information and a breakdown by feedback condition, see Appendix D.
Liquid Estimation
We found no significant relationship between liquid estimation abilities and AR spatial estimation. However, we examined the liquid estimation results as a whole to try to understand potential cognitive mechanisms behind liquid estimation.
We conducted a target glass Height (2; Short, Tall) x Radius (2;Small, Large) x Angle (2; 15°, 30°) RM-ANOVA to investigate the differences between the target glass properties and absolute error in mL. These results are in Table 3.
Table 6.
Results from the 2x2x2 RM-ANOVA.
df F
Partial eta-squared (η2)
Height 70 6.09* 0.08
Radius 70 21.36** 0.23
Angle 70 10.21** 0.13
Height X Radius 70 2.57 0.04
Height X Angle 70 0.22 0.00
Radius X Angle 70 4.13* 0.06
Height X Radius X Angle 70 1.01 0.01 Note: * p < .05 , ** p <.01.
Height of the target glass was a significant predictor of absolute error, F(1,70)=6.09, p =.016, η2=.08, radius of the target glass was a significant predictor of absolute error,
F(1,70)=10.21, p =.002, η2=.13. There was an interaction between radius and angle,
F(1,70)=4.13, p =.046, η2=.06 (Figure 2).
Figure 13. The interaction between radius and angle. Having a high angle combined with a high radius made for worse absolute error than either alone. The error bars on the graphs represent the standard error of the mean
absolute error.
Table 7.
Means and standard deviations of the absolute error for each target glass type
Low Height Low Radius 15° Angle Low Radius 30° Angle High Radius 15° Angle High Radius 30° Angle
Mean 13.95 20.07 24.53 52.34
SD 11.26 25.09 23.08 71.98
SE 1.34 2.98 2.74 8.54
High Height Low Radius 15° Angle Low Radius 30° Angle High Radius 15° Angle High Radius 30° Angle
Mean 13.94 23.66 38.25 58.19
SD 18.65 30.81 33.77 101.85
SE 2.21 3.66 4.01 12.09
Spatial Ability Tests
AR Estimation Task
Neither spatial ability test was correlated with the mean absolute error from any of the AR estimation tests at performance or retention.
Liquid Estimation Task
.000034. The cube comparison task was not significantly related to any of the target glass properties. However, the scores on the paper folding task were negatively correlated to target glass with low height, low radius, and high angle, r (69) = -.28, p = .017, and target glass with high height, low radius, and high angle, r (69)= -.38, p = .001. These glasses are pictured in Figure 4. It is important to note that a high score on the spatial abilities tests was a better score. Because the liquid estimation task was based on absolute error, a desirable score would be one that is lower. Thus, a negative correlation would mean that as the spatial ability score increases, the amount of error on the liquid estimation task decreases. Spatial ability may have been helpful for glasses with small radii and high angles because the
participants had to mentally rotate the glasses to understand the full change in the bottom and top radius due to a change in angle. The participants would need to rely on their spatial abilities more for a large angle difference because the magnitude is larger. However, with a larger radius, the skill is slightly different - not only are they mentally rotating the glass, but they are also having to compute a dramatically larger volume.
Self-efficacy and AR Estimation
We conducted a bivariate correlation analysis to compare scores on self-efficacy to absolute error reported from each test in the AR estimation task. Participants who were higher in self-efficacy performed with significantly lower error on the near transfer task at the performance test (r(72)=-.376, p =.001. They also performed with less absolute error at retention for “the average of the amounts they practiced” (r(72)=-.288, p =.014), “one of the amounts they practiced” (r(72)=-.310, p =.008), and the near transfer task (r(72)=-.262, p =.026).
NASA-TLX and AR Estimation
We conducted a bivariate correlation analysis to compare the NASA-TLX subscores to the individual AR estimation tests. We found that mental demand, physical demand, performance, and frustration were not significantly related to any one test. However,
temporal demand was significantly correlated with the mean absolute error for “the average of the amounts they practiced” at the performance test (r(72)=-.306, p =.009) and “one of the amounts they practiced” at the performance test (r(72)=-.254, p =.031) indicating that when a participant rated these subscores as higher, the amount of absolute error for these two tests decreased. We also found a significant correlation for effort and absolute error at
feedback condition had significantly lower physical demand than the short delay condition with F(2,69) = 3.501, p = .036, ƞ2 = .09.
Discussion
General observations from the findings from the experiment were that participants were limited in their engagement with the task. A two behaviors indicated this: (1)
participants were avoiding addressing the height of the quinoa when estimating. This may have been because it was difficult and would require participants to repeat trials if they did not get it right. (2) participants would err on the side of overestimating if it meant they had to restart a trial. That is, if they put too much on the scale, sometimes they would just accept the overestimation. We suggest more exacting packaging for amorphous foods to limit the amount of effort a person who is estimating would have to give. Standardization of
packaging would also help, as they would only have to learn one shape. However, it would not help them to learn new and different shapes.
Our prediction that immediate feedback will provide a beneficial effect on
performance was not accurate, and thus, did not align with other findings involving applied studies and list learning (see Kulik and Kulik, 1988). These findings would imply that in real world situations requiring AR support and high performance for estimating or measuring foods (e.g., for help estimating before training is complete), it would be best to provide immediate feedback. However, the interaction found for “one of the amounts they practiced” indicates that immediate feedback does have advantages at retention. This interaction
Thus, if immediate feedback is used in an AR display, it would imply that for best retention, participants should practice many different amounts to gain familiarity. However, this decrease in error still only decreases to the level of the long delay feedback. Thus, we still recommend long delay feedback over either other group.
We noticed general trends that long delay feedback provided information that influenced participants to have consistently less, though not statistically less, absolute error than either other group. This implies that for learning more and different kinds of food estimation, it may be best to have delayed feedback for practice. In this case, the findings specifically influence the design of our AR tool to provide a more enriching learning environment through appropriate feedback (delayed spatial visualizations).
This experiment was limited in that it only examined the feedback timing in the context of food estimation; as evidenced in Kluger and DeNisi’s feedback meta-analysis, the particular timing of feedback for this situation may not be generalizable to other contexts or tasks. Feedback modality (i.e., numeric vs. spatial) may also affect skill acquisition in this context, and is not studied here. Further, this experiment holds practice type constant, and future studies will examine the effects of feedback timing and practice type (consistent, varied, block varied) on absolute error.
feelings of increased effort. This finding indicates that a learning platform for food
estimation should consider difficulty of estimation when providing practice. However, we believe this was found because these two tests are the first two tests the participant
experiences after the AR feedback is removed completely. Thus, for participants who felt the task as a whole was more difficult, absolute error was higher during those first two tests when the feedback was not present.
Overall, the topic of food estimation training for diabetes using appropriate feedback and practice is important for creating meaningful change in patient outcomes. Additionally, the generalization of skill acquisition for similar health behaviors needs to be determined. Creating an AR tool to support this training and to support other areas of the
self-management of the disease may also be generalizable to other chronic diseases.
Limitations
References
Anderson, J.R., Corbett, A.T., Koedinger, K.R., & Pelletier, R. (1995). Cognitive tutors: Lessons learned. The Journal of the Learning Sciences, 4(2), 167-207.
Boersma, F.J. (1966). Effects of delay of information feedback and length of postfeedback interval on linear programming. Journal of Educational Psychology, 57, 140-145. Cepeda, N.J., Pashler, H., Vul, E., Wixted, J.T., & Rohrer, D. (2006). Distributed practice in
verbal recall tasks: A review and quantitative synthesis. Psychological Bulletin, 132, 354–380.
Chase, J.A. & Houmanfar, R. (2009). The differential effects of elaborate feedback and basic feedback on student performance in a modified, personalized system of instruction course. Journal of Behavioral Education, 18(3), 245-265.
Craik, F.I.M., & Tulving, E. (1975). Depth of processing and the retention of words in episodic memory. Journal of Experimental Psychology: General, 104, 268-294. Dweck, C. (1986). Motivational processes affecting learning. American Psychologist, 41(10),
1040-1048.
Ekstrom, R. B., French, J. W., Harman, H. H., & Dermen, D. (1976). Manual for kit of factor referenced cognitive tests. Princeton, NJ: Educational Testing Service.
English, R.A. & Kinzer, J.R. (1966). The effect of immediate and delayed feedback on retention of subject matter. Psychology in the Schools, 3, 143-147.
Goode, S. & Magill, R.A. (1986). The contextual interference effects in learning three badminton serves. Research Quarterly for Exercise and Sport, 57, 308– 314. Hall, K.G., Domingues, D.A., & Cavazos, R. (1994). Contextual interference effects with
skilled baseball players. Perceptual and Motor Skills 78, 835–841
Hamman, R.F., Wing, R.R., Edelstein, S.L., Lachin, J.M., Bray, G.A., Delahanty,
L.,…Wylie-Rosett, J. (2006). Effect of weight loss with lifestyle intervention on risk of diabetes. Diabetes Care, 29(9), 2102-2107.
Hart, S. G., & Staveland, L. E. (1988) Development of NASA-TLX (Task Load Index): Results of empirical and theoretical research. In P. A. Hancock and N. Meshkati (Eds.) Human Mental Workload. Amsterdam: North Holland Press.
Jackson, J.W. (2002). Enhancing self-efficacy and learning performance. Journal of Experimental Education, 70(3), 243-254.
Johnson, D.S., Perlow, R., & Pieper, K.F. (1993). Differences in task performance as a function of type of feedback: Learning-oriented versus performance-oriented feedback. Journal of Applied Social Psychology, 23(4), 303-320.
Kerr, R., & Booth, B (1974). Specific and varied practice of motor skill. Perceptual and Motor Skills, 46(2). 395-401
Kluger, A.N. & DeNisi, A. (1996). The effects of feedback interventions on performance: A historical review, a meta-analysis, and a preliminary feedback intervention theory. Psychological Bulletin, 119(2), 254-284
Kulik, J.A. & Kulik, C-L.C. (1988). Timing of feedback and verbal learning. Review of Educational Research, 58(1), 79-97.
Landon, D.L., & Herbert, E.P. (1997) A comparison of three practice schedules along the contextual interference continuum. Research Quarterly for Exercise and Sport 68, 357-361.
Leeds, R.D. (1970). The effects of immediate and delayed knowledge of results on
immediate and delayed retention. Dissertation Abstracts International, 31, 3343A. Magill, R.A. (1994). The influence of augmented feedback on skill learning depends on
characteristics of the skill and the learner. Quest, 46, 314-327.
Monaghan, F.V. (1961). The effect of delay of knowledge of test results on learning in a natural science course. Dissertation Abstracts International, 22, 2723.
Montano, D.E., & Kasprzyk, D. (2008). Theory of reasoned action, theory of planned behavior, and the integrated behavioral model. In K. Glanz, B. K. Rimer, & K. Viswanath (Eds.), Health Behavior and Health Education: Theory, Research, and Practice (4th ed., pp. 67-96). San Francisco, CA: Jossey-Bass.
Newman, M.I., Williams, R.G., & Hiller, J.H. (1974). Delay of information feedback in an applied setting: Effects on initially learned and unlearned items. Journal of
Experimental Education, 42, 55-59.
Perkins, D.N. & Salomon, G. (1992). Transfer of learning. International Encyclopedia of Education (2nd ed.). Oxford, UK: Pergamon Press.
Persell, S.D., Keating, N.L., Landrum, M.B., Landon, B.E., Ayanian, J.Z., Borbas, C., & Guadagnoli, E. (2004). Relationship of diabetes-specific knowledge to self-management activities, ambulatory preventive care, and metabolic outcomes. Preventive Medicine, 39(4), 746-752.
Rolls, B.J., Morris, E.L., & Roe, L.S. (2002). Portion size of food affects energy intake in normal-weight and overweight men and women. American Journal of Clinical Nutrition, 76(6), 1207-1213.
Salomon, G. & Perkins, D.N. (1989). Rocky roads to transfer: Rethinking mechanisms of a neglected phenomenon, Educational Psychologist, 24, 113–142.
Salmoni, A.W., Schmidt, R.A., & Walter, C.B. (1984) Knowledge of results and motor learning: A review and critical reappraisal. Psychological Bulletin, 95, 355–386. Schroth, M.L. (1992). The effects of delay of feedback on delayed concept formation transfer
task. Contemporary Educational Psychology, 17(1), 78-82.
Schwarzer, R., & Jerusalem, M. (1995). Generalized Self-Efficacy scale. In J. Weinman, S. Wright, & M. Johnston, Measures in health psychology: A user’s portfolio. Causal and control beliefs (pp. 35-37). Windsor, England: NFER-NELSON.
Schmidt, R.A. & Bjork, R.A. (1992). New conceptualizations of practice: Common principles in three paradigms suggest new concepts for training. Psychological Science, 3(4), 207-217.
Shultz, J.A., Sprague, M.A., Branen, L.J., & Lambeth, S. (2001). A comparison of views of individuals with type 2 diabetes mellitus and diabetes educators about barriers to diet and exercise. Journal of Health Communication, 6(2), 99-115.
Schunk, D. H. (1990). Goal setting and self-efficacy during self-regulated learning. Educational Psychologist, 25, 71-86.
Simons, P.R.J. (1999). Transfer of learning: Paradoxes for learners. International Journal of Educational Research, 31, 577-589.
Soderstrom, N.C. & Bjork, R.A. (2015). Learning versus performance: An integrative review, Perspectives on Psychological Science, 10(2), 176-199.
Surber, J.R. & Anderson, R.C. (1975). Delay-retention effect in natural classroom settings. Journal of Educational Psychology, 67, 170-173.
Thurstone, L. L. (1938). Primary mental abilities. Psychometric Monographs, i. Chicago: University of Chicago Press.
Trief, P.M., Teresi, J.A., Eimicke, J.P., Shea, S., & Weinstock, R.S. (2009). Improvement in diabetes self-efficacy and glycaemic control using telemedicine in a sample of older ethnically diverse individuals who have diabetes: the IDEATel project. Age and Ageing, 38(2), 219-225.
VanLehn, K. (1996). Cognitive skill acquisition. In J. T. Spence (Ed.), J. M. Darly & D. J. Foss (Assoc. Eds.), Annual Review of Psychology: Vol. 47 (pp. 513-539). Palo Alto, CA: Annual Reviews, Inc.
Wulf, G., & Shea C. H. (2004). Understanding the role of augmented feedback: The good, the bad, and the ugly. In A.M. Williams & N.J Hodges (Eds.), Skill Acquisition in Sport: Research, Theory and Practice, (121–144). London: Routledge.
Appendix A
Appendix B
Appendix C