WATER QUALITY TREND AT THE UPPER PART OF JOHOR RIVER IN RELATION TO RAINFALL AND RUNOFF PATTERN
HASMIDA BINTI HAMZA
A thesis submitted in fulfillment of the requirement for the award of the degree of
Master of Civil Engineering (Hydraulic and Hydrology by Course Work)
Faculty of Civil Engineering Universiti Teknologi Malaysia
ii
iii
ACKNOWLEDGEMENTS
I wish to express my deep appreciation to my research supervisor Associate Professor Ir Dr Ayob Katimon for his continual guidance and encouragement during the preparation of this research thesis.
I also wish to express my thanks to Department of Irrigation and Drainage (DID), Johor and Syarikat Air Johor (SAJH) for their permission to use the hydrological and water quality data respectively in this present study. To all of my friends, thank you very much for their willingness to help, valuable ideas and opinion, support and courage.
iv
ABSTRACT
Due to the fact that rainfall and runoff have a vital relationship to water quality, these hydrological variables are among the most dominants controlling factor on the variation of water quality. Trend analysis on time series data has proved to be a useful tool for effective water resources planning, design, and management since trend
detection of hydrological variables such as streamflow and precipitation provides useful information on the possibility of change tendency of the variables in the future. Both ARIMA modelling approach (parametric method) and Mann-Kendall test
(non-parametric method) were applied to analyses the water quality and rainfall-runoff data for Johor River recorded for a long period (2004 to 2007). SPSS Statistical Packages Software was used in performing ARIMA time series modelling and Microsoft Excel function was used for Mann-Kendall (MK) test. This study aims to investigate the water quality trend over a long period particularly at the upper part of the Johor River in relation to rainfall and runoff pattern using both parametric and non-parametric method. This study focusing on four parameters of nutrient types of pollutant (NH4, turbidity, colour and SS) and four parameters of chemical types of pollutant (PH, Al, Mn, Fe). Nutrient and chemical types of pollutant is more significant as major land use
v
ABSTRAK
Berdasarkan fakta yang menyatakan bahawa hujan dan air larian mempunyai hubungan yang sangat penting terhadap kualiti air, pembolehubah-pembolehubah
hidrologi ini adalah di antara faktor kawalan yang paling utama ke atas perubahan kualiti air. Trend analysis terhadap data siri masa telah dibuktikan sebagai sebuah alat untuk perancangan sumber air secara efektif, rekabentuk dan pengurusan, kerana pengesanan corak naik-turun bagi parameter-parameter hidrologi seperti hujan dan pergerakan air menyediakan maklumat berguna mengenai kemungkinan berlaku perubahan pada parameter-parameter hidrologi ini pada masa akan datang. Kedua-dua kaedah iaitu permodelan ARIMA (kaedah parametrik) dan Ujian Mann-Kendall (kaedah bukan parametrik) telah diaplikasikan untuk menganalisa data kualiti air dan data hujan-air larian bagi Sungai Johor yang telah direkodkan pada satu tempoh yang panjang (2004 hingga 2007). SPSS Statistical Packages Software telah digunakan dalam menjalankan permodelan siri masa ARIMA dan Microsoft Excel telah digunakan untuk Ujian Mann-Kendall (MK). Kajian ini bermatlamat untuk mengkaji corak kualiti air berhubungan dengan corak hujan dan air larian pada tempoh yang panjang terutamanya di bahagian atas Sungai Johor dengan menggunakan kedua-dua kaedah parametrik dan bukan parametrik. Kajian ini telah memfokuskan kepada lapan parameter kualiti air. Nutrient dan bahan pencemar jenis kimia adalah lebih penting memandangkan guna tanah terbesar di sekitar Sungai Johor ialah aktiviti pertanian dan masalah hakisan tebing sungai telah dikesan. Ujian Mann-Kendall menunjukkan bahawa semua parameter yang telah dikaji adalah penting pada 95% had keyakinan. Corak meningkat telah
diperhatikan pada parameter kekeruhan (turbidity), warna (colour) dan endapan terapung (SS) manakala corak menurun bagi PH, Al, Mn dan Fe. Nilai kebarangkalian (P) yang diperolehi ialah kosong dan menghampiri kosong menunjukkan bahawa semua
vi
TABLE OF CONTENTS
CHAPTER PAGE
THESIS TITLE
DECLARATION SHEET i
DEDICATION ii
ACKNOWLEDGEMENTS iii
ABSTRACT iv
ABSTRAK v
TABLE OF CONTENTS vi
LIST OF FIGURES x
LIST OF TABLES xi
LIST OF SYMBOLS AND ABREVIATIONS xii
LIST OF APPENDICES xiii
CHAPTER I INTRODUCTION
1.1 Introduction 1
1.2 Background of Study 3
1.3 Problem Statement 3
1.4 Aims of Study 7
1.5 Objectives of Study 7
vii
1.7 Limitation of Study 8
1.8 Significant of Study 8
CHAPTER II STUDY AREA DESCRIPTION
2.1 Introduction 9
2.2 Study Area 9
2.3 Water Resources 11
2.4 Land Use 11
CHAPTER III LITERATURE REVIEW
3.1 Introduction 13
3.2 Water quality parameter 13
3.2.1 PH 14
3.2.2 Turbidity 14
3.2.3 Suspended sediment (SS) 14
3.2.4 Trace elements (Fe, Al and Mn) 14
3.2.5 Ammonium (NH4) 15
3.2.6 Colour 15
3.3 Rainfall-runoff Relationship 15
3.4 Time Series Data 17
3.5 Previous studies 17
3.5.1 Previous Study on Mann-Kendall Test 18 3.5.2 Previous Study on Water Quality and ARIMA
viii
CHAPTER IV RESEARCH SITE METHODOLOGY
4.1 Introduction 22
4.2 Mann-Kendall Test Procedure 22
4.3 Theory of ARIMA Modeling Approach 23
4.4 Model Assumptions 24
4.4.1 Data Stationarity 24
4.4.2 Normal Distribution 25
4.4.3 Outlier 25
4.4.4 Missing Data 26
4.5 ARIMA Modelling Procedures 27
4.5.1 Model Identification 27
4.5.2 Model Parameters Estimation 28
4.5.3 Diagnostic Checking 28
CHAPTER V DATA COLLECTION AND ANALYSIS
5.1 Introduction 30
5.2 Types and Sources of Time Series Data 30
5.2.1 Hydrological Data 31
5.2.2 Water Quality Data 31
5.3 Example of Mann-Kendall Test 31
5.4 Example of ARIMA Modelling 34
ix
CHAPTER VI RESULT AND DISSCUSSION
6.1 Rainfall-runoff Pattern 40
6.2 Correlation between Rainfall-Flow and Water Quality 41 6.3 Water Quality-Rainfall and Water Quality-Flow Trend 42
6.4 Best Fitted ARIMA Model 46
6.5 Water Quality Trend Using ARIMA 52
6.5.1 Discussion on the Water Quality Trend 55
CHAPTER VII CONCLUSION AND RECOMMENDATION
7.1 Introduction 58
7.2 Recommendation 59
REFERENCES 60
x
LIST OF FIGURES
No Title Page
1.1 Typical Johore River Corridor 6
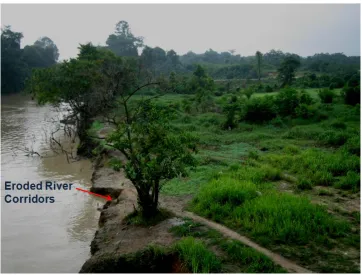
1.2 Eroded River Corridor 6
2.1 Map of Johore River 10
2.2 Johore River and Its Surrounding 12
3.1 Schematic representation of watershed hydrology 16 3.2 Block diagram of watershed hydrological processes and storage 17 4.1 Histogram shows outliers in a set of observation 26 5.1 Procedures for determination of descriptive statistic of the
variables investigated for Mann-Kendall analysis
33
5.2 Procedures for determination of z-score of the variables investigated for Mann-Kendall analysis
34
5.3 Plots of the Original Data for PH Series at Year 2004 35 5.4 Analyse Tools in SPSS for estimation of model parameter 36 5.5 ACF and PACF Plot of Error for Best Fitted Model, PH (2004) 38
xi
LIST OF TABLES
No Title Page
2.1 Main Land Use at Johor River 11
5.1 Possible ARIMA Model for PH (2004) 37
6.2 (a) Correlation between Water Quality and Rainfall 42 6.2 (b) Correlation between Water Quality and Flow 42
6.3 Correlation among Parameter Investigated 42
6.4 Result Summary from Mann Kendall Analyses of Water Quality and Rainfall Parameter
43
6.5 Result Summary from Mann Kendall Analyses of Water Quality and Flow Parameter
44
6.6 (a) Best Fitted ARIMA Model for PH Parameter 46 6.6 (b) Best Fitted ARIMA Model for Colour Parameter 46 6.6 (c) Best Fitted ARIMA Model for Turbidity Parameter 47 6.6 (d) Best Fitted ARIMA Model for Alluminium (Al) Parameter 47 6.6 (e) Best Fitted ARIMA Model for Iron (Fe) Parameter 48 6.6 (f) Best Fitted ARIMA Model for Ammonium (NH4) Parameter 48 6.6 (g) Best Fitted ARIMA Model for Manganese (Mn) Parameter 48 6.6 (h) Best Fitted ARIMA Model for Suspended Solid (SS) Parameter 49
6.7 (a) PH Trend 53
6.7 (b) Iron (FE) Trend 53
6.7 (c) Alluminium (AL) Trend 53
6.7 (d) Colour Trend 54
6.7 (e) Turbidity Trend 54
6.7 (f) Ammonium (NH4) Trend 54
6.7 (g) Manganese (MN) Trend 55
xii
LIST OF SYMBOLS AND ABREVIATIONS
a
Standard deviation
AR coefficient
MA coefficient
ACF Autocorrelation function AIC Aikaike Information Criteria
ARIMA Autoregressive Integrated Moving Average at Residual series
B Back shift operator
C Model constant
ck Autocovariance at lag k d Degree of differencing
DID Department of Irrigation and Drainage FELDA
MARDI Malaysian Agricultural Research and Development Institute Nt Noise series
OLS Ordinary Least Square
p AR parameter
xiii
LIST OF APPENDICES
No Title Page
A Flowchart of Methodology 66
B Daily Hydrological and Water Quality Data 67
C Output from Microsoft Excel Data Analysis 106
D Sequence Plot, Histogram, ACF and PACF Plot of the Original Data for PH
114
E Sequence Plot, Histogram, ACF and PACF Plot of the Original Data for Colour
117
F Sequence Plot, Histogram, ACF and PACF Plot of the Original Data for Turbidity
121
G Sequence Plot, Histogram, ACF and PACF Plot of the Original Data for Al
125
H Sequence Plot, Histogram, ACF and PACF Plot of the Original Data for Fe
129
I Sequence Plot, Histogram, ACF and PACF Plot of the Original Data for NH4
133
J Sequence Plot, Histogram, ACF and PACF Plot of the Original Data for Mn
137
K Sequence Plot, Histogram, ACF and PACF Plot of the Original Data for SS
141
L Example of Output Generated From SPSS 144
1
CHAPTER I
INTRODUCTION
1.1 Introduction
Long-term trend of water quality and hydrological parameters (rainfall-runoff) in natural systems reveal information about physical, chemical and biological changes and variations due to manmade and seasonal interventions.
Trend analysis on time series data has proved to be a useful tool for effective water resources planning, design, and management (Burn and Hag Elnur, 2002; Gan, 1998; Lins and Slack, 1999; Douglas et al., 2000; Hamilton et al., 2001; Yue and Hashino, 2003; and others) since trend detection of hydrological variables such as streamflow and precipitation provides a useful information on the possibility of change tendency of the variables in the future (Yue and Wang, 2004). Abu Farah (2006) mentioned that trend analysis is a formal approach in deciding whether an apparent change in water quality is likely due to random noise or to an actual underlying change in the ecosystem.
2
relationship of the water quality-rainfall and water quality-flow can be obtained by the probability (P) value. P equal to zero means that the probability that different in trend of two variables investigated is zero. Hence, they have similar trend. This method has been used by many researchers (A.W Kenneth and G.P Robert, 2006; Yue and Wang, 2004; Abu Farah, 2006 and others) from various disciplines. The majority of the previous studies have assumed that sample data are serially independent.
It is known that some hydrological time series such as water quality and streamflow time series may show serial correlation (Yue and Wang, 2004). In such a case, the existence of serial correlation component such as an autoregressive (AR) process from a time series will affect the ability of the Mann-Kendall test to assess the significance of trend (Von Storch, 1995). Besides, these parameters change continually through time, arise from dynamic processes and consist of random error components with stochastic variations in space and time (Anpalaki et. al., 2006) that cannot be explained by normal analytical procedure. Besides, water quality and hydrological time series with long-term trend, when recorded by any consistent time interval, will display some measure of auto-correlation. This is expected to affect the p-values derived from autoregressive and q-values from the moving average model parameters in a time series ARIMA modeling approach. Autoregressive (AR) component of the model represent the relationship between present and past observations. General relationship of water quality parameter and rainfall-runoff parameter can be obtained by comparing the annual runoff coefficient with AR coefficient of each parameter investigated.
This approach can also adequately represent the relationship of observed data using few parameters (Box et.al., 1994). Though the main aim of such effort is directed towards obtaining suitable dynamic models for predicting future value, through transfer function modeling approaches, dynamic relationship between hydrological and water quality parameters could be obtained.
ARIMA modelling approach are extensively used for modelling of seasonal or nonseasonal time series data from various disciplines, such as hydrology,
3
2001), and (Slini et. al., 2002). Both Mann-Kendall test and ARIMA modelling were performed in this study to determine the water quality and rainfall-runoff trend and their relationship.
1.2 Background of Study
This study was concerned on the determination of water quality trend at the upper part of Johore River in relation to rainfall and runoff pattern. Study area description can be found in Chapter 2 of this report. The study processes are
including site visit, data collection, Mann-Kendall analysis and ARIMA time series or trend analysis. The methodology procedures were discussed in Chapter 4.
Eight (8) water quality parameters were modelled to see their variation when rainfall and runoff changed. The water quality parameters investigated are the PH level, Aluminium (Al), Manganese (Mn), Ferum (Fe), Ammonium (NH4), turbidity, colour and suspended solid (SS).
The climax of this study occurred on the modelling stage whereas the aims and the objectives of the study were achieved. Mann-Kendall test and ARIMA modelling approach was applied in this stage and was performed using Microsoft Excel function and SPSS Statistical Packages respectively.
1.3 Problem Statement
4
berembang trees that line the banks of the Johore River. Hence, the water quality of this river should maintain clean.
Based on the Environmental Quality Report (DOE, 2007), Johore River Basin was categorized as slightly polluted river basin. As reported, Johore River still
considered clean which is fall into Type II (Water Quality Standard Malaysia). However, two of its tributaries (Lebam River and Tiram River) are categorized as slightly polluted river. Quick action should be taken to assess the level of water quality of the Johore River. Therefore, some prevention action could be made to control the pollution by the aims of maintaining its river water quality status or if possible improved its water quality.
Other problem is eroded and disturbed of river corridor as shown in Figure 1.1 and Figure 1.2 below. Then, soil detachment process from the river bank may have the possibility to cause turbid water when some amounts of materials such as clay, silt, organic and inorganic matter enter the river.
Eroded soil particles also carry associated pollutants that are harmful to the ecology of receiving water bodies and to human being (Vladimir, 2003). This is probably implied that the increasing amount of rainfall might have a significant effect to the water quality parameters (Feng et. al., 2007).
Vladimir (2003) also mentioned that pollution from diffuse sources is driven by meteorological events that include at atmospheric transport for local, regional, global and precipitation. Crapper et al. (1999) also suggested that rainfall is probably the most widely measured meteorological parameter and is one of the major
determinants of erosion. Supported by Feng (2007), mentioned that increasing of rainfall in a wet season could result in rising of discharge flow and concentration of Total Suspended Solid (TSS).
5
1930s, based on their measurements it was found that general land disturbance by agriculture can increase erosion rates by two or more orders of magnitude. Fertilizer used in the agriculture activities also the major pollutant in water quality. Then, although mining is not widespread as agriculture, water quality impairment resulting from mining is usually more harmful.
The water quality, however, also will be affected by stream flow volumes, both concentrations and total loads (Lunchakorn et al., 2008). Their cited such the research conducted in Finland indicates that changes in stream water quality, in terms of eutrophication and nutrient transport, are very dependent on changes in stream flow and a reduction in stream flow might lead to increase in peak concentrations of certain chemical compounds. Besides, according to the hydrological cycle, when the precipitation increases, it results in accumulation of rainfall in rivers.
These facts show that rainfall and runoff have a vital relationship to the water quality. In fact, these hydrological variables are among the most dominants
controlling factor on the variation of water quality. Understanding of this relationship in Johor River system is a vital key toward an optimal management of its resources.
Analyses on daily water quality data together with the rainfall-runoff data as the primary investigation might gave a clear view of this relationship. However, it is difficult to quantify because it involves multi-inter-related variables and these parameters change continually through time, arise from dynamic processes and consist of random error components with stochastic variations in space and time that cannot be modeled or explained by normal analytical procedures. Hence, it is very difficult to incorporate the effects of all these factors in any single calculation. Therefore, ARIMA and transfer function modelling which is capable to model the trend and identified the water quality and rainfall-runoff relationship was applied in this study.
6
Eroded river bank might also affect by this activities and or by other activities such as sand mining and land reclamation activities.
Figure 1.1: Typical Johore River Corridor.
7
1.4 Aims of Study
The study aims to investigate the water quality trend over a long period at the upper part of Johor River. The study also aims to provide some useful information on the relationship between water quality, rainfall and runoff.
1.5 Objectives of Study
The objectives of this study are as follow:
1. To determine water quality, rainfall and runoff trend of Johor River for the year of 2004 to 2007 using ARIMA modeling approach.
2. To determine relationship between water quality parameter and rainfall-runoff pattern of the study catchment through transfer function modeling approach.
3. Determine the most sensitive parameter among the water quality parameter regarding to the changes in rainfall and runoff
1.6 Scope of Study
1. Site visit to the study area to assess the problems that exist in the site. 2. Data collection of water quality and rainfall-runoff data.
3. Trend analysis by performing ARIMA time series analysis using SPSS Statistical Packages Software.
4. Statistical analysis for model fitting and diagnostic checking using SPSS Statistical Packages Software.
8
1.7 Limitation of Study
1. The water quality trend will be predicted for the period of 4 years (2004-2007) based on available data.
2. Only eight (8) parameters of water quality will be investigated.
3. The study only covered area surrounding the river for about 30 km length of the Johor River.
4. This study will focused on water quality trend and water quality and rainfall runoff relationship not the cause and source of pollutant.
5. Daily data will be used for all of the parameter.
1.8 Significant of Study
This study will provide information on the dynamics of the water quality and hydrologic behavior of Johore River based on past time series data. Output generated from transfer function model is important because it is only when the dynamic characteristics of a system are understood that intelligent direction, manipulation, and control of the system is possible. Understanding of this relationship in Johore River system is a vital key toward an optimal management of its resources.
It was recognized that water is life itself and without it we cease to exist. Moreover, the demand of water increases and pollution depletes more of our water resources. Therefore, this study is one of the initiative to ensure the water quality and environment been properly manage at Johor River, as it is the most important sources of raw water to satisfy the clean water supply demand for the entire Johore State and also Singapore.
Besides, evaluation of water quality parameters is necessary to enhance the performance of an assessment operation and develop better water resource