0% 10% 20% 30% 40% 50% 60% 70% 80% 90% 100%
MISLEADING UNVERIFIABLE FALSE TRUE
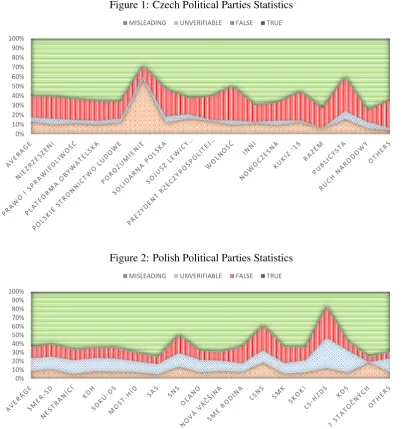
Figure 1: Czech Political Parties Statistics
0% 10% 20% 30% 40% 50% 60% 70% 80% 90% 100%
MISLEADING UNVERIFIABLE FALSE TRUE
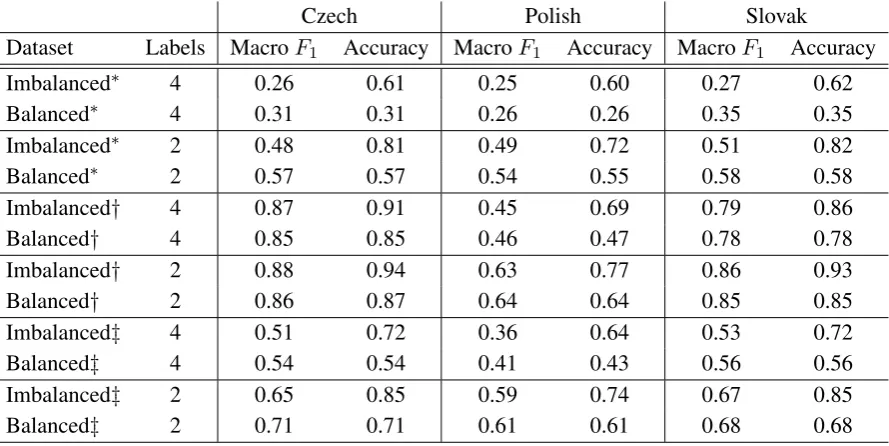
Figure 2: Polish Political Parties Statistics
0% 10% 20% 30% 40% 50% 60% 70% 80% 90% 100%
MISLEADING UNVERIFIABLE FALSE TRUE
Czech Polish Slovak
Dataset Labels MacroF1 Accuracy MacroF1 Accuracy MacroF1 Accuracy
Imbalanced 4 0.21 / 0.19 0.25 / 0.62 0.21 / 0.19 0.25 / 0.62 0.21 / 0.19 0.25 / 0.64 Balanced 4 0.25 / 0.25 0.25 / 0.25 0.25 / 0.25 0.25 / 0.25 0.25 / 0.25 0.25 / 0.25 Imbalanced 2 0.35 / 0.45 0.35 / 0.82 0.34 / 0.42 0.34 / 0.73 0.33 / 0.45 0.33 / 0.83 Balanced 2 0.50 / 0.50 0.50 / 0.50 0.50 / 0.50 0.50 / 0.50 0.50 / 0.50 0.50 / 0.50
Results ofrandom / majorityclass classifiers.
Table 4: Results of a random and majority class (separated by slash random / majority) classifica-tion. For example, the accuracy for Czech imbalanced dataset for all four labels is 0.25 for the random classifier, 0.62 for the majority class classifier.
Czech Polish Slovak
Dataset Labels MacroF1 Accuracy MacroF1 Accuracy MacroF1 Accuracy
Imbalanced∗ 4 0.26 0.61 0.25 0.60 0.27 0.62
Balanced∗ 4 0.31 0.31 0.26 0.26 0.35 0.35
Imbalanced∗ 2 0.48 0.81 0.49 0.72 0.51 0.82
Balanced∗ 2 0.57 0.57 0.54 0.55 0.58 0.58
Imbalanced† 4 0.87 0.91 0.45 0.69 0.79 0.86
Balanced† 4 0.85 0.85 0.46 0.47 0.78 0.78
Imbalanced† 2 0.88 0.94 0.63 0.77 0.86 0.93
Balanced† 2 0.86 0.87 0.64 0.64 0.85 0.85
Imbalanced‡ 4 0.51 0.72 0.36 0.64 0.53 0.72
Balanced‡ 4 0.54 0.54 0.41 0.43 0.56 0.56
Imbalanced‡ 2 0.65 0.85 0.59 0.74 0.67 0.85
Balanced‡ 2 0.71 0.71 0.61 0.61 0.68 0.68
∗dataset only with claim
†dataset with both claim and reasoning.
‡dataset with both claim and reasoning without give-away words.
Table 5: Results of logistic regression classification.
unigram and bigram features. Experiments with the reasoning are performed on a combination of the claim text and the reasoning text. First, the reasoning text and the claim text are concatenated, and then we extract the unigram and bigram fea-tures. These features are used as an input to the classifier.
4.2 Results
We report results for the experiments for all three languages, including results of a random and ma-jority class classification in Table4.
In Table 5 we show the results for the Logis-tic Regression classifier on the balanced and im-balanced datasets for the following text combina-tions:
• claim
• claim & reasoning
• claim & reasoning without give-away words
On the balanced dataset we can see that us-ing only unigrams and bigrams as features is not enough for the classifier as the results are only slightly better than the majority baseline; thus more sophisticated methods are needed to extract the information contained in the reasoning part of the dataset.
We can see that the results achieved on both claim and reasoning are very high (F1 0.87,