Article
1
Study on the Change Characters of the Urban Spatial
2
Light Pollution from Ground to Zenith
3
Ming Liu1*, Baogang Zhang2, Qingli Hao 1, Xiaowei Guo 1, Weishan Li 1
4
5
1 Laboratory of Building Technology, Dalian University of Technology, Dalian, 116024,
6
China;[email protected];[email protected];
7
2 Laboratory of Building Environment and New Energy Resources, Faculty of Infrastructure Engineering,
8
Dalian University of Technology, Dalian, 116024, China;[email protected]
9
*
Correspondence:[email protected];Tel.: +1-303-258643610
11
12
Abstract: As the problem of light pollution becomes more serious, more and more scholars pay
13
attention to this issue and carry out related research. In the perspective of cities, the measurements
14
of light pollution mainly focus on the brightness of the sky or artificial lighting on the ground.
15
However, there is lack of research on the whole urban space. With the two-dimensional brightness
16
analyses, this paper processes the changes of the light environment of the whole urban space into
17
image quantization. It gets the 3D and 2D light environment changes of luminance distribution,
18
color temperature distribution and chromaticity in the three space layers, the ground layer, the
19
urban canopy layer and the sky layer, from dusk with natural light to night with artificial lighting
20
completely. It is found that the brightness difference between the light environments among the
21
three city levels gradually reduces with the measuring time, and the final values maintain at
22
0.11~0.25cd/m2. In the ground layer, the light environment is mainly affected by the lighting
23
facilities, and vegetation can prevent the light from scattering up. The light environment of the
24
urban canopy layer is the brightest in the whole city space and has the largest influence on the sky
25
layer. The color concentrates in the range of yellow and red. The color temperature near the ground
26
distributes in 3000K~15000K, and near the sky distributes in 2300K~2700K which is warmer than
27
the natural night sky. The sky brightness of Dalian city is about 951 times than the natural night
28
sky.
29
30
Keywords: light environment; artificial light; natural light; function distribution; optical parameter
31
32
1. INTRODUCTION
33
Light pollution problems have become increasingly prominent with the development of city
34
modernization [1-2]. A large number of studies have found that light pollution not only seriously
35
affect the astronomical observation [3-6], but also the ecology [7-9] and human health [7, 10-11]. The light
36
pollution has become one of the city problems to be solved urgently [13]. Meanwhile, the scientific
37
ways to detect and evaluation the light pollution are the necessary condition for the study of the
38
urban light pollution and the effective measures to protect the night sky [14].
39
In the existing research results, several of the ways to observe the light pollution have been
40
devised. According to the characteristics of observation and analysis, the current methods are
41
mainly divided into two kinds, the directly measurement from the ground and the ground
42
measurement combined with satellite images [1]. Duriscoe et al (2007) applied a mosaic of CCD
43
images to assess and observe the brightness of the entire night sky over the American National Park
44
[15]. And the measurements were calibrated using images of standard stars contained within the raw
45
data. Rabaza (2010) used the CCD camera to take pictures of the urban night sky, analyzed them by
46
VBG and assessed light pollution distribution of the sky [16]. Biggs et al. (2012) treated the urban
47
business districts of Perth, Western Australia as the test center and created a quasi-random sampling
48
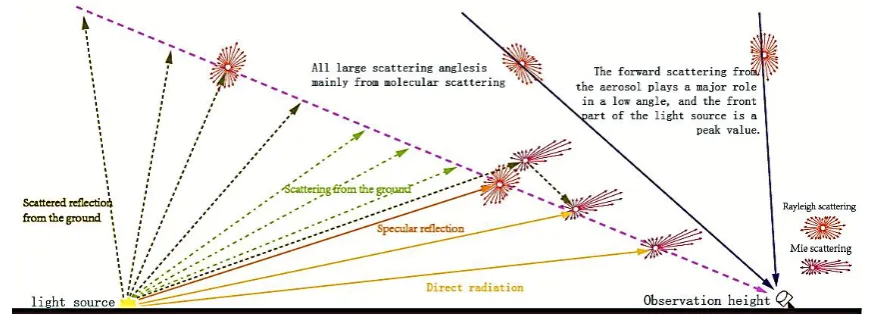
with a grid of size approximately 2.5 × 2.5 km from the urban to the suburb across Perth [17]. They
49
measured the night sky brightness with SQMs and GPS navigation system and manage data
50
obtained to draw the contours of night sky brightness. Kuechly (2012) described and mapped the
51
high resolution (1 m) mosaic image of the city of Berlin, Germany at night. They analyzed and
52
identified the major sources of the city light pollution, compared the light emission from differently
53
sized land use classes and found the dominant source of zenith directed light pollution from lighting
54
associated with streets [18]. Pun et al (2014) continuously observed the night sky of 18 districts in
55
Hong Kong over a long period of time with the Sky Quality Meter (SQM) photometers and
56
established the night sky brightness model based on the district assortments. The model exhibits the
57
night sky luminance distribution and provides the data to help the outdoor lighting designs in Hong
58
Kong [19]. Xiaoming Su established the brightness-gray model of Hohhot, Inner Mongolia through
59
combining the actual measurement on the ground with the grey-scale map of satellite image of the
60
night sky brightness over the city [20]. In addition, Pierre brunet et al captured the 360-degrees images
61
of the sky in the city at night with the CCD camera equipped with the fisheye lens. This method
62
avoids the problem of color difference caused by jointing images captured at a single time.
63
According to statistics for the studies on the city light pollution at present, it is found that they
64
are more focused on the light pollution in the single level like the night sky. However, the number of
65
studies on the changes of light environment in the vertical direction of the whole urban space is
66
relatively less. In order to study the light environment change characters of the whole city space, this
67
paper firstly captured images of the measurement area at the top of the city's high-rise building.
68
Then it respectively processed the images into a set of diagrams, including diagrams of the
69
brightness distribution, color distribution and color temperature distribution, and analyzed their
70
changing characteristics with time. Moreover, it analyzed light environment changes of each city
71
level from the transverse direction and the mutual relationship between these three levers from the
72
vertical direction. Finally, this paper shows the change characteristics of light pollution in urban
73
space and the light pollution condition of the measurement area.
74
2. THE CAUSE OF SKY GLOW AT NIGHT
75
Since the 20th century 60s, astronomers have researched the city’s light pollution through
76
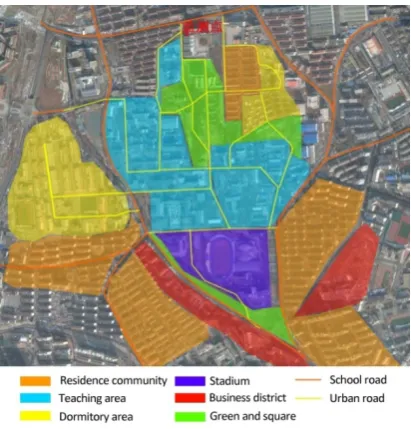
observing the night sky. In 1995, the International Dark Sky As association divided the night sky into
77
7 magnitudes based on the visibility of the stars in the sky [21–23]. According to this rank, the dimmest
78
stars only can be observed by the naked eyes in the 7th magnitude sky. In the other words, the 7th
79
magnitude sky is the most primitive dark sky. In 2001 Sky and Telescope, John Porter divided the
80
night sky into magnitude 1 to 9 by visual inspection to measure the sky glow [24–26], and thus to reflect
81
the influence of light pollution on the sky. Generally speaking, the classification of the night sky
82
provides a simplest and most direct method to evaluate the degree of light pollution in the night.
83
According to the observation of the galaxy, stars, sky color and other targets, it can be very
84
intuitively to evaluate the effects of light pollution levels on urban night sky. This method can only
85
reflect the influence of light pollution in the sky. However, the light pollution actually exists in the
86
entire city space. The night light environment is mainly made up of two parts: artificial lightning and
87
natural lighting [27–28]. But the former has more influence than the latter on the night environment at
88
present because of the development of lighting facilities [29]. In the entire city space, the light
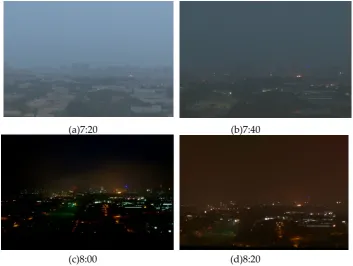
89
produced by artificial lighting affects the region outside the outdoor lighting area, due to direct
90
radiation and indirect reflection. Furthermore, the parts of these light that are diffused into sky will
91
be scattered into city again by air molecules and aerosol. Thus it cause light pollution such as sky
92
glow, as shown in Figure 1. Moreover, the longer the path length of light cross through the aerosol,
93
the more lights will be scattered.
With the deepening of the study on the city night light pollution, it is found that light
95
propagation in space is affected by the above-mentioned elements and also air particles, cloud,
96
vegetation and so on. According to the difference value of diameter size between photon and
97
molecule in the air, light scattering also is divided into Rayleigh scattering and Mie scattering. When
98
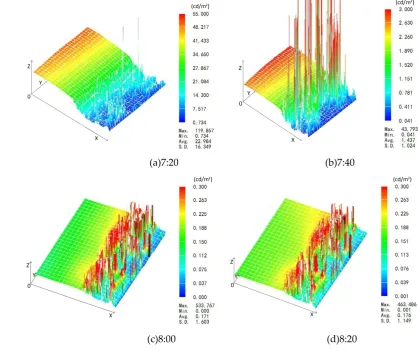
the diameter size of the molecule, is smaller than the wavelength of light, the light propagation is
99
Rayleigh scattering which is equal forward and backward scatter and caused mainly by air
100
molecules. When the diameter of the molecule is similar to or larger than the wavelength of light, it
101
is Mie scattering which is no wavelength dependence and very directional and caused by aerosols,
102
water droplets and dust. In 2001, Henrik W J presented a physically-based model of the relationship
103
between the night sky and the illumination coming from the Moon, the stars, the zodiacal light, and
104
the atmosphere, using physically-based astronomical data, both for position and radiometry [30]. In
105
2006, Baddiley C reported and analyzed the relationship between urban sky glow and the
106
atmospheric scattering in the sixth European Dark Sky Seminar [31]. He found that sky glow is a
107
phenomenon caused by upward artificial light and the light reflected by the air molecules and
108
aerosol to the sky. The atmospheric aerosol scattering (Mie scattering) take a leading role in the
109
lower atmospheric layer, while atmospheric molecular scattering (Rayleigh scattering) gradually
110
replaces it with increasing altitude. It is shown in Figure 2. Therefore, the condition of the night the
111
light environment and light pollution are different in the different levels of urban space. Based on
112
the characteristics of the light pollution, this paper is focused on the observation on the light
113
environment changes of the whole city space.
114
115
Figure 1. The propagation of urban artificial lighting in urban space
116
117
118
Figure 2. The relation between the light propagation and the observation point in the urban space
3. METHOD
120
3.1. the Measurment Object
121
This paper selected the Dalian University of Technology and its surrounding region as the
122
objects of observation for studying the night brightness changes. This region is located in the
123
southwest of Dalian. The main illuminations of this area are road lighting, square lighting,
124
commercial lighting from the vicinity as well as architectural lighting from teaching building and
125
dormitory area.. The measuring time is from 7 pm to 9 pm, July 2015, covering the changes of light
126
environment from natural lighting to artificial lighting. The weather during the observation time
127
was cloudy with a slight fog over the city. The temperature was 22 degrees and the wind speed was
128
4-5 metres per second. Three main indices have been established in this paper, luminance, color
129
temperature and chromaticity. According to the main type of light sources, the whole observation
130
period was divided into four stages. The four stages and time nodes of each are: the stage of natural
131
lighting (pm 7:20), the stage of natural lighting-artificial lighting transition (pm 7:40), the stage of
132
artificial lighting (pm 8:00) and the stage of artificial lighting stabilization (pm 8:20).
133
3.2 RESEARCH METHOD
134
This paper divided the urban light environment into the ground layer, the canopy layer and the
135
sky layer from the ground to the sky, according to the distributions and characteristics of city night
136
light sources and observation angles. In the urban ground layer, light environment is closely related
137
with artificial lighting, such as architectural lighting, street lighting, plaza lighting and commercial
138
lighting, associated closely with human health and environment of life (Figure 5). The urban canopy
139
layer, referred as the urban hollow layer also, is located in the average elevation of the rooftop of
140
buildings. The natural lighting from the sky layer and the artificial light from the ground layer make
141
up into the light environment of this layer. Besides, it is influenced by the urban lighting planning.
142
The urban sky layer also called as the zenith is influenced by natural conditions and the artificial
143
lighting environment.
144
This paper selected the highest point in the northern of the Dalian University of Technology as
145
the place of observation. It is the commanding height of the region and is located in the canopy layer.
146
Therefore, it can observe and measure the complete urban light environment containing the ground,
147
the canopy and the sky. The distribution of the main light sources and the function distribution
148
around the observation area are shown in the Figure 3 and 4.
149
This observation experiment was recorded by taking a group of photographs every 20 minute
150
with the Two-dimensional Color Brightness Meter CA-2000 with a wide-angle lens CCD. Then the
151
real images of the area were captured for the four time nodes from the stage of natural lighting to the
152
stage of artificial lighting stabilization. The images and data about luminance, chromaticity and so
153
on are quantitatively processed and analyzed with image processing software CA-S20W, so as to
154
obtain the distribution of the brightness, the chromaticity and the color temperature of the overall
155
space with the lighting environment. Finally, the paper studied the distribution characteristics and
156
mutual influence relationship of the light environment from the perspective of urban space and
157
obtained the basic distribution characteristics of light pollution in the overall space.
159
Figure 3. The distribution of the main light sources around the observation area: point 0-observation
160
point in the Dalian University of Technology; area 1-Wenhui Community; area 2- the business
161
district in Qixian Ling; area 3- Dalian Maritime University; area 4- Dalian University of Technology;
162
area 5- Dalian Light Industry School; area 6 - Xueyuan square; area 7-Heishijiao business district;
163
area 8-Residential areas like Digital Home
164
165
Figure 4. The function distribution of the Dalian University of Technology and surrounding areas
166
167
Figure 5. Schematic diagram of the three urban space layers and the observation points
4 CONSEQUENCE AND ANALYSIS
169
4.1 THE LUMINANCE CHANGE FROM GROUND TO ZENITH
170
This paper took photographs of the observation area in multiple exposures by the
171
Two-dimensional Color Brightness Meter equipped with wide-angle lens CCD and captured the real
172
images as shown in Figure 6. They exhibit respectively the actual condition of the light environment
173
for the four stages of the changes form the stage of natural lighting to the stage of artificial lighting
174
stabilization. It can be seen from the real-life images that the weather conditions and lighting
175
conditions change in the overall space of the observation area. The ground layer of the observation
176
covers schools, residential areas, plazas and green areas. It can be seen from Fig. 6(b) and (c) that the
177
light environment of the urban night sky layer is still affected by natural light before entering the
178
stage of the complete artificial lighting. When the environment of artificial lighting is stable, the
179
artificial lighting has an even worse effect on the night sky layer. At this stage, the light pollution is
180
the most serious. In addition, the light environment of the urban ground layer is related to the
181
distribution of urban functions. Architectural lighting and road lighting have the most obvious
182
impact on the surface light environment, while the regional light environment in the green area has
183
the lowest brightness due to less upward projection.
184
185
Figure 6. The real images of the observation area focused on the varies of the light environment with
186
time at four key times. The figure a shows the condition in the natural lighting environment at 7:20
187
pm, the figure b shows the mixed condition in the environment changing from natural to artificial
188
light at 7:40, the figure c shows the condition in the initial artificial lighting environment at 8:00 and
189
the figure d shows in the complete artificial lighting environment at 8:20.
190
These actual images of the entire light environment are processed into visualization of the
191
luminance with the image processing software, as shown in the Figure 7. In the three-dimensional
192
luminance distribution maps, the X axis shows the space in the vertical direction which includes the
193
night sky layer, the urban canopy layer and the ground layer in sequence from zero to the lager
194
value. The Y axis indicates the horizontal direction and its values from the zero to the lager value are
195
consistent with the actual images from left to right.
196
Through analyzing the luminance distribution maps, it is found that the urban overall spatial
197
light environment is obviously changing regularly. In the period from the natural lighting
198
(a)7:20 (b)7:40
environment at 7:20 pm to the mixed lighting environment with natural and artificial light at 7:40,
199
the light environment of the urban night sky layer and the canopy layer are mainly affected by the
200
natural lighting and the night sky layer is brighter than the canopy. With the gradual disappearance
201
of natural light and the increase of artificial light, the brightness of the urban night sky layer and the
202
canopy layer gradually increase. In addition, the brightness in the urban ground layer changes with
203
artificial lighting condition in different areas. In the artificial lighting environment of the canopy
204
layer is mainly affected by the lighting from the ground layer, and its brightness is obviously higher
205
than that of the night sky layer. In the urban ground layer, the light environment of the green area is
206
the darkest because of the less lighting facilities in the green region and the masking effect of the
207
plant on lighting. The light environment of building areas is the brightest and the brightness
208
positively correlated with the building size, building height, the external decorative lighting and the
209
open condition of indoor lighting. As the sizes of the buildings grow larger and the heights become
210
higher, the brightness of the overall urban space environment is higher and the light pollution
211
becomes worse. The brightness of the regions with the street lighting and plaza lighting is between
212
the green areas and the building areas, which is due to the masking effect of the plants.
213
214
(a)7:20 (b)7:40
215
216
(c)8:00 (d)8:20
217
Figure 7. The three dimensional luminance distribution of the light environment
218
4.2 THE LUMINANCE CHANGES IN EACH URBAN LAYER
219
By analyzing the three-dimensional distribution, it is found that the light environment of each
220
spatial level of the city has its own characteristics. Therefore, these actual images are processed into
221
the two dimension brightness visualization in the vertical direction, as shown in Figure 8. By
222
analyzing the brightness distribution maps corresponded with the actual spatial layer, it is obvious
223
that the brightness of the vertical light environment has an obvious hierarchical distribution closed
224
to the three urban layers divided in this paper. At the same time, it can be seen that there is a
225
significant mutual influence relationship between the spatial layers. For the further study, this
paper subdivided the spatial layers in the vertical direction into the five horizontal layers that are
227
respectively the urban ground layer, the canopy layer near the ground, the urban canopy layer, the
228
canopy layer near the sky and the urban night sky layer, as shown in Figure 9. Then this paper
229
made a comparison between the brightness distributions of the five horizontal layers at each
230
observation time by image processing software. As shown in Figure 10, it gets the linear
231
comparison charts of the brightness in the five horizontal sections.
232
233
(a)7:20 (b)7:40
234
235
(c)8:00 (d)8:20
236
Figure 8. The two dimensional brightness distributions of the observation area in the vertical
237
direction
238
239
240
Figure 9. The further layers subdivided in the urban vertical direction
Through comparing the brightness of these five horizontal sections at each observation time,
242
the following conclusions can be obtained.
243
1) During the entire monitoring period, it is found that the differences of luminance values
244
between each horizontal section gradually decrease with times except the obvious artificial lighting
245
areas. Eventually the luminance values of the region remain around 0.11~0.25cd/m2.
246
2) In the period of artificial lighting dominating, the urban canopy layer and as well as its
247
adjacent area have the highest luminance value and the most severe the light pollution. This is
248
because that these three layers have large numbers of the air molecules and aerosol particles and
249
intense Rayleigh scattering and Mie scattering. Therefore, this layer is the brightest in the urban
250
space.
251
3) With the degradation of the brightness of the natural background, the brightness of the light
252
environment in the urban night sky layer is gradually decreased and is susceptible to commercial
253
lighting in the distance. In the period of stable artificial lighting, the average value of the luminance
254
of the sky layer is 0.20cd/m2, closely 951 times higher than natural dark night sky ( = 2.1 x
255
10-4cd/m2).
256
4) In the urban ground layer, the vegetation has obvious masking effect on light diffusion
257
caused by artificial lighting. Therefore, the light environment of some parts of the canopy layer,
258
above the vegetated area of the ground layer, is darker than others areas of the same layer. Because
259
the light environment of the urban sky layer is affected by the whole urban lighting, the brightness
260
differences between the canopy layer and other layers are not obvious.
261
5) The light environment of the canopy layer near the sky is obviously influenced by the urban
262
canopy layer and the canopy layer near the ground and therefore has an impact on t the light
263
environment of the urban night sky layer. Since the large amounts of scattering light in the
264
canopy layer, the difference of the brightness of the night sky layer over the whole city is not
265
obvious in the same period.
266
267
(a)7:20
268
(b) 7:40
270
271
(c)8:00
272
273
(d)8:20
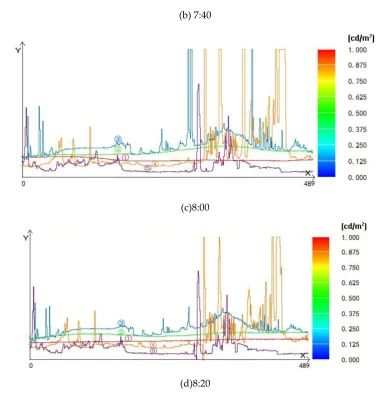
274
Figure 10. The luminance changes of the five urban space layers at four key times. As the display
275
range of luminance in (c) and (d) is between 0 cd/m2 and 1 cd/m2, so the parts more than 1cd/m2 is
276
displayed as a horizontal line.
277
As the study found, the light environment at the overall urban layers is mutually influential. In
278
order to study the influence between these five spatial layers, this paper selected a vertical cross
279
section of in the observation window, as shown in fig. 11, and compared the luminance distribution
280
variation in the vertical direction represented in the line graph, as shown in figure 12. In the Figure
281
11, the ground layer contains green areas, construction areas and road lighting. In the line graph,
282
the X-axis indicates the space from the ground to sky, and the Y-axis indicates the luminance value.
283
By analyzing the image, it is found that as the amount of artificial light increases and the
284
brightness of the natural light decreases, the brightness of the night sky descend and keep stable at
285
the end. . The light environment of the urban canopy layer is brighter than the night sky layer and
286
the area near the ground is easily influenced by building lightings. In addition, the change of the
287
light environment in the ground layer is closely related to the urban internal facilities, such as
288
architectural lighting and road lighting.
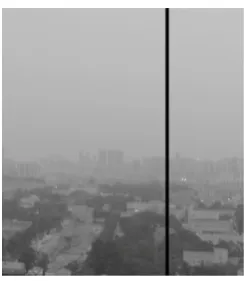
290
Figure 11. The vertical cross section of the observation region selected in the vertical direction is showed by the
291
black line in the image
292
293
Figure 12. The luminance comparison of the vertical cross section at three key times, and as the display range of
294
the luminance is between 0 cd/m2 and 2 cd/m2, so the parts more than 2 cd/m2 is displayed as a horizontal line
295
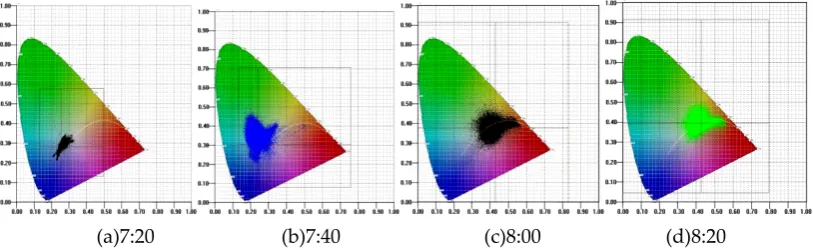
4.3 THE CHANGES OF THE CHROMATICITY DISTRIBUTION OF THE URBAN SPACE WITH TIME
296
This paper drew the chromaticity of each point in the actual images into the chromaticity
297
diagram and got the chromaticity distribution maps of the observation region in each period with
298
the image processing software, as shown in Figure 13. By comparing the images, it is found that the
299
overall light environment chromaticity value moves regularly with the change of illumination. At
300
dusk, when the sun has not disappeared, the light environment of the sky is mainly affected by
301
natural light, and the chromaticity of the region distributes intensively around the coordinate point
302
(X=0.28, Y=0.28) in the chromaticity diagram which belongs to the color region of blue and white
303
conformed to the natural condition. With the disappearance of the sunshine and the gradual
304
opening of the artificial lighting in the transitional stage from natural lighting to artificial lighting (as
305
shown in figure 13(b)), the chromaticity distributes intensively around the coordinate point (X=0.24,
306
Y= 0.32) and the chromaticity distribution of the light environment is homogeneous. In the stage of
307
completely artificial lighting, as shown in figure 13(c) and (d), chromaticity points, the color are red
308
and yellow, are concentrated in the coordinate point (X=0.44, Y=0.4) . That is because that the colors
309
of the outdoor lighting are mainly red and yellow and the red light in air have a longer propagation
310
path and less loss. In addition, it is found from the changes of the chromaticity over the period of the
311
study that the light environment is interfered by light pollution from the commercial lighting and
312
architectural lighting nearby the canopy layer.
314
(a)7:20 (b)7:40 (c)8:00 (d)8:20
315
Figure 13. The diagram of the chromaticity distributions of the observation region from the pure
316
natural lighting environment to the complete artificial lighting environment
317
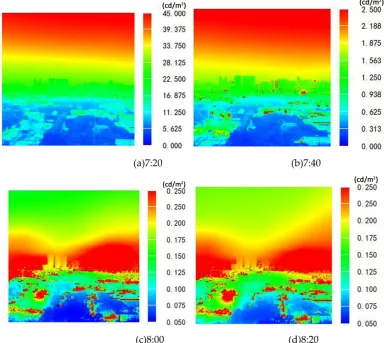
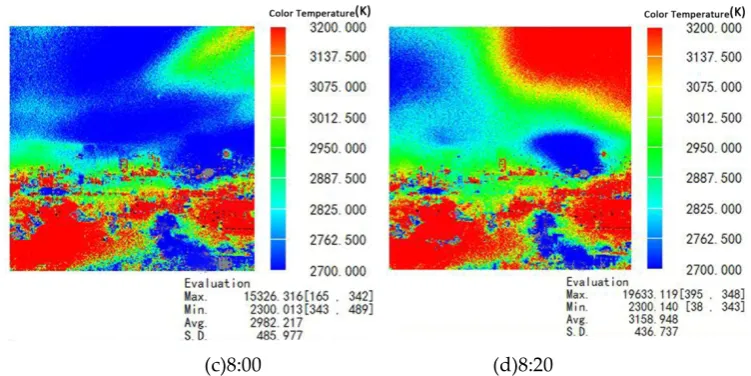
4.4 THE CHANGES OF THE COLOR TEMPERATURE IN THE WHOLE OBSERVED SPACE
318
The paper processed the color temperature distribution of the overall light environment into
319
visual color graphs, as shown in figure 14, with the software. The following findings are based on
320
these color diagrams: 1) In the stage of natural lighting and the transition from natural lighting to
321
artificial lighting, the color temperatures of the observed region distribute mainly between 9000K
322
and 20000K. The urban sky layer has the highest color temperature. Besides, the average value of
323
color temperatures is decreased gradually with the time. 2) In the light environment of artificial
324
lighting, the distribution of the color temperatures is concentrated between 2700K and 3200K. In
325
detail, the color temperatures of the ground layer are distributed between 3000K and 15000K, the
326
color temperatures of the canopy layer and sky layer are between 2300K and 2700K and the actual
327
color temperature of the night sky is warmer than the natural night sky which is 2725K. 3)
328
Distributions of air particulate matters and clouds have an impact on the color temperature of the
329
sky. From figure14 (c) and (d), it is shown that the color temperature values of the sky in the cloud
330
area are near the values of the ground when clouds appear in the sky. Therefore, it is found that air
331
particulate matters and clouds over the city will enhance the influence urban artificial lighting on
332
the night sky. But the specific impact conditions need a further study.
333
334
(a)7:20 (b)7:40
336
(c)8:00 (d)8:20
337
Figure 14. The images of the color temperature distribution in the whole observation region from the
338
pure natural lighting environment to the complete artificial lighting environment
339
5 CONCLUSIONS
340
This paper studied the changes of the light environment of each urban spatial layer in the
341
horizontal direction and the relationship of the light environment in the whole urban space in the
342
vertical direction, through observing the whole urban space. These studies can provide help to the
343
studies on the representation and evaluation of light pollution in urban space. In addition, it makes
344
visualization representation of optical parameters of the light environment in urban space, such as
345
luminance, color temperature and chromaticity, by the color images with the two-dimensional color
346
luminance meter and image processing software. These methods provide certain reference values
347
for visualization of light pollution. Through these series of studies, this paper gets the below
348
conclusions. Furthermore, it is needed to further study on the effects of cloud and particle on light
349
propagation and the visualization of light pollution.
350
1) The luminance difference between the three urban spatial layers gradually reduces with the
351
night time. The brightness values of the whole urban light environment finally maintain between
352
0.11 cd/m2 and 0.25cd/m2 except those excessive artificial lighting region. The light environment of
353
the urban canopy layer is the brightest of the overall urban space and light pollution in this layer is
354
serious. The average luminance value of the urban night sky layer is 0.20cd/m2 and more 952 times
355
than natural dark night sky (= 2.1×10⁻⁴cd/m2).
356
2) The overall chromaticity distribution region of the city moves gradually from the blue and
357
white region to the red and yellow region with the time from dusk with pure natural light to night
358
with completely artificial lighting. The whole color temperature is decreased sharply and
359
concentrated on the range of 2700K and 3200K in the stage of completely artificial lighting. The color
360
temperature of the sky layer distributes in the higher scope between 3000K~15000K and the color
361
temperature distributes of the ground layer in the lower scope between 2300K~2700K. The actual
362
color temperature of the observed region is warmer than the natural dark night sky.
363
3) In the urban ground layer, vegetation has an obvious masking effect on direct light and
364
scattering effect from lighting facilities. In the canopy layer, shielding effects are almost non-existent.
365
Therefore, the light environment of this layer is influenced not only by the ground layer but also by
366
the night sky layer.
367
4) The change of air pollutants and clouds can affect and aggravate light pollution.
368
Author Contributions: Conceptualization, Ming Liu; Methodology, Baogang Zhang; Software, Qingli Hao;
369
Validation, Qingli Hao, Xiaowei Guo and Weishan Li; Formal Analysis, Qingli Hao and Xiaowei Guo;
370
Investigation, Qingli Hao; Resources, Xiaowei Guo; Data Curation, Qingli Hao; Writing-Original Draft
371
Preparation, Qingli Hao; Writing-Review & Editing, Qingli Hao and Xiaowei Guo; Visualization, Qingli Hao
372
and Xiaowei Guo.
Funding: This research was funded by [The National Natural Science Foundation of China] grant number
374
[Project No. 51678103] and [the National Science & Technology Pillar Component from the 12th Five-year Plan
375
Period] grant number [Project No. 2012BAC05B01].
376
Conflicts of Interest: The authors declare no conflict of interest.
References
379
1. Liu, M.; Zhang, B.G.; Li, W.S.; Guo, X.W.; Pan, X.H. Measurement and distribution of urban light pollution
380
as day changes to night. Light. Res. Technol. 2017.
381
2. Touitou, Y.; Reinberg, A.; Touitou, D. Association between light at night, melatonin secretion, sleep
382
deprivation, and the internal clock: Health impacts and mechanisms of circadian disruption. Life Sci 2017,
383
193, 94–106.
384
3. Joseph, J.H.; Kaufman, Y.J.; & Mekler, Y. Urban light pollution: the effect of atmospheric aerosols on
385
astronomical observations at night. Applied Optics 1991, 30(21), 3047.
386
4. Luginbuhl, C.B.; Walker, C.E.; & Wainscoat, R.J. Lighting and astronomy. Physics Today 2009, 62(12), 32-37.
387
5. Barclay, C. Back to basics: naked-eye astronomical observation. Physics Education 2003, 38(5), 423-428.
388
6. Sullivan, W. T. Earth at Night: An Image of the Nighttime Earth Based on Cloud-Free Satellite
389
Photographs. International Astronomical Union Colloquium 2016 (Vol.112). Cambridge University Press.
390
7. Jedidi, H.; Depierreux, F.; Jedidi, Z.; & Beckers, A.. [light pollution. a connection between ecology and
391
health]. Revue Médicale De Liège 2015, 70(11), 557.
392
8. Longcore, T.; & Rich, C. Ecological light pollution. Frontiers in Ecology & the Environment 2004, 2(4), 191-198.
393
9. Gaston, K.J.; Bennie, J.; Davies, T.W.; & Hopkins, J. The ecological impacts of nighttime light pollution: a
394
mechanistic appraisal. Biological Reviews 2013, 88(4), 912-927.
395
10. Falchi, F.; Cinzano, P.; Elvidge, C.D.; Keith, D.M.; & Haim, A. Limiting the impact of light pollution on
396
human health, environment and stellar visibility. Journal of Environmental Management 2011, 92(10),
397
2714-2722.
398
11. Nie, D.; Dongyi, L.I.; & Yang, Z. The research of effects on human health by light pollution and the indoor
399
and outdoor prevention measures. Light & Lighting 2017.
400
12. Pun, C.S.; & So, C.W. Night-sky brightness monitoring in hong kong: a city-wide light pollution
401
assessment. Environmental Monitoring & Assessment 2012, 184(4), 2537-2557.
402
13. Riddle, R.L.; Walker, D.; Schöck, M.; Els, S.G.; Skidmore, W.; & Travouillon, T.; et al. An analysis of light
403
pollution at the Thirty Meter Telescope candidate sites. Ground-based and Airborne Telescopes II 2008
404
(Vol.7012, pp.701223-701223-12). International Society for Optics and Photonics.
405
14. Upgren, A.R. The Measure of Light Pollution and the Populations of Cities. International Astronomical
406
Union Colloquium 2016 (Vol.112, pp.79-84). Cambridge University Press.
407
15. Dan, M.D; Christian, B; Luginbuhl, & Chadwick, A.M. Measuring night-sky brightness with a wide-field
408
ccd camera. Publications of the Astronomical Society of the Pacific 2007, 119(852), 192-213.
409
16. Rabaza, O.; Galadí-Enríquez, D.; Estrella, A.E.; & Dols, F.A. All-sky brightness monitoring of light
410
pollution with astronomical methods. Journal of Environmental Management 2010, 91(6), 1278-1287.
411
17. Biggs, J. D.; Fouché, T.; Bilki, F.; & Zadnik, M.G. Measuring and mapping the night sky brightness of perth,
412
western australia. Monthly Notices of the Royal Astronomical Society 2012, 421(2), 1450-1464.
413
18. Kuechly, H.U.; Kyba, C.C. M.; Ruhtz, T.; Lindemann, C.; Wolter, C.; & Fischer, J.; et al. Aerial survey and
414
spatial analysis of sources of light pollution in berlin, germany. Remote Sensing of Environment 2012,
415
126(11), 39-50.
416
19. Pun, C.S.J.; Chu, W.S.; Leung, W.Y.; & Wong, C.F. Contributions of artificial lighting sources on light
417
pollution in hong kong measured through a night sky brightness monitoring network. Journal of
418
Quantitative Spectroscopy & Radiative Transfer 2014, 139(5), 90-108.
419
20. Su, X.M.; Hao, Z.G.; Zhang, M.Y. Measure of Night-sky Light Pollution in Hohhot. China Illuminating
420
Engineering Journal 2015, 26(4), 124-128.
421
21. Kyba, C.C.; Wagner, J.M.; Kuechly, H.U.; Walker, C.E.; Elvidge, C.D.; & Falchi, F.; et al. Citizen science
422
provides valuable data for monitoring global night sky luminance. Scientific Reports 2013, 3(7449), 1835.
423
22. Cinzano, P. Inquinamento luminoso e protezione del cielo notturno [light pollution and protection of the
424
night sky]. 2017.
425
23. Posch, T.; Binder, F.; & Puschnig, J. Systematic measurements of the night sky brightness at 26 locations in
426
eastern austria. Journal of Quantitative Spectroscopy & Radiative Transfer 2018, 211.
427
24. Bortle, J.E. Introducing the Bortle Dark-Sky Scale. Sky & Telescope 2001, 101(2): 126-129.
428
25. Gronkowski, P; Tralle, I; Wesołowski, M.Visibility of comets during their outbursts and the night sky light
429
pollution—Use the Bortle scale. Astronomische Nachrichten 2017.
430
26. Cinzano, P; Falchi, F; Elvidge, C.D. The first World Atlas of the artificial night sky brightness. Monthly
431
Notices of the Royal Astronomical Society 2010, 328(3),689-707.
27. Fabio, F.; Pierantonio, C.; Dan, D.; Kyba, C.C.M.; Elvidge, C.D.; & Kimberly, B.; et al. The new world atlas
433
of artificial night sky brightness. Science Advances, 2(6), e1600377-e1600377.
434
28. Pun, C.S.J.; Chu, W.S.; Leung, W.Y.; & Wong, C.F. Contributions of artificial lighting sources on light
435
pollution in hong kong measured through a night sky brightness monitoring network. Journal of
436
Quantitative Spectroscopy & Radiative Transfer, 139(5), 90-108.
437
29. Cinzano, P.; Falchi, F.; Elvidge, C.D.; & Baugh. K. E. The artificial sky brightness in europe derived from
438
dmsp satellite data. Physics, 196, 95--102.
439
30. Jensen, H. W., Durand, F., Dorsey, J., Stark, M. M., Shirley, P., & Premože, S. A physically-based night sky
440
model. Conference on Computer Graphics and Interactive Techniques 2001 (pp.399-408). DBLP.
441
31. Baddiley, C. Towards sky luminance based road lighting standards, In: 6th European Dark Skies
442
Symposium presentations, Portsmouth: British Astronomical Association, 2006.