© 2013, IJCSMC All Rights Reserved 153
Available Online at www.ijcsmc.com
International Journal of Computer Science and Mobile Computing
A Monthly Journal of Computer Science and Information Technology
ISSN 2320–088X
IJCSMC, Vol. 2, Issue. 9, September 2013, pg.153 – 159
RESEARCH ARTICLE
HYBRID ENSEMBLE GENE SELECTION
ALGORITHM FOR IDENTIFYING
BIOMARKERS FROM BREAST CANCER
GENE EXPRESSION PROFILES
D
R.
S.
A
RUNA1,
D
R.
L.V.
N
ANDAKISHORE21
Assistant Professor, Dept of Computer Science, A.M Jain College, Meenambakkam, Chennai-114. 2
Professor, Dept of Mathematics, Dr. MGR Educational and Research Institute University, Chennai-95. Email: 1 [email protected], 2 [email protected]
_____________________________________________________________________________________________
ABSTRACT
Breast cancer is one of the major health hazard in the world. DNA gene expression profiles plays an important role in identifying the biomarkers for cancer which not only help in accurate diagnosis of the disease, also in discovering drugs, minimizing the toxicity thus help in the effective management of the disease. In this paper we propose an algorithm for determining the biomarkers. Our hybrid ensemble gene selection algorithm was experimented over breast cancer gene expression data of 24481 genes. The algorithm selected a marker gene subset of eight genes with an accuracy and BER of 96.9% and 0.033 respectively.
Keywords: Ada boost; Correlated feature selection; Filters; Gene expression profiles; Sequential floating search algorithms; Support vector machines; Wrappers
_____________________________________________________________________________________________
1.0 INTRODUCTION
Breast malignancy is one of the most common cancers among women and represents a significant worry for many
women and their physicians [1]. There has been a steady rise in the number of patients suffering from breast cancer.
An important factor in this disease is the early detection and accurate diagnosis. During the last decade with the development of more effective diagnostic techniques and improvements in treatment methodologies, breast cancer outcomes have improved. The long-term survival rate for women with breast cancer is improved by detecting the disease in its early stage [2].
© 2013, IJCSMC All Rights Reserved 154
Microarray-based gene expression profiling has highlighted the existence of breast cancer sub-types with distinct biology and clinical behavior [5].
The advent of microarray technology has allowed the simultaneous monitoring of thousands of genes, which motivated the development in cancer classification using gene expression data [6]. But, many of these genes are irrelevant to the distinction between tumor and normal tissues or identification of different sub-types of the cancers. Recent researches [7] have shown that a small number of genes are enough for accurate diagnosis of most of the diseases, even though the number of genes varies greatly between different diseases.
Gene selection algorithms play an important role in selecting genes having high biological relevance. They are divided into two main categories: the filter and the wrapper methods based on the evaluation criteria [8] . Filters make use of an independent search criterion to find the appropriate feature subset before a machine learning algorithm is performed, thus it was termed as a filter method [9]. Wrapper methods use a classification algorithm to find out the suitable attributes subset. Filters are fast and wrappers have high classification accuracy. To combine the advantages of both methods we propose a hybrid algorithm to select predictive genes.
In this paper we propose a Hybrid Ensemble Gene Selection (HEGS) algorithm. This algorithm combines pertinent filters and wrappers for selecting biomarkers from micro array gene expression data. Correlation feature selection (CFS) with gene ranking acts as filters to remove redundant and irrelevant genes. Sequential floating forward search (SFFS) acts as the wrapper with the Adaboost technique of the ensemble approach and support vector machine (SVM) poly kernel as learning algorithm to identify the marker genes. Breast cancer gene expression profiles having 24481 genes are used for the experiment. The rest of the paper is organized as follows. Section 2.0 explains the HEGS algorithm. Section 3.0 gives the results obtained and concluding remarks are given in Section 4.0 to address further research issues.
2.0 HEGS ALGORITHM
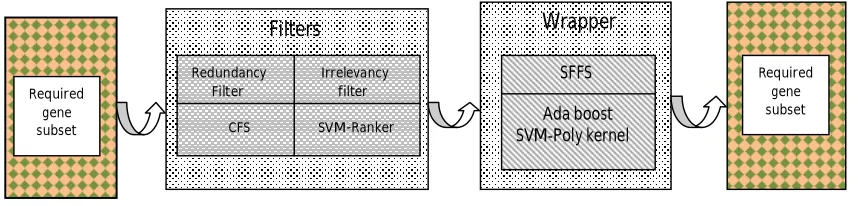
Hegs algorithm is a greedy algorithm based on the best first search approach. It is a hybrid algorithm which combines two filters and a wrapper. Figure 1 shows the Hegs algorithm.
Figure 1 HEGS algorithm
The goal of our research is to design an algorithm to identify a minimal gene subset of biomarker genes which can retain the relevant information to distinguish between relapse and non relapse samples. Among the genes in the micro array gene expression data there may be redundant or irrelevant genes causing over fitting, noise and classification errors. They increase the complexity of the classifiers. Redundant genes have a high inter correlation and follow the same DNA path. CFS [10] is used initially to filter mutually correlated genes thus act as a redundant filter. The importance of the remaining genes is analyzed by calculating gene weights using SVM gene ranker. Thus SVM gene ranker acts as an irrelevancy filter. Then biologically relevant genes are selected by SFFS with boosting technique Adaboost and SVM - poly kernel as base classifier. Boosting is a general technique for improving performance of any given classifier [11]. It was first introduced by Freund & Schapire with their AdaBoost algorithm [12]. SVM is a class of learning algorithms which are based on the principle of structural risk minimization (SRM) [13]. The kernels can be regarded as generalized dot products [14]. SVM has a number of advanced properties, including the ability to handle large feature space, effective avoidance of over fitting, and information condensing for the given data set. Etc.. [15]. Adaboost and SVM proved to be a successful combination in many applications [16] For evaluating the worth of the gene by SFFS we used Balanced error rate (BER). The average of the error rates of the positive and negative classes gives the BER [17].
Filters
Redundancy Irrelevancy Filter filter
CFS SVM-Ranker
Wrapper
SFFS
Ada boost SVM-Poly kernel
Required gene
subset Required
© 2013, IJCSMC All Rights Reserved 155 The sequence of steps in the Hegs algorithm is as follows.
Input: Micro array gene expression data M. Output: A gene subset of biomarkers F.
Step 1: Calculation of correlation coefficients for all genes in M.
Step 2: Selection of a gene subset G from M which has high class correlation coefficients and low inter correlation coefficients.
Step 3: Calculation of weights of all the genes in G.
Step 4: Rank the selected genes in G by squaring the gene weights.
Step 5: Push all the genes in G into stack S according to the gene rank calculated in Step 4 such that genes with highest rank will be on the top of the stack.
Step 6: Pop a gene from stack S and push into stack F.
Step 7: Build a predictor model with genes in stack F using adaboost with the SVM - poly kernel as base classifier. Step 8: Prediction of class labels for all the instances using the model built in Step 7.
Step 9: Calculate the BER for the predictions made in Step 8.
Step 10: Do steps 6-9 until current BER is not more than previous BER and stack S not empty. Step 11: If current BER is more than previous BER pop a gene from stack F.
Step 12: The genes in stack F is the required gene subset.
To begin with Correlation coefficients for all the genes in micro array gene expression data M are computed using equation 1 where C is the correlation between the summed gene subset and the class variable, n is the number of subset genes, ACC is the average of the correlations between the gene subset and the class variable, and AIC is the average inter-correlation between gene subset. Gene subset G having high class correlation and low inter correlation coefficients is selected.
C =
( ) [1]
Then the weight of every gene W(g) in G is calculated using equation 2 where gi(t) is the value of the tth gene of the ith instance, yi is the class variable of ith instance,
W (g) = ∑ ( ) [2]
Genes are ranked by the square of the weights assigned by the SVM gene ranker. Finally SFFS is used to select the required candidate gene subset using Adaboost with SVM – Polykernel as the base classifier. The algorithm terminates when the BER increases or stack S becomes empty.
3.0 RESULTS
Experiments were conducted in WEKA [18] Java based data mining tool with 10 fold cross validation. Cross validation is a well-established technique used to optimize the parameters or features chosen in a classifier [19].
3.1 Dataset description
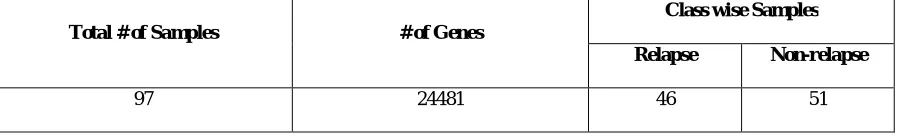
Breast cancer gene expression profile obtained from the Kent ridge biomedical repository [20] is used for the experiment. To improve the performance of the classifier unbiased random re sampling is done. There are 97 instances in the database of which 46 are from patients who had developed metastases within 5 years and 51 are from patients who remained healthy from the disease after initial diagnosis for an interval of at least 5 years. Table 1 gives details about the breast cancer data set.
Table 1. Breast cancer data set
Total # of Samples # of Genes
Class wise Samples
Relapse Non-relapse
© 2013, IJCSMC All Rights Reserved 156
3.2 Gene selection
Among 24481 genes after filtering redundant genes CFS selected 134 genes. The total number of subsets evaluated by best first search criterion are 50116. Merit of the best subset found is 0.764. The main parameter values used for ranking the genes by the SVM gene ranker are reported in Table 2. Table 3 shows the parameters used for SVM-poly kernel classifier with Ada boost. Table 4 shows the gene accession number (GAN) and the description of the marker gene subset selected by the algorithm having biological relevance to breast cancer. Precision, Recall, Accuracy, Mean absolute error (MAE), Root mean squared error (RMSE), Area under ROC (AUC), BER for gene subset selected by Hegs algorithm are shown in table 5.
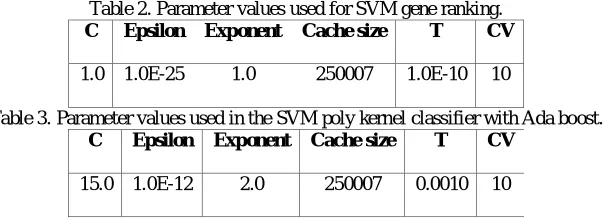
Table 2. Parameter values used for SVM gene ranking.
C Epsilon Exponent Cache size T CV
1.0 1.0E-25 1.0 250007 1.0E-10 10
Table 3. Parameter values used in the SVM poly kernel classifier with Ada boost.
C Epsilon Exponent Cache size T CV
15.0 1.0E-12 2.0 250007 0.0010 10
Table 4. Gene accession number and description of predictive genes selected by Hegs algorithm
GAN Description
AL080059 Homo sapiens mRNA [1]
NM_013438 Homo sapiens ubiquilin 1 [2]
D13540 Homo sapiens cysteine rich protein (CRP) gene, exons 5,6 [3]
AF055033 Human 20-KDa myosin light chain (MLC-2) mRNA
NM_002336 NiB Homo apiens cDNA clone image: mRNA sequence
Contig412_RC Homo sapiens KiAA0026 mRNA
NM_000913 Homo sapiens opiate receptor-like 1 (OPRL1), transcript variant 2, mRNA.
Contig26768_RC Homo sapiens mRNA
Table 5. Performance results for Hegs algorithm
Precision Recall Accuracy MAE RMSE AUC BER
© 2013, IJCSMC All Rights Reserved 157
Figure 3 shows the ROC for Relapse and Non relapse classes of breast cancer samples using the gene subset selected by Hegs algorithm. Receiver Operating Characteristic (ROC) analysis originated in electrical engineering in the early 1950's where the technique was developed to assess the performance of signal detection devices (receivers) and later spread into other fields, finding useful applications in both psychology and medical diagnosis [21].
Figure 3 Roc for relapse and non relapse classes for hegs algorithm
3.3 Related work
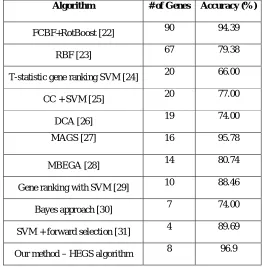
Classification accuracies of the hegs algorithm and some studies for breast cancer data set from literatures are summarized in Table 6. In [22] authors used fast correlation based filter method with rot boost constructed by combining rotation forest and Ada boost. They achieved a mean accuracy of 94.39% for 90 genes. In [23] authors used redundancy based feature (RBF) selection algorithm for selecting marker genes. The RBF algorithm selected 67 genes and obtained a classification accuracy of 79.38%. Li et al [24] used t-statistic gene ranking with SVM and selected 20 genes . They obtained a classification accuracy of 66%. In [25] Hong Hu et al used correlation coefficients (CC) for selecting 20 genes. The classification accuracy obtained for SVM is 77%. Sharma et al [26] used differences of convex function (DCA) algorithm for gene selection. For 19 genes they obtained a classification accuracy of 74%. In [27] authors used a memetic algorithm for gene selection (MAGS) and obtained a classification accuracy of 95.78%. In [28] Zhu et al used Markov blanket-embedded genetic algorithm (MBEGA) for gene selection. The algorithm achieved a classification accuracy of 80.74%. The authors [29] used gene ranking with SVM and selected ten top ranked genes for an accuracy of 88.46%. In [30] authors used a gene selection algorithm with Bayes approach for selecting seven marker genes and obtained a classification accuracy of 74%. Peng et al. [31] used forward selection together with support vector machines for selecting marker genes. For four marker genes they obtained a classification accuracy of 89.69%.
Table 6. Performance comparison of our method with other approaches to breast cancer data set
Algorithm # of Genes Accuracy (%)
FCBF+RotBoost [22] 90 94.39
RBF [23] 67 79.38
T-statistic gene ranking SVM [24] 20 66.00
CC + SVM [25] 20 77.00
DCA [26] 19 74.00
MAGS [27] 16 95.78
MBEGA [28] 14 80.74
Gene ranking with SVM [29] 10 88.46
Bayes approach [30] 7 74.00
SVM + forward selection [31] 4 89.69
© 2013, IJCSMC All Rights Reserved 158
4.0 CONCLUSION
Biomarker identification from DNA micro array data is one of the major research area in medical domain. It is a challenging task because of the high dimension (thousand of genes) and low amount of samples (less than hundred). In this paper we propose a hybrid ensemble gene selection algorithm (HEGS) to select biomarkers from gene expression profile. This algorithm is a combination of filters and wrappers. Correlation feature selection with ranking by support vector machines acts as filters. Sequential floating forward search and Adaboost with SVM poly kernel as base classifier acts as wrappers. The algorithm was experimented over breast cancer gene expression data obtained from Kent ridge biomedical repository having 24481 genes of 97 samples. The experiments are conducted in WEKA with 10 fold cross validation. Balanced error rate (BER) is used as an evaluating criterion for calculating the merit of the genes. The hegs algorithm identified eight marker genes yielding a classification accuracy, BER of 96.9% and 0.033 respectively. In the present work the Hegs algorithm is used for detecting the relapse and non relapse of breast cancer. The future work will be concentrated in classifying different molecular sub types of breast cancers’. Different types of ensemble approaches with various base classifiers will be compared with the present algorithm which will provide a broader experimental evaluation of the algorithm and help in further enhancement of the algorithm.
REFERENCES
[1] A. R. Razavi, H. Gill, H. Åhlfeld, N. Shahsavar,”Predicting metastasis in breast cancer: comparing a decision tree with domain”,Experts. J. Med. Syst, Vol 31, 2007, pp 263-273.
[2] H. Brenner, “Long-term survival rates of cancer patients achieved by the end of the 20th century: a period analysis”, Lancet. Vol 360, 2002, pp 1131-1135.
[3] A. Azuaje, “Interpretation of genome expression patterns: computational challenges and opportunities”, IEEE Engineering in Medicine and Biology, 2000.
[4] A. L. Tarca, V. J. Carey, X. W. Chen, R. Romero, S. Draghici,”Machine learning and its applications to biology”,Plos Comput Biol, Vol 3, 2007.
[5] B. Weigelt, F. L. Baehner, J. S. Reis-Filho, “The contribution of gene expression profiling to breast cancer classification, prognostication and prediction: A retrospective of the last decade”, J Pathol, Vol 220,2010, pp 263-280.
[6] S. Lakhani, A. Ashworth, “Microarray and histo pathological analysis of tumors: the future the past”, Nature Reviews Cancer, Vol 1, 2001, pp 151-157.
[7] Y. Saeys, I. Inza, P. Larranaga, “A review of feature selection techniques in bioinformatics”, Bioinformatics, Vol 23, 2007, pp.2507-2517.
[8] L. Talavera, "An evaluation of filter and wrapper methods for feature selection in categorical clustering", Proceedings of 6th international symposium on intelligent data analysis, Madrid, Spain, 2005, pp. 440-445.
[9] Fabrizio sebastiani,”Machine learning in automated text categorization”, ACM computing surveys, Vol 3, 20024, pp 1-47.
[10] Isabelle Guyon, Andr Elisseeff, “An Introduction to Variable and Feature Selection”, Journal of Machine Learning Research, Vol 3, 2003, pp.1157-1182.
[11] R. E. Schapire, “A Brief Introduction to Boosting”, Proceedings of the Sixteenth International Joint Conference on Artificial Intelligence, 1999.
[12] Yoav Freund, R. E. Schapire. "A Decision-Theoretic Generalization of On-Line Learning and an Application to Boosting”, Journal of computer and system sciences, Vol 55,1997, pp 119-139.
[13] V. N. Vapnik, “Statistical Learning Theory”, New York: Wiley, 1998
[14] Bernhard Schölkopf, Alex Smola, “Learning with kernels”, MIT Press, Cambridge, MA
[15] You et al, “A semi-supervised learning approach to predict synthetic genetic interactions by
Combining functional and topological properties of functional gene network”, BMC Bioinformatics, Vol 11, 2012.
© 2013, IJCSMC All Rights Reserved 159
[17] I. Guyon, G. Cawley, G. Dror, A. Safari, “Hands-on Pattern Recognition: Challenges in Machine Learning”, Microtome Publishing Brookline, Massachusetts, Vol 1, 2011.
[18] Weka: A multi-task machine learning software (http://www.cs.waikato.ac.nz/ml/weka)
[19] K. Y. Yeung, R. E. Bumgarner, “Multiclass classification of microarray data with repeated measurements: application to cancer”, Genome Biology, Vol 4, 2003.
[20] http://datam.i2r.astar.edu.sg/datasets/krbd
[21] T. Fawcett,” ROC Graphs: Note and Practical Considerations for Data Mining Researchers”, HP Labs Technical Report, 2003.
[22] Fatemeh Aminzadeh, Bita Shadgar1, Alireza Osareh,” A robust model for gene analysis and classification”, The International Journal of Multimedia & Its Applications (IJMA), Vol.3, 2011, pp 11-20.
[23] Lei Yu, Huan Liu,” Redundancy Based Feature Selection for Microarray Data”,In Proceedings of the tenth ACM SIGKDD international conference on Knowledge discovery and data mining, 2004, pp 737-742.
[24] Guo-Zheng Li; Xue-Qiang Zeng Jack Y. Yang Mary Qu Yang,” Partial least squares based dimension reduction with gene selection for tumor classification”, In Proceedings of the 7th IEEE International Conference on Bioinformatics and Bioengineering. 2007, pp. 1439-1444.
[25] Hong Hu, Jiuyong Li, Hua Wang, Grant Daggard,” Combined Gene Selection Methods for Microarray Data Analysis”, Knowledge-Based Intelligent Information and Engineering Systems; Springer-Verlag Berlin Heidelberg, 2006, pp. 976-983.
[26] Thi, V.V. Nguyen, S. Ouchani,” Gene selection for cancer classification using DCA”, Adv.Data Min. Applications, Vol 5139, 2008, pp 62-72.
[27] Béatrice Duval, Jin-Kao Hao, Jose Crispin Hernandez,“A memetic algorithm for gene selection and molecular classification of cancer”, Genetic and Evolutionary Computation Conference. GECCO 2009.
[28] Z. Zhu, Y.S. Ong, M. Dash,” Markov blanket-embedded genetic algorithm for gene selection”, Pattern Recognition, Vol 40, 2007, pp 3236-3248.
[29] H. John, F Chang. Quo, Kejiao Guo, Weimin Feng, Geoffrey Wang, D May, H. Wallace Coulter,” Development of a Knowledge-based Multi-scheme Cancer Microarray Data Analysis System”, Proceedings of the IEEE Computational Systems Bioinformatics Conference (CSB 2004).
[30] K. Alok Sharma, K. Kuldip, Paliwal,” A Gene Selection Algorithm using Bayesian Classification Approach”, American Journal of Applied Sciences, Vol 9, 2012, pp 127-131.