Developing Learning Analytics Design Knowledge in
the “Middle Space”: The Student Tuning Model and
Align Design Framework for Learning Analytics Use
Alyssa Friend Wise, Jovita Maria Vytasek, Simone Hausknecht and Yuting Zhao Simon Fraser University
Abstract: This paper addresses a relatively unexplored area in the field of learning analytics: how analytics are taken up and used as part of teaching and learning processes. Initial steps are taken towards developing design knowledge for this “middle space,” with a focus on students as analytics users. First, a core set of challenges for analytics use identified in the literature are compiled. Then, a process model is presented for conceptualizing students’ learning analytics use as part of a self-regulatory cycle of grounding, goal-setting, action and reflection—the Student Tuning Model. Finally, the Align Design Framework is presented with initial validation as a tool for pedagogical design that addresses the identified challenges and supports students’ use of analytics as part of the tuning process. Together, the framework’s four interconnected principles of Integration, Agency, Reference Frame and Dialogue / Audience provide a useful starting point for further inquiry into well-designed learning analytics implementations.
Introduction
Information derives its importance from the possibilities of action (Postman, 1985, p68)
This paper addresses a relatively unexplored area in the field of learning analytics: how analytics are taken up and used as part of teaching and learning processes. Initial work in learning analytics has focused on how to capture, process, and present large quantities of data to educational stakeholders in useful ways (Verbert, Duval, Klerkx, Govaerts, & Santos, 2013; Romero & Ventura, 2013; Baker & Inventado, 2014). The result has been the development of a set of increasingly sophisticated tools for monitoring, predicting and, in some cases, assessing student activity (M'hammed, Abdous, & Yen, 2012; Greller & Drachsler, 2012; Verbert, et al. 2014; Vatrapu, Teplovs, & Fujita, 2011) as well as systems that make recommendations based on the data collected (Manouselis, Drachsler, Vuorikari, Hummel, &
Koper, 2011). However, the creation of these analytics is only half of the endeavor; in order for the data to actually influence learning process, these analytic outputs need to become inputs into subsequent decision-making (Clow, 2013). This latter activity of using learning analytics to inform choices and subsequent action in-situ is the focus of this article.
The study of how learning analytics are taken up and used in practice is important because this activity is decidedly non-trivial. History shows that the use of educational innovations (and designed objects more generally) is never fully determined by the form of the technologies themselves. Rather it is dynamically shaped by the affordances of the new tools in combination with the needs and abilities of the users and the constraints of the situations into which they are placed (Cuban, 1986, 2001; Gibson, 1977; Norman, 2013). Thus it is important to develop robust conceptualizations of the processes by which different users (policy makers, administrators, designers, instructor, students) can work with learning analytics in their particular contexts of action. In particular, consideration of the interplay of analytics in the relationship between teachers, students and learning environment addresses a very practical need: if instructors don’t see how learning analytics can become a productive part of their classroom practices, they will use them only in an ancillary role, if at all. Conversely, through analytics, students, teachers and others have the potential to receive new forms of feedback as part of their educational practice. This feedback can be used to engage in new activities related to tracing progress and reflecting on the learning process, in both summative and formative ways, individually and as a group (Visser, Plomp, Amirault, & Kuiper, 2002; Macfadyen & Dawson, 2010). Without thoughtful design to encourage and shape analytics usage, these potential benefits will be lost.
This paper takes initial steps towards developing design knowledge for this “middle space,” between analytics data presentation and action based on the analytics, with a focus on the case of students as analytics users. We begin by compiling a core set of challenges for analytics use from the literature. We then present a process model for conceptualizing students’ learning analytics use as part of a self-regulatory cycle: The Student Tuning Model. Finally, we propose and conduct initial validation of a set of principles for pedagogical design that addresses the identified challenges and supports students’ use of analytics as part of the tuning process: The Align Design Framework.
Literature Review
Context in the Field
As the field of learning analytics matures, the experiences and needs of educational actors (teachers, students, designers, administrators) who use analytics in their practice are emerging as important areas for research. The set of existing frameworks for learning analytics takes a decidedly researcher / developer viewpoint. For example, the commonly cited Campbell and Oblinger (2007) five-step model of learning analytics (Capture, Report, Predict, Act, Refine) is heavily focused on how to work with data, with the action in step four happening as an external intervention into the regular operations of the teaching and learning system. Chatti and colleagues (2012) take a step towards considering the eventual context of analytics use by introducing four sensitizing questions (What kind of data is used? Who is the target of the analysis? Why is the data being collected? How does the system perform the analysis?) but these questions are still meant to inform the design of the analytics system by the developers.
Clow (2013) proposes some initial steps towards thinking about a model of learning analytics use by highlighting the importance of “closing the loop” and considering the potential impact on the learners who initially generated the data. Specifically, drawing on the theories of Schön (1983) and Kolb (1984), he suggests that learning analytics use can be productively thought of as part of a reflective practice cycle in which the information provides feedback on the teaching and learning activities that can be used to
adjust or experiment with changes in these activities. He also goes a step further to expand the notion of reflective practice as an individual activity to one in which analytics can facilitate conversation between teachers and students. A similar notion of analytics as part of reflective practice has been proposed by Brooks et al. (2014) in their “data-assisted approach to building technology-enhanced learning environments” (p. 123). This work is useful in providing a general theoretical framing for learning analytics use; however, a specific vision of what the learning-analytics reflective practice cycle might look like and how it can be supported remains to be provided.
Empirically, there has been some recent research into the potential for analytics to be used by teachers as part of their reflective practice (Ghislandi & Raffaghelli, 2015; Avramides, Hunter, Oliver, & Luckin, 2014; Melero, Hernández-Leo, Sun, Santos, & Blat, 2015; McKenney & Mor, 2015), as well as the development of specifically designed analytics tools that are embedded to assist teacher inquiry into student learning (Haya, Daems, Malzahn, Castellanos, & Hoppe, 2015). For example, the information provided though analytics can be used as data to support teachers in making decisions about when to intervene and support their students (van Leeuwen, 2015). These studies all underscore the idea that the use of a combined approach of learning design, teacher inquiry into student learning and learning analytics can produce effective new pedagogies. However, as Rodríguez-Triana, et al. (2014) point out, to take advantage of this potential, educators need to craft their educational activities in ways that maximize the use of the learning analytics. Lockyer, Heathcote & Dawson (2013) have proposed one way for doing so by developing a conceptual model for teacher’s use of learning analytics as part of learning design.
In contrast to this attention to learning analytics use by teachers, there has been limited research exploring how students interpret and act on learning analytics. A small number of studies have started to examine the different kinds of reactions students have to particular types of visualizations (Santos, Govaerts, Verbert, & Duval, 2012; Arnold & Pistilli, 2012; Corrin & de Barba, 2014; Aguilar, 2015), but have yet to examine how students use these analytics in practice. A separate body of CSCL literature has worked extensively with student-facing analytics in the form of “group awareness” tools (e.g. Buder, 2011; Janssen & Bodemer, 2013); however, again the focus has been more on what group process information is provided and how (i.e. the design of the tools) rather than understanding and supporting students’ processes surrounding their use. In sum, there is scant guidance in the literature about how to encourage and guide students in using analytics to support their learning. A more detailed consideration of the learner perspective is needed because this is an important audience for analytics use and one that has unique and different needs from teachers (Ferguson, 2012). We begin our attention to this issue by first examining the literature for core challenges in the use of learning analytics considered particularly from the perspective of learners.
Challenges in Learning Analytics Usage
At its core, the process of using analytics to inform teaching and learning is comprised of two central activities: making sense of the information presented in the analytics and taking action based on this information (Siemens, 2013; Clow, 2013). Sense-making involves self-evaluation, asking useful questions of the data and finding relevant answers (Buckingham Shum, 2012; Verbert et al, 2013). Taking action relates to what we do (differently) based on this information; cognitively this is about decision-making. Overall, the act of interpretation has received greater attention than that of decision-making; however, we expect that as attention to the process of analytics use increases, this will become more balanced.
Below we review some of the central challenges that learners face in working with analytics, compiled from issues previously identified in the literature, addressing both the act of interpretation and subsequent action.
Learner interpretation.
Interpretation: The Challenge of Context. Interpretation refers to the link between the presentation of analytics to learners and how the learner makes meaning from this information. One of the fundamental challenges when it comes to interpreting analytics is providing context, as analytics are inherently detached representations of past activity. Giving them meaning requires a consideration of where the data is drawn from, why it is important and what role it should plays in future decisions. This is a complex process. From a teaching perspective, “knowledge of actual course design and instructor intentions is critical in determining which variables can meaningfully represent student effort or activity, and which should be excluded” (Macfadyen & Dawson, 2010, p. 597). Similarly, for learners, students need to be able to contextualize what is represented by these analytics, as well as what that means in relation to their personal goals and the overall intentions of the course. In many cases it seems to be assumed that simply providing well-designed analytics will be enough to induce productive use. However, there are several factors that work against this. One particular concern is that students are often not privy to their instructor’s pedagogical intentions, and thus unaware of both the learning goals for an educational activity and what productive patterns of engagement in it (as indicated by the analytics) would look like. Additionally, without guidance, students may not have the metacognitive skills needed to understand how analytics can support self-monitoring and/or reflective activities (Butler & Winne, 1995). Thus, students may be unclear as to what questions to ask of the data and how it can be used to support their learning.
Interpretation: The Challenge of Trust. A second challenge in the interpretation of analytics from the learner perspective is trust in the fidelity and usefulness of the analytics presented. If students don’t believe that the analytics are collecting and presenting data that are accurate and useful for their needs, they won’t spend time interpreting them. Social acceptability of the analytics depends on trust (Clow, 2013; Macfadyen & Dawson, 2012) and without that, analytics can have no influence on the learning activity.
Additionally, to have trust there needs to be a level of understanding. With the ubiquity of data tracking, most students are aware of the fact that actions in digital spaces leave trace data. The harder conceptual leap is that these remnants of complex actions can be extracted and analyzed to reconstruct higher level representation of their actions. Students are often unaware of how they are being monitored, why, and who can view this data. A lack of clear answers to these questions can result in a sense of distrust. From the student perspective, if all of the data processing prior to analytic presentation is “black-boxed,” it may seem as though analytics are for the benefit of the institution, administration or course designers, and not the students themselves (Slade & Prinsloo, 2013). For mainstream adoption to become a reality (Horizon Report, 2014), there needs to be an established level of transparency and trust between the development and use of analytics.
Interpretation: The Challenge of Priorities. The challenge of priorities reflects the varying decisions learners make in allocating their time and focus when presented with a variety of analytics, in addition to their regular course tasks. Students must decide when and how often to consult the analytics, as well as how they utilize the information provided. This may be problematic for students because even if instructional intentions are clear, learning activities are often complex, and not all useful learning activities are meaningfully captured by analytics. Thus, there is a danger that learners will prioritize the optimization of those things which are reflected by the analytics regardless of their actual importance for learning (Clow, 2013; Verbert et al., 2014). This, in turn, can take away focus from monitoring activities that are valuable for learning but not included in the analytics. Additionally, students may become frustrated if certain aspects of their learning activities are not represented by the analytics—they may develop the perception that these efforts are not valued. Importantly, there is a tension in that learning is a process (Kolb, 1984), whereas analytic metrics often represent the outcomes of this process, overlooking the intermediary steps along the way (Clow, 2013).
Interpretation: The Challenge of Individuality. A challenge students face in interpreting analytics is how to determine what their individual analytics mean in comparison to their understanding of course expectations. This standard is often the class average or a specific target determined by the instructor. The difficulty with this comes from students trying to adhere to a pre-determined standard, rather than focusing on learning. For example, in an online discussion, quality of posts is often more important than quantity, yet the standards for analytics are often set to display class average in quantity form. Students are drawn to this as a standard, to the potential detriment of the larger learning goal of quality correspondence. Additionally, each learner has his or her own starting point, pacing, as well as strengths and weaknesses that may shape how he or she engages with a learning activity. If the analytics determine what aspects of their activity students monitor, they are deprived of the opportunity to set their own pacing and explore their strengths and weaknesses. Analytics need to provide the opportunity for multiple paths for success, otherwise individuality is lost and student decision-making is replaced with compliance to the metric. This deprives students of their role as agents in their developmental and temporal learning trajectories (Slade & Prinsloo, 2013).
Learner Decision-Making.
Decision-Making: The Challenge of Possible Options. Learning analytics are produced and presented to the learner under the assumption that some action could take place as a result of the information provided (Clow, 2013; Ferguson, 2012). Taking action is a key challenge as it addresses the needs of the learner to first feel empowered to make a choice among a variety of options, and second, to use analytics to help inform the decision-making process. Deciding among possible options requires both the flexibility to have multiple choices as well as being given analytics that can help to inform students and support these decisions. Just as analytics need to represent the variety of actions students take in a learning environment, so too must there be choice in their application. Some authors warn that if we are not careful, learning analytics could actually disempower learners by encouraging them to conform to the feedback that analytics provide (boyd, & Crawford 2011; Buckingham Shum, & Ferguson, 2012). Kruse and Pongsajapan go so far as to say that learning analytics can “perpetuate a culture of students as passive subjects—the targets of a flow of information—rather than as self-reflective learners given the cognitive tools to evaluate their own learning processes” (2012, p. 2).
Decision-Making: The Challenge of Enacting Change. Beyond the challenge of being able to make decisions, students are also faced with determining how and when to make changes. Even if the analytics are understood, it may be difficult to link their diagnostic interpretation to actionable steps for improvement. The analytic feedback provided is limited; therefore, students may not know what to do, how or when to do it. Students need guidance in terms of prescriptive steps where analytics provide descriptive representation of past activity.
Decision-Making: The Challenge of Dependency. While the challenges previously outlined are presented from the student perspective, the challenge of dependency comes from a larger concern for students. Specifically, students may become dependent on analytics if they are not given the autonomy to interpret the analytics for themselves, as well as the opportunity to make their own decisions. The optimal use of student-generated data is to make better-informed choices (Oblinger, 2012). However, if students are alerted every time they make a small error or misstep, they are missing the opportunity to learn to identify these mistakes for themselves (c.f. Mathan & Koedinger, 2003). Finding a balance will be important as too much guidance may result in students no longer learning to make their own decisions; too little guidance may result in students struggling to determine what their options could be. The goal for students is to learn from the analytics (Booth, 2012), so that they can transfer these skills to new learning activities.
Building a Model for Student Use of Learning Analytics
In the previous section we outlined seven challenges for learners’ use of analytics. In this section we consider how these challenges might be addressed by building on Clow’s (2013) idea that productive learning analytics use should be considered as part of a cycle of reflective practice (Schön, 1983). We begin by briefly providing an overview of the educational idea of self-regulated learning as a starting point for conceptualizing a reflective cycle of learning analytics use. We then present the Student Tuning Model as a specific representation of a reflective practice in which students engage with analytics, interpret, reflect and take action.
The Reflective Practice Cycle in the Educational Literature on Self-Regulated Learning
The idea of learning analytics use as a part of a reflective practice cycle is similar in many ways to the notion of self-regulated learning (SRL). One of the goals of presenting students with analytics is to provide them with a tool for metacognitively monitoring their learning behavior, so that they may use this information to take actions to self-regulate (Roll & Winne, 2015). Numerous theories of SRL describe the process of self-regulation in different ways (for extensive reviews, see Boekaerts, Pintrich, & Zeidner, 2000; Zimmerman & Schunk, 2001); however, all share several premises in common. First, SRL is considered to be cyclical in nature and activity can begin at any point in the cycle. Second, SRL involves three phases of activity: a preparatory/preliminary phase, a performance/task completion phase, and an appraisal/adaption through metacognition phase (Miller, 2015). Importantly, in the SRL cycle learners are conceptualized as planning how to learn and act based on their individual goals. If these goals are not met or they find the work is too effortful, they may change tack. Thus goals are considered to be established by learners, rather than external mandated, though certainly there are external factors that may influence them.
Students often engage in SRL, but it is not always a productive process (Winne, 1995). Obstacles to productive SRL arise when learners neglect or ineffectively monitor their progress towards their goals, use inappropriate standards for monitoring, or are unable to change strategies (exercise metacognitive control) because they don’t know about or are unskilled in other tactics for learning (Winne, 2011). Learning analytics has the potential to help address many of these challenges by supporting student monitoring as well as setting a context for what to monitor. Beyond this, however, students often still need help in determining what to change.
Due to the multiple ways in which learning analytics data can provide feedback to inform the SRL activities of monitoring and appraisal, there has been a recent surge of research exploring potential connections between SRL and learning analytics (Roll & Winne, 2015). However, uncertainties remain as to when, how and what to introduce as analytics for student monitoring to facilitate learning. Interesting questions are emerging around how students make choices in the learning systems (Cutumisu, Blair, Chin, & Schwartz, 2015; Colthrope, Zimbardi, Ainscough, & Anderson, 2015), the context for these choices (Segedy, Kinnebrew, and Biswas, 2015; Nussbaumer, Hillemann, Gütl, & Albert, 2015) and how these will influence students’ use of learning analytics in the future. Addressing the questions of how to best support students in SRL-oriented learning analytics use first requires a conceptualization of the process by which students use data to self-regulate. To address this, we introduce the Student Tuning Model as a specific vision of learning analytics use in a cycle of self-reflective and self-regulated learning.
The Student Tuning Model
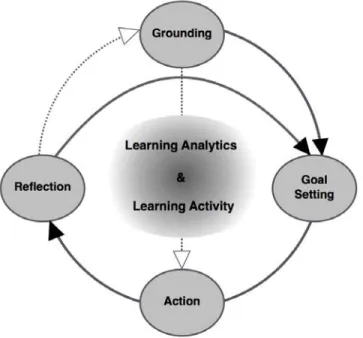
Drawing on the self-regulated learning literature discussed above, we now describe a specific model of learning-analytics-informed reflective practice. The Student Tuning Model is a continual cycle in which students plan, monitor and adjust their learning activities (and their understanding of the learning activities) as they engage in the educational environment with learning analytics (Figure 1). The four elements of the model are laid out below. In the remaining sections of the paper we will turn to the
question of how this model of analytics use can be supported through well designed learning analytics implementations.
Figure 1. The Student Tuning Model. This figure illustrates the relationship between the four elements of the model.
Grounding. While students may enter the cycle at any point, conceptually the tuning process begins with grounding, a process in which students grapple with the general question of what information the analytics provide and how it relates to their specific educational context. Features of the learning activities involved, including their perceived purpose and any expectations for the process or outcomes of engaging in them, may all influence the extent to which particular analytics are seen as useful and relevant (or, conversely, as extraneous and worthless). For students to engage with analytics they need to make sense of the roles the analytics are being introduced to play in their learning environment. For example, analytics that are introduced as a personal reflection tool, part of the course assessment, or to provide recommendation advice, will each be related to differently by students. Later we will discuss how to purposefully support the process of grounding; however, we note here that this activity of sense-making and evaluation occurs with or without intentional action by the instructor. Importantly, beyond intuiting the course-driven context for the analytics, students may also bring their individual contexts to bear. This personalization can take the form of accepting or rejecting (or placing relative emphasis on) particular learning goals, expectations, and analytics or bringing in entirely new elements outside the formal course structure. Such adaptation of the given goals is an example of how students blend normative descriptions of class activities with their own perceptions and values (Pintrich, 2003). In short, grounding defines the overarching relationship of the student to the analytics in a particular learning context. While we have depicted grounding as a distinct element in the model shown in Figure 1, it could also be thought of as a distributed cloud that continuously operates in the background during all other elements of the cycle since it refers to the links students are continuously making between the analytics and their expectations for a learning environment.
Goal-setting. Goal-setting deals with the planning of specific proximate objectives and actions for reaching them relative to the larger framework established through grounding. Specifically, learners
consider what they want to achieve in reference to what they believe is expected, setting one or more goals accordingly. For example, through grounding, a student might come to recognize that the overall instructional purpose of an ongoing collaborative GoogleDocs writing activity is to synthesize key course themes, of which two in particular interest her. She can then connect this to the fact that the provided analytics show her the frequency and size of her contribution to each theme (e.g. McNely et al., 2012), Specific goals emanating from this grounding could be to contribute regularly to these two themes or perhaps to become the most substantial contributor in the class to them. Once set, these goals drive how students interact with educational materials and activities, and the feedback the analytics provides becomes an important moderator for students to monitor and assess their progress towards their goals, as well as evaluate when the goals themselves need to be updated or revised (Locke & Latham, 2006).
Goals are important in self-regulated learning and analytics use because they can motivate learners to put greater efforts and also incite self-monitoring of their achievement. Self-set goals especially lead to higher self-efficacy which, influences the amount of effort learners make and their commitment to fulfill their learning challenges (Zimmerman, Bandura, & Martinez-Pons, 1992). Finally, goals are useful because they set a standard to which actual activity (as reflected in the analytics) can be compared. While goals logically precede action and reflection in the cycle, students may not always set these prior to engaging in a learning activity or system. Other possibilities include that goals emerge as a by-product of action in the system or as a result of reflection on it. It is also possible that students never become intentional about their learning activities, impoverishing the potential for analytics to support them.
Action. Action is a key element in the Student Tuning Model; action is when learners engage in behaviors to realize their goals. These behaviors also generate the data from which the analytics will be created, though it is important to recognize that not all behaviors, nor all qualities of these behaviors will be reflected in the analytics. It is in this stage that the actual tuning activity occurs; that is, that the learner attempts to adjust their learning behaviors to better fulfill their learning purpose. This activity is conceptualized as tuning because it involves regular, relatively small changes (ideally improvements) in response to feedback. The idea of tuning stands in contrast to models in which analytics lead to a radical change, or paradigmatic shift in students’ learning activities. There is an interesting asymmetry in that while the tuning action can be considered the heart of the self-regulation cycle because it is where change takes place, the other elements supporting this change (planning, monitoring, evaluation) have been more heavily theorized.
Reflection. Reflection builds on the three other phases as students look back at the actions they took (reflected in the analytics) in comparison to the goals they set, all while grounding this in their perceptions and perspectives on the course expectations. This is the key phase in which the interpretation of the analytics and decisions about what changes should be made occur. Specifically, learners may make decisions about any of the other phases: a) setting an intention to change their actions to better meet their goals; b) changing specific goals based on their actions; or c) changing their overarching grounding in how they conceptualize the learning activity. Reflection has long been thought of as an essential part of constructing one’s understanding (Schön, 1983); in turn, as one’s understanding develops, reflection can also be used more effectively to support learning (McAlpine, & Weston, 2000). Traditionally, reflection has problematically often depended on the learner’s own faulty and incomplete recollections (Veenman, 2013). Learning analytics offer an important advantage to this activity by providing data that can serve as an object of reflection. Data can provide a more precise account of the learning process on which to reflect, though this account is neither complete nor neutral. The information provided by analytics can also be considered as a kind of formative feedback. While assessment in education is often negatively associated with (high-stakes) summative testing, when done in a formative way as part of self-regulated learning, it can be a powerful tool to support students in better understanding and taking control of their learning processes. This is an important point as it not only addresses the role of students’ intentionality
in the system, but also the fact that tuning is a continual process that students continue to engage with as they progress towards their goals.
Supporting the Student Tuning Model: Methods for Developing and Validating a Framework for Pedagogical Design
Above we outlined the Student Tuning Model as a descriptive representation of how students can productively engage with analytics. We now move to describe the methods by which this model was used to generate and test a prescriptive framework for designing the use of analytics in a learning environment. This is a first step to bridge the gap in the literature between design of analytics themselves and designing for analytics use.
Prelude: Conceptualizing Learning Analytics Implementations, Not Interventions
The primary term that has been used to describe how learning analytics are introduced into the learning environment is “intervention.” We ourselves have used this term previously and found it useful to distinguish between the design of learning analytics tools and the design of the activities in which they are used. While this distinction between the design of technical artifact and social processes is an important one, we are uncomfortable with the language of “intervention” because of several undesirable connotations. Specifically, the term intervention implies learning analytics use as an interruption to regular learning practices at a specific point in time to address a problematic situation (Wise & Vytasek, in review). In contrast, we view learning analytics use as a productive and ongoing part of the regular adjustment of learning practices. For this reason, we use the term “learning analytics implementation” to describe how learning analytics are introduced into the learning environment as we feel it better represents the integration of the learning activity, analytics and student tuning process that we hope to facilitate.
Generating the Align Design Framework for Learning Analytics Implementations
The Align Design Framework was developed as a tool to support the conceptual process of how students engage with analytics described above. The framework is presented as four interconnected principles for pedagogical practice that can support students’ analytics use. Our selection of theoretical ideas and our derivation of guidance based on these ideas was grounded in our understanding of the Student Tuning Model, related research, established critiques of analytics usage outlined previously, and our collective experience as educators and students. This method follows a tradition in education and human-computer interaction of drawing on theory and past experience to generate design guidance that is then tested in practice (Design-Based Research Collective, 2003; Stolterman & Wiberg, 2010). The framework is presented in the Results section below; rather than describe each principle in purely abstract terms, we have combined the presentation of the conceptual design framework with examples of its instantiation in practice. This instantiation described also served as the context for the initial validation of the framework; validation evidence for the principles is described at the end of each section.
Methods for Initial Validation of the Framework
In the initial validation of the Align Design Framework we asked the following question:
How did the implementation of the principles of the Align Design Framework support and/or hinder engagement in a tuning process by graduate students in a seminar course provided with analytics about their online discussion activity?
The validation study was conducted on a small implementation of the E-Listening Analytics Suite in a semester-long graduate-level class on educational technology into which nine doctoral students enrolled. The class met face-to-face once a week for thirteen weeks, with online discussions conducted between sessions for ten of the thirteen weeks. The E-Listening Suite provided analytics about students’ activity in the online discussions, focusing primarily on their attention to others’ messages. Analytics
were provided both embedded into a (specially designed) online discussion forum tool and extracted from it and sent to a dedicated analytics space that also included a reflective journal tool. An explanation of how each of the four principles of the Align Design Framework were instantiated in this implementation if the E-Listening Suite into this particular learning context is given in the Results section as each principle is described. For details about the specific analytics provided in the E-Listening Suite and students’ reactions to them see Wise, Zhao and Hausknecht (2014).
At the end of the term, all of the students in the class and the course instructor were interviewed by research assistants about their experiences using the learning analytics as part of the online discussion activity. The hour-long semi-structured interviews were organized around four main topics: 1) questions about how the student understood the purpose of the online discussion as well as their participation in it; 2) reaction to and use of the analytics embedded in the discussion tool; 3) reaction to and use of the specific metrics provided as extracted analytics; 4) experience using the reflective journal with the analytics. Transcripts and text of the reflective journal kept by each student were analyzed qualitatively using an inductive approach (Thomas, 2006). Three researchers first marked as relevant text any comments addressing aspects of analytics use. From there, an iterative coding process of identifying repeating ideas, exchanging the coded texts, and dialoguing about the emerging interpretations was used to develop higher-level themes (Auerbach & Silverstein, 2003). All themes were supported by multiple quotes coming from more than one student. The final themes were then organized and examined in relation to the four principles of the Align Design Framework. Because the analytics implementation that students experienced was based on the framework, all themes addressed at least one principle.
Results - The Align Design Framework and Initial Validation Evidence
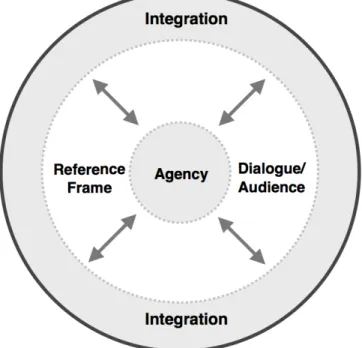
The Align Design Framework (Figure 2) consists of four interconnected principles for pedagogical practice (Integration, Agency, Reference Frame, and Dialogue/Audience) to support students’ analytics use. The following sections introduce each of the principles in three parts. First, a conceptual description of the principle is given, including a theoretical rationale for how it supports the Student Tuning Model and addresses the identified challenges associated with students’ use of learning analytics. Second, a practical account is provided for how the principle was instantiated in the validation study. Finally, findings from the study are presented to demonstrate how the principles supported and/or hindered students’ engagement in the tuning process in this context.
Principle 1: Integration
The central goal of the Align Design Framework is to provide an intentional context for the human activity in which analytic tools, data, and reports are taken up and used. Thus the first principle in the framework is the Integration of the analytics into the overarching learning activities taking place. The goal of Integration is for the instructor or designer to position analytics use as an integral element in the learning process tied to their goals, expectations and planned learning process.
Integration can be thought of both conceptually and practically. Conceptually, integration involves helping students to understand the goals of the learning activities for which analytics are provided, recognize what is considered as productive engagement towards these goals, and finally make the connection to how the analytics provide indicators of the ways in which their actual activity does or does not match these expectations. In this way, conceptual Integration can help to support the student tuning processes of grounding, goal-setting, action and reflection in meeting the interpretive challenges of context and priorities discussed earlier. Importantly, not all of the analytics provided by a system may align equally well with the goals of a particular learning activity or even an entire course; thus part of designing for Integration is figuring out which analytics should be focused on in a given situation, and which should be de-emphasized. Further, it may be necessary to point out valued qualities of activity that are not represented by the analytics. Thus the overall goal of conceptual Integration is to create a foundation of the qualities of productive participation in a learning activity which can act as a local
context to make sense of and act on the data. Thus, the same analytics suite can be tailored to meet different needs across diverse learning contexts.
Figure 2. The Align Design Framework. This figure illustrates the relationship between the four principles of the design framework.
Practically, Integration is also about how the use of learning analytics is incorporated into the activity flow of the educational environment so that their use is a regular part of the learning process, rather than ancillary to it. This incorporation might include dedicated upfront time to establish a shared understanding with students about the conceptual connections between purpose, process and analytics (or perhaps to co-construct this understanding with the students), as well as to explain to some extent how the analytics are generated from the data. The depth to which this latter issue is treated will depend on many factors, including the complexity of the calculations and analytical sophistication of the students; however, some attention is needed to address the interpretive challenge of trust. In addition to these upfront concerns, practical integration also means helping students set a rhythm for the goal-setting/action/reflection tuning cycle. For experienced learners this may come naturally, but for many students, guidance about when and how often to consult the analytics, assess progress towards goals and make adjustments to their learning can provide useful structure (and restraint) for their analytics use.
The frequency with which the analytics are provided or accessed as well as the schedule for reflective activity will vary depending on the context. The goal is to create a specific timing for cyclical review so that students are not overwhelmed by or become overly reliant or fixated on the analytics (Buckingham Shum & Ferguson, 2012). Analytical feedback needs to be provided quickly enough to impact practice (Buckingham Shum & Deakin Crick, 2012) but also on a scale for which the analytics make sense to examine in a particular context. Especially for analytics that track larger scale constructs, the time-frame over which the data is examined can dramatically affect the results (Zeini, Göhnert, Krempel, & Hoppe, 2012). Guiding students around the structure and timing of this is a crucial part as it sets the stage for students to learn how they can interpret and use the information provided through analytics to monitor their progress towards their goals.
Implementing Integration. In the initial implementation of the Align Design Framework, Integration was enacted in several ways. Conceptually the instructor mapped the goal of the online discussion activity (to build individual and collective understandings of the course material through dialogue) to her expectations for productive participation in it (guidelines for the quantity, quality, and timing for making posts as well as broad, deep, integrated and reflective attention to the posts of others). The analytics were introduced in this context; the instructor described how information embedded in the discussion interface could support particular elements of participation and the metrics extracted from it mapped to the expectations (e.g. the analytic of “percent of posts read” was an index for the breadth of attention to others’ posts while the interface visually showed the distribution of these posts throughout the discussion, indicating if this attention was integrated or scattered (see Wise, Zhao, & Hausknecht, 2014 for details). The instructor also highlighted for students that while analytics about posts’ contents were still in development, the quality of contribution was nonetheless an important element of the expected participation. It was also made clear that students had flexibility in the interpretation of their analytics, which was encouraged through the reflection activity, described in further detail under the principle of Agency.
Practically, Integration was enacted through clearly articulating the linked goals, expectations and analytics described above in initial discussion / analytics guideline documents which were presented and explained in-class; students also had the opportunity to ask any questions they had about the analytics, their collection and calculation, and their use in the class. The analytics were explicitly presented as tools for reflection to understand and make changes in one’s discussion participation, rather than a part of the course evaluation. The course was then structured so that students were guided through a weekly reflection journal activity to set goals for their discussion participation and consider their progress towards these based on their self-reflection and the analytics. This set-up a week-long rhythm of goal-setting/action/reflection.
Validating Integration. Initial evidence suggests that the elements of Integration described above were useful in supporting students in the tuning cycle in several ways. At a basic level, students seemed to be supported in grounding their thinking about the analytics in the expectations outlined for the discussion activity. One student shared that the analytics were “trying to tell you about meeting a goal that we had and set up… so I get that.” Evidence of grounding was also seen in the way students discussed the guidelines for discussion participation and the analytics as one unified concept which informed their understanding of the expectations for participation. As one student explained:
[Instructor Name] was proactive in that in setting up those criteria. She did a lot of work to make it work to introduce rules of engagement at the beginning—that helps. I think it was very good to have scope outlined very clearly at the beginning and I think that did help actually…The other thing was just setting reasonable parameters of what is appropriate and what makes sense and what you are trying to do. The general guidance worked really well, they were well thought out and they definitely informed the scope of what we should be doing in the discussion forum.
Beyond establishing the scope of productive activity, many students indicated that they actively thought about the guidelines and analytics while participating in the discussions and used these to monitor their activity. For example, students were given the guideline to keep their posts relatively short to contribute to an ongoing interactive dialog and the analytic of post length was available to monitor this. One student shared how they used this information while participating in the discussions: “If I felt my word count was too big, then I wouldn’t hit the reply, I would actually think about it a little more…”. Another student mentioned that they thought about the range of participation analytics when deciding when to log-in to the discussions: “I was working specifically on trying to get in earlier regularly.” One
student went so far as to suggest that the integration could be made even tighter by linking the guidelines directly to the discussion so people would not ignore or forget the guidance while engaging in the forum. Students reflected that they saw these guidelines and analytic metrics working together as flexible to meet the needs of the discussion. One student shared, “You know, you don’t want to say to people, ‘Never post beyond 300 words’ ‘cause sometimes there is a place to do that, so I think it is good to have it kind of open.” The analytics and guidelines were “setting reasonable parameters of what is appropriate and what makes sense and what you are trying to do. The general guidance worked really well.” These guidelines were established by the instructor who students thought “did a lot of work to make it work to introduce rules of engagement...that helps”.
While the students were made aware of the analytics as well as the potential benefits of their use, some still found it challenging to decide when to consult the analytics and how to make them part of a self-reflective tuning cycle. One student shared, “It is interesting because I did have access to those analytics persistently throughout a week, [but] I would tend to forget about it in the course of being involved in the discussion forums.” This quote highlights that linking engagement in the activity and analytics use requires more than simply making this opportunity available. Similar to the more general process of self-regulation, it could be that engagement in the student tuning cycle has multiple individual factors that go into how, when and to what extent a student chooses to engage. There was also evidence to suggest a challenge in that some students lacked trust in the analytics, which may have dampened overall use. As part of the introduction to the analytics, students were given an explanation of how their activity data was being tracked and presented, however some students still doubled the validity of their analytics. As one student said, “I did try [to use the analytics] but at the same time when there is that little bit of doubt and you think, ‘I don’t know if this is really measuring that’ it seems like it might not be that accurate and then I – I didn’t withdraw from it, but maybe I put it down in priority a little bit” indicating his partial dismissal of the analytics. It seems that greater attention to garnering student buy-in to the analytics may be a key element in encouraging their uptake.
In summary, evidence suggested that the implementation of Integration in this context supported students in composing a unified understanding of the learning activity expectations and analytics. Students used this understanding to guide and monitor their activity in a flexible way; however, challenges were found in student trust of the analytics and their ability to make them part of their regular patterns of activity.
Principle 2: Agency
The purpose of Integration was to establish an instructor-driven frame for the learning activity and analytics use; however, it is also important for students to take ownership of their learning process and be proactively engaged in their own learning to be successful (Zimmerman & Schunk, 2013). In fact, the possibility to support learners in actively taking charge of managing their own learning process is one of the key attractions of learning analytics (Govaerts, Verbert, Klerkx, & Duval, 2010). For these reasons, the principle of Agency is at the center of the framework, directed at giving students the opportunity to engage with analytics as a tool to inform their actions, as opposed to analytics being something with which students must comply. Agency provides a counterbalance to Integration, promoting a degree of equilibrium between instructors’ and learners’ authority in setting intentions for activity and monitoring the results. While, by definition, Agency is not something that can be imposed through design, learning and analytic environments can be constructed in a way that creates space for and encourages it.
There are three important conceptual dimensions to consider when designing to support Agency. The first dimension relates to creating an environment that allows for individualization of learning goals. By making personalized goal-setting an explicit and structured part of the learning activity, learners are asked to be purposeful in thinking about the stated objectives of the activity, evaluate their own strengths
and weaknesses, and set specific and proximal targets to work towards. The process of goal-setting should be tied to and follow from the introduction of the learning activity’s purpose as described above under Integration. In this way, Agency supports students in balancing these external goals and expectations with their own internal ones. Such balance is important because each student has a different starting place and skill-set that they bring to their learning, so they may need focus on different aspects of the learning task that require more attention than others. In other words, there is a need for multiple profiles of productive activity and improvement, rather than a single goal and path to which all students must aspire. These individual goals can then provide a personalized context for the sense-making of analytics, the second dimension of agency.
This next dimension of Agency relates to flexibility of interpretation. While the instructor generally determines the selection of analytics as well as their formal role in the course, they can also make efforts to create space for students to have some authority in interpreting their meaning. Providing this space is important because students have access to information instructors do not, which can contextualize the analytic data within students’ personal experiences; for example, a student will know whether they spent especially long working with particular content because they were very interested in it, or very confused. These aspects of interpretation are an important part in making sense of the feedback the analytics provide and how it is relevant to students’ learning. Instructors can cultivate recognition that students’ interpretations are appreciated and respected, so that students begin to value the feedback they provide for themselves through self-evaluation. For example, instructors can refrain from providing ready-made interpretations of data, instead modelling different ways the information can be thought about and inform the learning process.
The third and final conceptual dimension of Agency surrounds student decision-making based on the analytics. Here instructors must work to strike a balance so that students can decide for themselves what actions to take, but also provide enough guidance so that they are not paralyzed with uncertainty about how to take action. There is tension between too much guidance which could lead to student over-dependence and too little guidance which doesn’t give students the opportunity to take data-informed action in a timely way. Thus instructors need to create the space for students to make decisions about action, while also providing some guidance about how to do so. This guidance may be offered through prompting questions that remind students to look back at previous goals, consider the analytics, and think about where and how changes can be made. Additional forms of responsive guidance are discussed under the principle of Dialogue.
In application, one powerful way to support Agency is to provide a student-owned space for receiving, working with, and documenting thinking around the analytics. Providing a dedicated place for this activity to occur establishes it as a valued activity in the learning process. Through documenting their thinking around the analytics, students can explore the identification of their own goals, interpretation of analytics and how these can inform decisions about future action. For example, a popular technology for creating an individually-owned reflective space is private or publicly shared blogs (Ferguson, Buckingham Shum, & Deakin Crick, 2011).
Implementing Agency. In this implementation, students were each given a personal and private wiki space in the form of a journal in which to set goals and reflect. This is also where their extracted analytics appeared to them, provided on a weekly basis. The instructor encouraged students to use the space to reflect on their progress each week as well as update goals with regards to their planned activities. Students were provided with a small amount of class time for doing this and the instructor served as an audience for the journal providing occasional comments. By dedicating (technical and temporal) course resources to the reflective wiki journals, the instructor aimed to instil a sense of value in students’ reflective practice and established the expectation that students would come to their own understanding of the analytics as well as what role it would play in their learning. Students thus had the
first word (literally) in composing the meaning of the analytics. They could also ask questions and receive guidance if they were struggling to make sense of the metrics or change their learning behaviors based on them. In a limited number of cases, the instructor drew students’ attention to metrics they may not have focused on or suggested an alternate interpretation to the one put forth by the student, but the core of the activity remained student-driven, centered on their goal-setting and what they valued as part of the learning activity.
Validating Agency. Initial evidence suggests that the implementation of Agency facilitated student-driven goal-setting and cyclical reflection. Students themselves recognized the role of the reflective journal in helping them to take ownership and control of the process, pointing out “it definitely improved my awareness of what I was doing in the discussion. So when I would go into the discussions, I definitely could see myself being more self-regulating …” Specifically, the development of this process-level insight was seen in the goals that student set and the way they chose to focus on different components of the analytics. As one student explained, “There were some [metrics] that I put more weight on than others.” For example, one student shared that as a result of reflection her goal was to “go into the discussions when I had time to really actually think about things as opposed to just, you know, read them, check, read them, check.” With previous reflections inspiring plans for future changes she noted, “I would typically read the previous weeks’ goals and the feedback from the instructor again and just make sure that I did sort of cover those bases.”
Students also demonstrated ownership by setting the criteria for when a goal was completed. As one student explained,
Generally, I tried to shift the goals. I did have some things that I would come back on that I felt that I wanted to try this again or think that I’ve actually – I don’t think I received enough feedback within the forum itself to gauge if that had shifted. So I felt like I could try for two weeks or maybe three. Yeah, but each time trying something different was an interesting approach.
Through this process, students felt capable of and invested in achieving their goals. One student proudly shared, “Pretty much every week where I did set those goals I was pretty much able to make those changes… it was a good opportunity to think about that and actually plan for it.” Further evidence that the implementation of Agency supported student ownership of the tuning cycle was found in goal-setting activities that evolved beyond course guidelines to represent actions students thought would be personally valuable to their learning. One student commented that, “One of my weekly goals sort of midway through the course was to try and organize all of the postings that kind of resonated with me.” This was not a strategy introduced during the course but rather one that came from the learner as part of the goal-setting and reflection process.
Going beyond goal-setting, students showed evidence of establishing their own interpretation of the analytics provided to make decisions about what changes they did and did not want to make. Firstly, students brought information from their experience participating in the analytics to bear in their interpretation. For example, in looking back at their analytics, one student noted in their reflective journal, “yeah, things looked low for the week, but this was a busy week, it will be better next week.” Secondly, students recognized that different profiles of activity were not necessarily better or worse, but just different. For example, one student shared that “[it] was interesting to compare myself to others because, again, [I like to express] myself in short paragraphs instead of long things. I like short and condensed and meaningful ….we [are] all different, [it is] not that something is bad or good, it is just different things.” Thirdly, students were aware that they could select their own path for change, commentating “I think based on the numbers you could have… you could go in a direction or choose the direction how you want to go.” One example of this is a student who described,
I could see I wasn’t in the discussion for as many days as I would have liked, so I would make an effort to go in, even if was only briefly, on the weekend so I could sort of, you know, be a part of the discussion development more.
Of note in this quote is not only the student’s decision to make a purposeful change to their discussion activity based on the analytics, but that this change was tied to a motivation about the discussion’s purpose and not simply the numbers themselves. Finally, a different student pointed out that
…knowing that there is a metric that would tell me how much I really spent time on was good because it made it feel okay …I won’t click on every single thing, but at least I’m going to make sure I try and spend time alone with what I do.
This illustrates how students used the analytic as a flexible tool, as opposed to the analytics rigidly determining their actions.
Despite the instructors’ efforts to provide space for Agency, not all students took up the opportunity to take ownership in goal setting and the interpretation of the analytics. For example, one student described “she always asks us to write a goal…But some days I’m too busy to just read and post something and I forgot what I wrote about my goal.” For other students the problem lay not with the goals but their ability to take action to meet them: “I thought it was useful to reflect, but I found it frustrating to reflect and set goals and then not necessarily be able to actually meet them.” Finally, some students simply chose not to engage with the process in a meaningful way: “I don’t actually think my participation changed very much. I don’t think writing about that reflection piece contributed to any changes that I made in my participation.”
In summary, the validation evidence suggests that the implementation of Agency in this context supported many students in taking ownership of their analytics use by setting individual goals, actively interpreting their analytics, and making personal decisions about changes. While the majority of students demonstrated taking ownership of their analytics use in some way, some did not engage with the analytics in an agentic fashion. This reinforces the point that Agency is not something that can be directly imposed but rather must be indirectly supported and encouraged.
Principle 3: Reference Frame
The initial principles of Integration and Agency create an overarching structure surrounding the activity and promote a core of student ownership; the final two principles target support for the space of negotiation between instructor-driven Integration and student-driven Agency as well as the contextualization of learning analytics use. The first of these principles is Reference Frame. Reference frames are the comparison points which orient students’ interpretation of analytics. In general, there are three potential reference frames to which analytics can be compared. The first is the criterion articulated as part of the course expectations, which were described under the principle of Integration. These provide an absolute reference point to which students can compare their own analytics. A second reference frame for comparison is a student’s own prior activity as discussed under the principle of Agency. This is a relative reference point since a student’s prior activity does not represent an immovable goal, rather one which supports the tracking of improvement over time.
The final reference frame for comparison, and one which has not yet been discussed is the activity of other students. Aggregated information about the performance of others student is often provided in analytic systems and can be powerful in showing a student where they stand in relation to their peers (Govaerts, Verbert, Duval, & Pardo, 2012) but can also have negative consequences for their self-efficacy. For example, low-performing students who may not initially realize how their efforts stack
up against others might be motivated by peer comparisons or find this information stressful and intimidating. In addition, by definition a student’s peer provides a relative, not absolute, standard for comparison. Thus, if a class average is substantially lower than an instructor’s expectations, it may not be an appropriate target to aim for. In other cases, everyone may already be well beyond the bar of what is necessary, making additional exertion to improve a particular metric wasted effort. In particular, measures of the class’s central tendency (particularly the average) have several challenges as a reference point, including the potential to be overly influenced by the activity, or inactivity, of certain students and flattening out differences across particular subsets of students. For these reasons, instructors need to consider how they introduce peers as a reference frame so that it supports a productive, not detrimental tuning process.
Some of the issues described above can be addressed through careful design and refinement of analytic tools in how the peer reference frame is presented, for example, processing data to provide aggregate measures for only similar kinds of students or providing aggregate measures of spread (variance) as well as central tendency. However, there is also an important role for pedagogical design to play in terms of helping students to balance the different reference points as well as understand their value and limitations in a specific context. In practice providing reference points can take several different forms depending on situational factors. In some courses external standards for expected activity can be emphasized as a fixed guidepost by which to judge progress. In cases where absolute indicators are harder to provide, the instructor might stress the importance of the personal reference frame, explicitly asking students to monitor the changes in their analytics over time. The overall aim in each of these designs is to help students avoid the simplistic mentality of “more (than other students) is better.”
Implementing Reference Frame. The course implementation attempted to balance the use of all three reference frames. As previously mentioned under the principle of Integration, the instructor articulated the course expectations in conjunction with analytics, which became part of the first reference frame. In addition, the peer reference frame was made available via extracted analytics that provided students with the group average for each of the metrics. Finally, as discussed under the principle of Agency, students kept ongoing reflection journals in a wiki with the new analytics being added to (rather than replacing) prior ones. This allowed students to make use of their own prior activity as a reference frame. This was actively encouraged through one of the reflection questions which asked, “How does your participation in this week’s discussion compare to previous weeks?”
Validating Reference Frame. As reported under Integration, students used the analytics in conjunction with the course guidelines as a reference frame to guide their behaviour in the course and compared their metrics back to the expectations indicated by the instructor at the start of the course. Students also showed some evidence of using their own prior activity as a reference point for the analytics, for example, one student arrived at a realization that they needed to focus their discussion efforts based on seeing “how the numbers are actually decreasing, meaning that you organize your time more constructive[ly] and saying this is something I just want to do instead of wow, I want to do everything.” Despite some use of students’ own prior activity as a reference frame, this seems to be an element that could be strengthened in future implementation designs.
Finally, despite their under-emphasis in the pedagogical design, the peer reference frame was still a very salient one for students. As one student explained, “You can actually see from the numbers how students are, where they are standing, so that was a good one and then you can compare yourself to others.” Many students found this reference point to be a useful one: “I kind of see where I [am] among other participants. Then, also I could see my tendency or my approach to participate in the forum” and noted that the peer average was useful to see, “not that it was good or bad, because some people would come in more or less, but it was interesting to see who was doing what.” For these and other students, the peer average was not an intimidating force, but one reference point among several. As one student
explained, “I was different than the average quite a bit, but then I don’t think you should always be the average, it’s different for everybody, and people need to work on it.” In contrast, for two students in the implementation the class average as a reference point seemed to have a negative influence. For one student it caused a high level of stress and worry, stating that “[Analytics] is the factor which gave me more negative thought about my own way to participate in the forum… always my score is below others.” For another student, the peer reference frame led to the competitive activity of trying to myopically out-perform others on one particular metric. He shared,
Yeah, usually [I] say in the reflection journal that I should post more or something because I want to reach the average of something, although I know that not every post [is] very meaningful or very significant, but I want to make that number, you know, psychologically.
In this way, the peer average as a reference frame for the analytics detracted from the goal of the learning activity, which was to make meaningful contributions to the discussion.
In summary, students recognized the use of all three reference frames in their analytics use. First, students compared their analytics with the expectations set out by the instructor in the course guidelines for self-evaluation and to guide future participation. Second, there was some evidence that certain students used their own prior activity as a comparison point, however this is a reference frame that could be further strengthened. Despite efforts to balance the use of the three reference frames available, the activity of other students in the class as represented by the peer average was by far the most common reference point used. All students expressed an awareness (both in their journals and in the interviews) of the class average given in the metrics. Many appreciated it as a reference point, using it as a tool to reflect on their own participation by noticing differences, evaluating what that could mean for themselves, and using that to guide future actions. However, for a small but notable minority, it induced feelings of inadequacy or competitiveness, limiting its usefulness for them as a productive reference frame.
Principle 4: Dialogue / Audience
Similar to Reference Frame, the final principle in the Align Design Framework targets support for negotiation between instructor-driven Integration and student-driven Agency. This principle was originally conceived of as Dialogue, focused on setting up analytics to act as an object of conversation between instructors and students. However, through the implementation of this principle and examination of its enactment, we came to recognize that the value provided was broader than simply the opportunity for the instructor to respond to students about their analytics, but also included the basic creation of addressees for the student goal-setting, action and reflection cycle. In this sense, this principle might be reconceived in terms of Audience (to one’s self, one’s peers and the instructor). Because the question of which conceptualization is most productive remains open, we refer to the principle in the current writing as Dialogue / Audience.
There are several reasons to promote Dialogue / Audience as part of learning analytics use. First, creating an audience for goal-setting and reflection can enhance the gravity and sense of commitment to those processes and thus shape the reflective activity itself. Second, these audiences can contribute to making sense of and acting on the analytics. For example, the input of an instructor or one’s peers can be useful in providing an alternate perspective on the analytics and thus facilitate the process of reflection (Andrusyszyn & Davie, 1997). Instructors, in particular, have the opportunity to examine students’ process, use of analytics and respond as necessary with support to address any confusion or challenges the students encounter, as well as query into particular interpretations or goals. Peers too, as other individuals participating in the activity and receiving analytics based on it, can potentially provide helpful insight and feedback. In these conversations, the analytics themselves can act as a third “voice” in the conversation. This gives all parties a neutral object to which they can usefully refer in conversation (e.g. “I noticed that my/your level of participation differs in comparison to the rest of the class” rather than the groundless “do