© J Leung, S McKenzie, J Martin, D McLaughlin, 2014. A licence to publish this material has been given to James Cook University, http://www.rrh.org.au
R E V I E W A R T I C L E
Effect of rurality on screening for breast cancer: a
systematic review and meta-analysis comparing
mammography
J Leung, S McKenzie, J Martin, D McLaughlin
School of Population Health, University of Queensland, Brisbane, Queensland, Australia
Submitted: 27 June 2013; Revised: 15 October 2013; Accepted: 8 November 2013; Published: 23 June 2014
Leung J, McKenzie S, Martin J, McLaughlin D
Effect of rurality on screening for breast cancer: a systematic review and meta-analysis comparing mammography
Rural and Remote Health 14: 2730. (Online) 2014 Available: http://www.rrh.org.au
A B S T R A C T
Introduction: The lower breast cancer survival rate observed among rural women may be related to differences in screening access and utilization. We evaluated existing evidence for rural and urban differences in mammography service use in adult women. Methods: A systematic search was conducted on 4 April 2012 and updated on 1 November 2012, which yielded 28 studies for inclusion.
Results: The rural population was less likely to have mammographic breast screening, and this difference was consistent in various areas of the USA as well as across a number of other countries. Meta-analyses using random effects models showed that women residing in rural areas were less likely than urban women to have ever had a mammogram (odds ratio (OR)=0.74, 95% confidence interval (CI)=0.62–0.89) or to have an up-to-date mammogram (OR=0.59, 95%CI=0.49–0.70).
Conclusions: Mammography is currently the best tool for the early detection and diagnosis of breast cancer. The rural disadvantage this review has identified may contribute to the lower breast cancer survival among women living outside urban areas.
Introduction
Breast cancer is the most prevalent cancer in women and disparities in prognosis based on area of residence have been observed1-3. Rural areas are characterized by a low population
density and residents often have poorer access to health care than urban areas4. While the incidence of breast cancer has been
observed to be lower in women residing in rural areas, in those diagnosed with breast cancer, death rates are higher3,5-8.
Rural–urban differences in the breast cancer experience of women have been systematically reviewed9. Across the
41 studies reviewed, rural women were likely to report difficulties in breast cancer health service access, such as a greater distance to breast cancer specialists and treatments. Treatment procedures also differed, with a rural disadvantage noted in access to, and use of, breast cancer services after diagnosis. However, this review did not consider pre-diagnosis screening differences between women residing in rural and urban areas.
Despite recent evidence questioning the efficacy of mammograms across all age groups10, current guidelines suggest that women over
the age of 50 years should have a mammogram every 2 years because this is currently the best tool available for the early detection of breast cancer11. Most developed countries do have
population-based breast screening programs in place, where women over 50 years of age are encouraged to have a mammogram every 2 years11. However, whether the urban–rural
differences in the use of mammograms is country-specific remains uncertain. The aim of this systematic review is to compare all existing evidence on the prevalence of mammograms between women residing in rural and urban areas.
Methods
Search terms and databases
Preferred Reporting Items for Systematic Reviews and Meta-Analyses (PRISMA) guidelines were used to perform the
systematic review. A review protocol for search and inclusion criteria was determined in advance and its completion was documented. The search strategy was developed by JL and SM and was implemented by JL.
The literature search was carried out on 4 April 2012 and updated on 1 November 2012. The databases searched (from earliest available date) were PubMed (from 1951), CINAHL (from 1982), Embase (from 1966), Sociological Abstracts (from 1952), Cochrane (from 1996), Web of Science (from 1898), and RURAL (from 1966). Search terms were (‘breast cancer’ or ‘breast neoplasms’ or ‘breast tumor’ or ‘breast tumour’) and (‘rural' or ‘rural population’ or ‘rural health’ or ‘rural health services’ or ‘rural health care’ or ‘urban rural differences’) and (‘mammography’ or ‘mammogram’ or ‘breast examination’ or ‘physical examination’ or ‘early detection of cancer’ or ‘cancer detection’). Limits were applied on the search to only include peer-reviewed publications in English with a sample of adult women, with no restrictions on the date of publication. Lists of references from retained articles were screened for additional material. Where full-text articles could not be retrieved through databases, authors were contacted and the articles requested.
Eligibility criteria and study selection
Studies to be included underwent assessment by two independent reviewers (JL and SM). Where discrepancies existed between the reviewers, papers were referred to a third reviewer (DM). Studies were included in the systematic review if they met the following eligibility criteria: (1) the population included adult women; (2) the outcome measure was clinic record or self-report of mammography; (3) quantitative statistics of rural versus urban comparisons were present; (4) the study included an observation on the screening rates in a non-intervention sample; (5) quality was 6/10 or higher, based on the assessment described below. Cross-sectional studies were included. Baseline cross-sectional observations from intervention studies before the intervention had been carried out are included. Studies were
© J Leung, S McKenzie, J Martin, D McLaughlin, 2014. A licence to publish this material has been given to James Cook University, http://www.rrh.org.au
included in the meta-analysis if required statistics were available.
Quality assessment
Quality and risk of bias of each study was assessed by adapting the Newcastle–Ottawa Scale (NOS) for quality assessment of non-randomized studies in meta-analyses12. The development
of the NOS involved panel review and critical review by experts. The NOS has strong face validity and is endorsed by the Cochrane Collaboration. Ratings were made on a dichotomous scale on whether the study met the criteria on the selection of study groups, comparability of groups, and the assessment of outcomes. The 10 criteria assessed in the current systematic review were (1) representativeness of the rural and urban sample; (2) selection of the rural and urban sample; (3) definition and ascertainment of rural and urban areas; (4) report of the rural and urban sample sizes; (5) comparability of the rural and urban sample; (6) report of mammography events; (7) effect size described; (8) assessment of mammography; (9) definition of an up-to-date mammography; and (10) adequacy of time-frame period. The total quality score ranged from 0 to 10, with higher scores within the range indicative of higher quality.
Data extraction and analysis
Data extraction was performed on studies that met eligibility criteria. The parameters that were assessed included study country, sample size, sample age, rural–urban definition employed, outcome measure, control variables, and screening rates across rural and urban areas. For the meta-analysis, data extracted on screening rates included the number of participants who had mammograms in the rural and urban sample out of the total number of participants in the rural and urban sample. In studies that included more than two classifications of the rurality of area, data on the most urban and most rural area were extracted and analyzed. In the case where these data were not presented in the article, the data were obtained by contacting the study authors. The individual studies were weighted by their sample size.
Results of whether women had ever had a mammogram and whether women had an up-to-date or recent mammogram were reviewed separately. The overall effects of residing in rural areas on mammogram rates from the studies were pooled and estimated using the Cochrane Collaboration Review Manager software, RevMan v4.1 (http://tech. cochrane.org/Revman). The Mantel–Haenszel method was employed. Heterogeneity of studies was assessed by calculation of the χ2 and I2 statistics. A random effects model
was used when the test of heterogeneity was significant. Risk of bias across studies was assessed by examination of funnel plots. Results were presented as odds ratios (OR) and 95% confidence intervals (CI). Where an adequate number of studies were present, sub-analyses were conducted stratified by country, age of sample, year of data (separate analysis for studies with data from 1990 to 1999 and 2000 to 2009), and definition of the outcome measures.
Results
Study selection
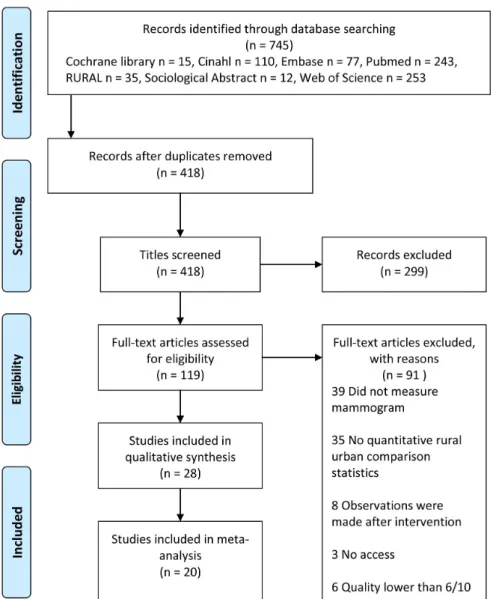
Figure 1 shows a flow chart of included papers. The search resulted in 745 articles, of which 119 met the eligibility criteria from screening the titles and abstracts. From the full text examinations of these articles, 28 studies were found to meet the inclusion criteria for the systematic review. This resulted in a total of 1 308 126 observations across the studies. Of these, a total of 20 studies (17 provided the data; 3 were requested from authors) had data available for, and were included in, the meta-analysis.
Study characteristics
Characteristics of the 28 included studies are shown in Table 1. Sample sizes of each study ranged from 238 to 409 675. Most studies used data from population-based administrative data sources, such as cancer registry databases. Other data collection methods included questionnaires and interviews13-18.
Figure 1: Flow chart of included papers identified in the review of rural–urban comparisons on breast cancer mammogram screening.
Most studies used a standardized definition of rural and urban areas, such as the United States Department of Agriculture Rural and Urban Classification codes. Other definitions included specific cities as urban areas and other specific towns or suburbs as rural areas. Four studies defined rural and urban areas based on population density, or distance to services.
There were 20 studies that were conducted in either the USA (n=16)13-15,17,19-30 or Canada (n=4)16,31-33. Other countries
represented included two studies from Korea34,35, two from
Croatia18,36, and one study each from Australia37, Estonia38,
Lebanon39, and Northern Ireland40.
Ten of the studies included women aged 40 years or older and seven studies were conducted on women in a specific age
© J Leung, S McKenzie, J Martin, D McLaughlin, 2014. A licence to publish this material has been given to James Cook University, http://www.rrh.org.au
range from 40 years (such as 40–75 and 40–80). Participants’ age in the remaining studies varied from >18 years to 60 years or older.
Quality was high, with a mean study quality evaluation score of 7.74 (standard deviation (SD)=1.13). Overall, the studies employed a population-representative sample for the rural and urban groups. Most studies controlled for key factors, such as age and year of data, and the studies controlled for a range of socio-economic variables when such data were available. Most studies clearly stated the use of a standard rural–urban classification method. One study from the USA used data from 198720. Eight studies used data from 1991 to
1999, and 19 studies used data from 2000 to 2009. Funnel plots were examined and indicated that publication bias was unlikely (Fig2).
‘Ever had a mammogram’
Eight studies compared urban and rural women in relation to whether they had ever had a mammogram (Table 2). Five studies, which were from the USA, Canada, and Australia, found that the proportion of women who had ever obtained a mammogram was greater in the urban population than in the rural population20,25,31,32,37. One study from the USA observed
no rural and urban differences in women aged 60 years or older17. Contrastingly, two studies, one from Northern
Ireland40 and one from Korea35, found that women residing in
more rural areas were more likely to have ever had a mammogram than women residing in more urban areas. Six studies had data for inclusion in the meta-analysis (Fig3)20,25,31,32,35. This resulted in 225 447 rural and 189 416
urban observations. Heterogeneity tests showed that the studies were heterogeneous, τ2=0.05, χ2(5)=109.28,
p<0.001, I2=95%. Therefore, a random effects model was
fitted. The test for overall effect was significant, Z=3.29,
p<0.001. Pooled effects results showed that the rural population had significantly lower odds of ever having a mammogram than the urban population (OR=0.74, 95%CI=0.62–0.89). For sensitivity analyses by country, only the USA and Canada had an adequate number of included
studies for a separate analysis. The effect was stronger when only including studies from the USA20,25 and
Canada31,32(OR=0.65, 95%CI=0.49–0.86).
‘Up-to-date mammogram’
There were 23 studies that compared the prevalence of up-to-date mammography service use between the rural and urban populations (Table 3). Most of the studies defined ‘up-to-date’ as having had a mammogram in the past 1 or 2 years. One study compared women who had a mammogram in the past 3 years19. All studies observed that women residing in
more urban areas were more likely to have an up-to-date mammogram than women residing in more rural areas. There were 16 studies that had data for the meta-analysis, which included 367 845 rural and 341 341 urban observations (Fig4)13-16,18-21,26,27,30,31,34,36,39,41. The studies were
heterogeneous (τ2=0.11, χ2(15)=1169.65, p<0.001,
I2=99%), justifying a random effects model. Pooled effects
results showed that rural women had significantly lower odds of having an up-to-date mammogram when compared to urban women (OR=0.59, 95%CI=0.49–0.70). Sensitivity analyses were conducted by time-frame of the outcome measure. Results were consistent across studies that defined an up-to-date mammogram as within the past year14,18,20,36,39
(OR=0.49, 95%CI=0.40–0.59) and studies that defined it as within the past 2 years13,15,16,21,26,27,30,31,34 (OR=0.60,
95%CI=0.51–0.72), though the effect was weaker in the latter. For sensitivity analyses by country, only the USA and Canada had an adequate number of included studies for a separate analysis. When only including studies from the USA13-15,19-21,26,27,30 and Canada16,31, rural women had 0.62
lower odds (95%CI=0.55–0.69) of having a recent mammogram. These results were consistent when only including studies on women aged 40 years or older (OR=0.60, 95%CI=0.53–0.67)13-16,19,21,26,30,31,34,36,39,41. In
addition, conducting the analysis stratified by data year showed consistent results (data year 1991–199914,27,31
OR=0.58, 95%CI=0.34–1.00, data year 2000–2009 OR=0.59, 95%CI=0.48–0.74).
Table 1: Characteristics of included studies that examined rural and urban differences in breast cancer screening (n=28)
Study author(s), year (reference no.)
N Data source Rural/urban definition
Adib et al., 2009 (39) 1600 Statistics Lebanon, a private survey company in Beirut
Beirut city and suburbs were urban; Akkar, Batroun, Chouf, Sour, and Zahleh districts were rural
Bennett et al., 2012 (19) 128 607 Behavioral Risk Factor Surveillance System US Department of Agriculture Economic Research Service's Urban Influence Codes
Bryant and Mah, 1992 (31) 1270 Alberta Knowledge, Attitude, and Behavior Study
Edmonton and Calgary were urban; locations ‘1–3 hours away from mammography facilities’ were rural Calle et al., 1993 (20) 12 252 National Health Interview Survey Cancer
Control Supplement
Metropolitan statistical area classification Coughlin et al., 2008 (21) 91 492 Behavioral Risk Factor Surveillance System
and Area Resource File
US Department of Agriculture classification Coughlin et al., 2002 (22) 108 326 Behavioral Risk Factor Surveillance System US Department of Agriculture classification
Coughlin et al., 2002 (23) 5840 Behavioural Risk Factor Surveillance System US Department of Agriculture Rural Urban Continuum Codes
Doescher and Jackson, 2009 (24)
409 675 Behavioral Risk Factor Surveillance System US country Federal Information Processing Standard codes. Fleming et al., 2011 (13) 698 Telephone interview Appalachian county was rural
Henderson et al., 2001 (25) 388 707 North Carolina Medicare mammography claims and enrollment files
Population density <190 residents per square mile was rural Husaini et al., 2005 (14) 326 Intervention study Nashville was urban; West Tennessee was rural
Inoue et al., 2009 (15) 521 Black Rural and Urban Caregivers Mental Health and Functioning Study
Metropolitan St Lousis was urban; Butler, Dunklin, Cape Girardeau, New Madrid, Mississippi, Pemiscot, Scott, and Stoddard Counties (<10 000 population) were rural Jackson et al., 2009 (26) 33 938 California Health Interview Survey and Food
and Drug Administration Center for Devices and Radiological Health data
California Medical Service Study Area classification
Kakefuda and Stallones, 2006 (27)
1255 Colorado Behavioral Risk Factor Surveillance System and Colorado Farm Family Health and Hazard Survey
US Department of Agriculture classification Kinnear et al., 2011 (40) 25 128 National Breast Screening System and
Northern Ireland Longitudinal Study UK official classification of settlement bands Larson and Correa-De-Araujo,
2006 (28)
9358 Medical Expenditure Panel Survey and Area Resource File
Urban Influence Code Lee et al., 2010 (34) 2583 Korea National Health and Nutrition
Examination Survey
Unclear
Mah and Bryant, 1997 (16) 1211 Telephone interview Rural areas were ‘1–3 hours from mammographic facility’ Maxwell et al., 2001 (32) 8602 National Population Health Survey Unclear
McDonald and Sherman, 2010 (33)
37 794 Canadian Community Health Survey Metropolitan-influenced zone classification. Michielutte et al. 1999 (17) 719 Interview Open country was rural; towns or citys were urban Park et al., 2011 (35) 4139 Korea National Cancer Screening Survey Classified as metropolitan, urban, or rural Polasek et al., 2007 (36) 9070 Croatian Adult Health Survey Central Bureau of Statistics classification Schootman and Fuortes, 1999
(29)
7200 Iowa Behavioral Risk Factor Surveillance System and Iowa's Surveillance, Epidemiology, and End Results
Counties with ≥100 residents per square mile were urban Schumacher et al., 2008 (30) 4957 The Education and Research Towards Health
Study
US Census definition of urbanized area Siahpush and Singh, 2002 (37) 10 179 National Health Survey Classified as metropolitan and non-metropolitan Stamenic and Strnad, 2011
(18)
924 The Mamma population-based screening program
Croatian Rural Development Strategy Classification Tekkel et al., 2007 (38) 1755 Health Behavior Study Tallinn was urban
© J Leung, S McKenzie, J Martin, D McLaughlin, 2014. A licence to publish this material has been given to James Cook University, http://www.rrh.org.au
Figure 2: Funnel plot of the six studies included for the outcome of ‘ever had a mammogram’ and the 16 studies included for the outcome of ‘up-to-date mammogram’.
Table 2: Studies comparing whether the women had ever had a mammogram between the rural and urban populations
Study author(s), year (reference no.)
Country Age (years) Data year Control variables Conclusion Quality (/10)
Bryant and Mah, 1992 (31)
Canada, Alberta
40–74 1991 None U>R* 7.5
Calle et al., 1993 (20) USA ≥18 1987 Age, race, income, education, marital status, region, employment status
U>R* 6
Henderson and Schenck, 2001 (25)
USA, North Carolina
≥65 1994–1997 Age, race, and insurance U>R* 7.5 Kinnear et al., 2011 (40) Northern
Ireland
53–64 2001 Age, marital status, health status, socio-economic status
R>U* 7.5 Maxwell et al., 2001
(32)
Canada 50–69 1996–1997 Age, household income, education, country of birth, presence of regular physician, medical consultations, blood pressure check, hormone drug use, smoking, and physical activity
U>R* 7
Michielutte et al. 1999 (17)
USA ≥60 <1999 Age, race, education, marital status, insurance, knowledge of breast cancer and screening, medical factors, attitudes towards screening, and transport and cost barriers.
R=U 9.5
Park et al., 2011 (35) Korea 40–74 2005–2009 Age, marital status, education, household income, and private health insurance
R>U 7
Siahpush and Singh, 2002 (37)
Australia ≥40 1995 Doctor consultation, age, marital status, country of birth, area-level socio-economic status, and education
U>R* 7
Figure 3: Meta-analysis results of ‘ever had a mammogram’ between the rural and urban populations.
Discussion
The aim of the present study was to review the existing literature on rural and urban differences in mammogram use. Our analyses indicate strong and consistent evidence of differences in mammogram uptake between women residing in rural and urban areas in a number of developed countries. These differences remained consistent even when the mammographic services offered in each country may not have been directly comparable in terms of cost and availability. The rural disadvantage on the ever use of a mammogram was only observed in the USA, Canada, and Australia. However, the observation that women residing in rural areas were less likely than their urban counterparts to have had a recent mammogram was found across all the included studies. These findings are consistent with a previous review showing urban–rural disparities in breast cancer treatment and experience9.
Although the focus of the present paper was on comparisons of rural and urban women across many different systems, it is important to note that countries differ in the preventive public health services that are available. The importance of this work is that, within a country, differences in mammogram use are likely to play a key role in differential rates of early detection and diagnosis of breast cancer11,42. The data in this study therefore
provide evidence for policy makers when deciding on allocation of screening resources.
A number of limitations should be considered when interpreting the findings of this paper. Firstly there is heterogeneity among studies, although this is to be expected
because of the diversity of study settings. However, the meta-analysis results were consistent with the systematic review findings, and so the observed heterogeneity was unlikely to change the interpretation of the findings. While there are criticisms of wide variation of the definition of ‘rurality’ in previous research9, in the current review, most studies
employed a national level standard definition. Internationally, the standard classification methods of rurality were similar and were commonly based on distance to major service areas and population density.
Another discrepancy in the reviewed studies was the age of the sample. Some studies included women who were 18 years and older, while others examined only women who were 60 years and older. Nevertheless, the urban and rural differences in mammogram use were generally consistent across studies of different age groups. Most studies examined breast screening service use in women from 40 years of age onwards, as population health breast screening programs are often targeted to women of this age group. Our meta-analysis on studies that include women from 40 years revealed a rural disadvantage in mammography use. Studies that focused on particular age groups have merit over studies that simply include women across all ages, as the guidelines and public health recommendations and services available to women in different age groups are different11,42. Our search
strategy was limited to English language publications, thus we may have overlooked studies that were indexed in other languages, or that appeared in electronic databases that were not accessed. Cultural variations in screening or assessment could affect results.
© J Leung, S McKenzie, J Martin, D McLaughlin, 2014. A licence to publish this material has been given to James Cook University, http://www.rrh.org.au
Table 3: Studies comparing the prevalence of ‘up-to-date mammogram’ between the rural and urban populations
Study author(s), year (reference no.)
Country Age
(years)
Data year Outcome
measure of up-to-date mammogram
Control variables Conclusion Quality
(/10)
Adib et al., 2009 (39) Lebanon ≥40 2000-2005 Past 1 year None U>R* 6
Bennett et al., 2012 (19)
USA 40–75 2008 Past 3 years Age, education, employment status, insurance, marital status, language, income, medical care service use and supply, and region
U>R* 8
Bryant and Mah, 1992 (31)
Canada, Alberta
40–74 1991 Past 2 years Age, education, income, and marital status U>R* 7.5 Calle et al., 1993 (20) USA ≥18 1987 Past 1 year Age, race, income, education, marital status,
region, employment status
U>R* 6
Coughlin et al., 2008 (21)
USA ≥40 2002 Past 2 years Age, race, marital status, education, income, number of persons in household, insurance, number of health centers
U>R* 8
Coughlin et al., 2002 (22)
USA ≥40 1998–1999 Past 2 years Year, age, race, marital status, education, household, employment status, smoking, physician consultation, and health insurance
U>R* 9
Coughlin et al., 2002 (23)
USA ≥18 1998–2000 Past 2 years Age, year U>R* 10
Doescher and Jackson, 2009 (24)
USA ≥40 1994–2000,
2002, 2004
Past 2 years Age, race, education, income, employment status, region, self-reported health, health insurance
U>R* 8
Fleming et al., 2011 (13)
USA, Kentucky ≥42 2008 Past 2 years Age, race, and education U>R 9
Husaini et al., 2005 (14)
USA, Nashville and West Tennessee
≥40 1998–2000 Past 1 year None U>R* 6.5
Inoue et al., 2009 (15) USA ≥40 1999–2002 Past 2 years None U>R* 9.5
Jackson et al., 2009 (26)
USA, California
40–84 2003, 2005 Past 2 years Year, age, race, marital status, income, language, breast cancer history, health insurance, source of care, census level
U>R* 8
Kakefuda and Stallones, 2006 (27)
USA, Colorado ≥24 1993, 1997 Past 2 years Age, race, education, marital status, general health, insurance, financial barriers, and primary source of medical care
U>R* 8.5
Larson and Correa-De-Araujo, 2006 (28)
USA ≥40 2000 Past 1 and 2 years Age, marital status, race, income, health status, usual source of care, physicians per capita, education, and insurance
U>R* 7.5
Lee et al., 2010 (34) Korea ≥40 2005 Past 2 years None U>R 8.5
Mah and Bryant, 1997 (16)
Canada, Alberta
40–75 Unclear, <1997
Past 2 years Belief that symptoms are needed for mammograms, ability to encourage a friend to have a mammogram, belief that few women are being screened
U>R* 8.5
McDonald and Sherman, 2010 (33)
Canada 40–69 2002–2005 Past 2 years Age, marital status, immigrant, ethnicity, language, income, education
U>R* 8.5 Polasek et al., 2007
(36)
Croatia 40–80 2003 Past 1 year Age, education, occupation, access, and income
U>R* 7
Schootman and Fuortes, 1999 (29)
USA, Iowa ≥18 1996–1997 Past 1–2 years Age, education, income, and insurance U>R* 7 Schumacher et al.,
2008 (30)
USA, Southwest USA and Alaska
≥40 2004–2007 Past 2 years Age, location, education, tobacco use, medical conditions, income
U>R* 7
Siahpush and Singh, 2002 (37)
Australia ≥40 Past 2 years for
women over 40 years, past 1 year for women aged over 50 years
Doctor consultation, age, marital status, country of birth, area level socioeconomic status, and education
U>R* 7
Stamenic and Strnad, 2011 (18)
Croatia 50–69 2007–2009 Past 1 year None U>R* 9
Tekkel et al., 2007 (38)
Estonia 16–64 2004 Past 2 years None U>R* 6
Figure 4: Meta-analysis results of ‘up-to-date mammogram’ between the rural and urban populations.
A strength of the included studies was that many employed large national-level data sources, which allowed for adequate power. In addition, many of the reviewed studies controlled for socio-demographic variables, a potentially important factor as rural populations are often characterized by lower socio-economic status43.. While there are numerous studies
on rural and urban differences in breast screening conducted in the USA and Canada, research in other countries is rare, although our review showed that the rural disadvantage in mammogram screening is likely to be an issue across several countries.
Research comparing rural and urban differences in breast screening rates in the population has only received research attention in recent years. To date, no studies have followed rural and urban women to ascertain if they consistently follow breast screening guidelines over time. As long-term adherence to breast screening guidelines is recommended, longitudinal studies to examine how urban and rural women engage in mammographic screening are warranted.
Conclusions
This review showed a difference in the use of mammograms in rural compared to urban women across several countries. Although there were limitations in terms of different healthcare systems in which the work was undertaken, a rural disadvantage in up-to-date mammogram use was observed internationally. However, it is clear from the analysis that more studies on rural and urban comparisons on breast screening are needed in countries other than the USA and Canada. Mammographic screening is an important step in the early detection and diagnosis of breast cancer, and future studies could also explore influences, such as physical or psychosocial factors, that may affect mammogram use in rural areas.
Acknowledgements
The research on which this paper is based was conducted as part of the Australian Longitudinal Study on Women’s Health
© J Leung, S McKenzie, J Martin, D McLaughlin, 2014. A licence to publish this material has been given to James Cook University, http://www.rrh.org.au
by the University of Newcastle and the University of Queensland. We are grateful to the Australian Government Department of Health and Ageing for funding. The funding source has no role in conducting the study. We thank Roslyn Boyd, Lars Eriksson, and Lavinia Pitic for their advice and assistance on systematic reviews.
References
1. Hall S, Holman CD, Sheiner H. The influence of socio-economic and locational disadvantage on patterns of surgical care for lung cancer in Western Australia 1982–2001. Australian Health Review
2004; 27(2): 68-79.
2. Mitchell KJ, Fritschi L, Reid A, McEvoy SP, Ingram DM, Jamrozik K et al. Rural–urban differences in the presentation, management and survival of breast cancer in Western Australia.
Breast 2006; 15(6): 769-776.
3. Reynolds P, Hurley SE, Quach AT, Rosen H, Von Behren J, Hertz A, et al. Regional variations in breast cancer incidence among California women, 1988–1997. Cancer Causes & Control 2005; 16(2):
139-50.
4. Hall SA, Kaufman JS, Ricketts TC. Defining urban and rural areas in U.S. epidemiologic studies. Journal of Urban Health 2006;
83(2): 162-75.
5. Connelly RR. Patterns in urban and rural cancer incidence. Basic Life Sciences 1982; 21: 61-92.
6. Dey S, Soliman AS, Hablas A, Seifeldein IA, Ismail K, Ramadan M, et al. Urban–rural differences in breast cancer incidence in Egypt (1999-2006). Breast 2010; 19(5): 417-23.
7. Melton LJ, 3rd, Brian DD, Williams RL. Urban–rural differential in breast cancer incidence and mortality in Olmsted County, Minnesota, 1935–1974. International Journal of Epidemiology
1980; 9(2): 155-158.
8. Risser DR. Cancer incidence and mortality in urban versus rural areas of Texas, 1980 through 1985. Texas Medicine 1996; 92(1): 58-61.
9. Bettencourt BA, Schlegel RJ, Talley AE, Molix LA. The breast cancer experience of rural women: a literature review. Psycho-Oncology 2007; 16(10): 875-887.
10. Bleyer A, Welch HG. Effect of three decades of screening mammography on breast-cancer incidence. New England Journal of Medicine 2012; 367(21): 1998-2005.
11. World Health Organization. Screening and early detection of cancer. (Online) 2012. Available: http://www.who.int/cancer/ detection/en/ (Accessed 20 January 2012).
12. Ottawa Hospital Research Institue. The Newcastle-Ottawa Scale (NOS) for assessing the quality of nonrandomized studies in meta-analyses. (Online) 2011. Available: http://www.ohri.ca/ programs/clinical_epidemiology/oxford.asp (Accessed 1 November 2011).
13. Fleming ST, Love MM, Bennett K. Diabetes and cancer screening rates among Appalachian and non-Appalachian residents of Kentucky. Journal of the American Board of Family Medicine 2011;
24(6): 682-692.
14. Husaini BA, Emerson JS, Hull PC, Sherkat DE, Levine RS, Cain VA. Rural–urban differences in breast cancer screening among African American women. Journal of Health Care for the Poor and Underserved 2005; 16(4 Suppl A): 1-10.
15. Inoue M, Pickard JG, Welch-Saleeby P, Johnson S. African-American caregivers’ breast health behavior. Health Education Research 2009; 24(5): 735-747.
16. Mah Z, Bryant HE. The role of past mammography and future intentions in screening mammography usage. Cancer Detection and Prevention 1997; 21(3): 213-220.
17. Michielutte R, Dignan MB, Smith BL. Psychosocial factors associated with the use of breast cancer screening by women age 60 years or over. Health Education and Behavior 1999; 26(5): 625-647.
18. Stamenic V, Strnad M. Urban–rural differences in a population-based breast cancer screening program in Croatia. Croatian Medical Journal 2011; 52(1): 76-86.
19. Bennett KJ, Probst JC, Bellinger JD. Receipt of cancer screening services: surprising results for some rural minorities.
20. Calle EE, Flanders WD, Thun MJ, Martin LM. Demographic predictors of mammography and Pap smear screening in US women. American Journal of Public Health 1993; 83(1): 53-60.
21. Coughlin SS, Leadbetter S, Richards T, Sabatino SA. Contextual analysis of breast and cervical cancer screening and factors associated with health care access among United States women, 2002. Social Science and Medicine 2008; 66(2): 260-275.
22. Coughlin SS, Thompson TD, Hall HI, Logan P, Uhler RJ. Breast and cervical carcinoma screening practices among women in rural and nonrural areas of the United States, 1998–1999. Cancer
2002; 94(11): 2801-2812.
23. Coughlin SS, Thompson TD, Seeff L, Richards T, Stallings F. Breast, cervical, and colorectal carcinoma screening in a demographically defined region of the southern U.S. Cancer 2002;
95(10): 2211-2222.
24. Doescher MP, Jackson JE. Trends in cervical and breast cancer screening practices among women in rural and urban areas of the United States. Journal of Public Health Management and Practice 2009;
15(3): 200-209.
25. Henderson LM, Schenck AP. Identifying and characterizing one-time and never users of mammography screening services among medicare eligible women. Preventive Medicine 2001; 32(6): 529-533.
26. Jackson MC, Davis WW, Waldron W, McNeel TS, Pfeiffer R, Breen N. Impact of geography on mammography use in California.
Cancer Causes and Control 2009; 20(8): 1339-1353.
27. Kakefuda I, Stallones L. Comparisons of Colorado women’s cancer screening practices by residence: metropolitan, non-metropolitan, and farm. Journal of Agricultural Safety and Health
2006; 12(1): 59-69.
28. Larson S, Correa-De-Araujo R. Preventive health examinations: a comparison along the rural–urban continuum.
Women’s Health Issues 2006; 16(2): 80-88.
29. Schootman M, Fuortes LJ. Breast and cervical carcinoma – the correlation of activity limitations and rurality with screening, disease incidence, and mortality. Cancer 1999; 86(6): 1087-1094.
30. Schumacher MC, Slattery ML, Lanier AP, Ma KN, Edwards S, Ferucci ED, et al. Prevalence and predictors of cancer screening among American Indian and Alaska native people: the EARTH study. Cancer Causes and Control 2008; 19(7): 725-737.
31. Bryant H, Mah Z. Breast cancer screening attitudes and behaviors of rural and urban women. Preventive Medicine 1992;
21(4): 405-418.
32. Maxwell CJ, Bancej CM, Snider J. Predictors of mammography use among Canadian women aged 50–69: findings from the 1996/97 National Population Health Survey. Canadian Medical Association Journal 2001; 164(3): 329-334.
33. McDonald JT, Sherman A. Determinants of mammography use in rural and urban regions of Canada. Canadian Journal of Rural Medicine 2010; 15(2): 52-60.
34. Lee K, Lim HT, Park SM. Factors associated with use of breast cancer screening services by women aged (greater-than or equal to) 40 years in Korea: The Third Korea National Health and Nutrition Examination Survey 2005 (KNHANES III). BMC Cancer 2010;10:
144-154.
35. Park MJ, Park EC, Choi KS, Jun JK, Lee HY. Sociodemographic gradients in breast and cervical cancer screening in Korea: the Korean National Cancer Screening Survey (KNCSS) 2005–2009. BMC Cancer 2011; 11: 257.
36. Polasek O, Kolcic I, Voncina L, Strnad M, Vuletic S, Kern J. Breast, colon, and prostate screening in the adult population of Croatia: does rural origin matter? Rural and Remote Health 2007;
7(3): 749.
37. Siahpush M, Singh GK. Sociodemographic variations in breast cancer screening behavior among Australian women: results from the 1995 National Health Survey. Preventive Medicine 2002; 35(2):
174-180.
38. Tekkel M, Veideman T, Baburin A, Rahu M. Use of mammography and Pap smear in Estonia, a country without organized cancer screening. International Journal of Public Health
2007; 52(2): 109-116.
39. Adib SM, Sabbah MA, Hlais S, Hanna P. Research in action: mammography utilization following breast cancer awareness campaigns in Lebanon 2002–05. Eastern Mediterranean Health Journal
2009; 15(1): 6-18.
40. Kinnear H, Rosato M, Mairs A, Hall C, O’Reilly D. The low uptake of breast screening in cities is a major public health issue and may be due to organisational factors: a Census-based record linkage study. Breast 2011; 20(5): 460-463.
© J Leung, S McKenzie, J Martin, D McLaughlin, 2014. A licence to publish this material has been given to James Cook University, http://www.rrh.org.au
41. Siahpush M, Singh GK. Sociodemographic variations in breast cancer screening behavior among Australian women: results from the 1995 National Health Survey. Preventive Medicine 2002; 35(2):
174-180.
42. National Breast Cancer Foundation. Clinical breast exam. (Online) 2012. Available: http://www.nationalbreastcancer.org/ clinical-breast-exam (Accessed 11 December 2012).
43. Australian Institute of Health and Welfare. Rural, regional and remote health: indicators of health system performance. Canberra: Australian Institute of Health and Welfare, 2008.