© 2020 by University of Niš, Serbia | Creative Commons License: CC BY-NC-ND
UDC: 811.111'276.6:371.3 https://doi.org/10.22190/JTESAP2002135D
LEARNERS’ PERCEPTIONS OF PERFORMANCE IN MAJOR
SPEAKING ACTIVITIES AT TERTIARY LEVEL
Irena Darginavičienė1, Jolita Šliogerienė2 1Mykolas Romeris University, Lithuania
E-mail: [email protected]
2Vilnius Gediminas Technical University, Lithuania E-mail: [email protected]
Abstract. The objective of the research is to explore learners‘ attitudes to their performance in oral class activities at tertiary level. The research method employed the survey on key speaking issues such as spontaneous speaking, short talks, participation in discussions or debates, and delivering PPPs on professional topics. The learners were asked to assess their performance in speaking on the 5-point Likert scale ranging from ‘very difficult’ to ‘very easy’ and reflect on the difficulties they faced while speaking in front of the audience. The respondents are 145 full-time students of two specializations who study at the VGTU, Vilnius. Different methods of statistical treatment of students’ responses by a means of the SPSS procedures have been analyzed with the aim of selecting the appropriate one for the obtained data. Computations of the Student’s test yield critical t-values that indicate that the obtained data are significant at the probability of 95%. Learners’ reflections on speaking difficulties indicate fear of making mistakes, lack of self-confidence, shortage of ideas, and complexity of topics.
Key words: English speaking skills, perceptions of difficulties, oral performance
1.INTRODUCTION
Speaking is a productive skill which is considered to be difficult to master. It is one of the most important skills that are needed to be learnt as a means of effective communication. Many language learners find it difficult to express themselves in formal spoken English. There might be a number of reasons that deter speaking competence such as a poor vocabulary, insufficient knowledge of grammar, fear of making mistakes, lack of self-confidence, fear of losing face in front of the audience. The English language instructors are aware of the fact that English proficiency of undergraduates is much to be desired despite the advantages of computerization and multimedia resources in the 21st century. In spite of the learners‟ mastery of spoken English in communication, the necessity for teaching fluency and accuracy are essential if language practitioners expect learners to perform adequately in using English for professional purposes.
This paper aims at researching learners‟ perceptions of difficulties in using spoken English for professional purposes. The results have been obtained from a survey that was completed by the full-time students of two specializations, who studied English for Specific
Purposes (ESP) in 2019 at Vilnius Gediminas Technology University (VGTU), and students‟ written self-reflections on classroom speaking activities. Statistical processing using the SPSS software has been conducted. The comparison of the samples‟ means involved computations of the student„s critical t-values and evaluation of the significance level.
2.THEORETICAL BACKGROUND
Learning a language and being able to speak it do not go hand in hand. S. Thornbury (2005) provides both structured activities to get students speaking and ideas for developing confidence in using English outside the classroom. He examines the different approaches and activities that can be used for teaching speaking as articulation, fluency and register, and analyzes classroom techniques of drilling, discussions, drama, dialogues and conversation.
The ability to speak fluently in a foreign language implies knowledge of language features and the ability to process information „here and now‟. A success in spoken production depends on rapid mental and social processing skills (Harmer, 2001). Language processing involves retrieval of lexis from memory. Communication involves interaction with other speakers, appropriate vocabulary, understanding how to take turns and how others feel about the topic under consideration. Information processing on the spot requires the ability to respond immediately and being aware of unwritten cultural rules.
According to T. Gregersen & E. Horwitz (2009), EFL students might encounter various problems in the way of the development of their speaking skills. Evidence was gathered
suggesting that anxious and non‐anxious learners differ in their personal performance
standards, procrastination, fear of evaluation, and concern over errors. Anxiety negatively
affects learners‟ oral performance.
M. Senel (2012) conducted a study on 32 Turkish EFL students to investigate their oral communication problems. The findings of the study revealed that the students believed that such factors as instructors‟ interruption and error correction, lack of native instructors, instructors‟ methods and techniques of teaching, insufficient number of English courses and their inadequate content, and insufficient use of English outside the classroom hindered their progress in oral communication skills.
The relationship between spoken language research and ELT practice over the last 20 years was examined by I. Timmis (2012), who showed that the majority of students prefer native speaker norms on a general level. It is argued, however, that more classroom research is needed in order to determine how explicit the treatment of spoken language should be and what activities are beneficial.
G. Kavaliauskienė (2013) explored the students‟ attitudes to developing speaking skills in ESP classes. Her research employed the questionnaire on learner attitudes to different speaking activities in the classroom. The students were asked to indicate the degree of difficulty they had with the various speaking activities on the Likert scale ranging from „very difficult‟ (1) to „very easy‟ (5). The results included the students‟ responses obtained in three academic years of 2010, 2011 and 2012. The attitudes of students to different activities vary: they are more positive to short talks and discussions than to spontaneous speaking.
pragmatics is often overlooked in the classroom and underrepresented in teaching materials and teacher education courses. Reasons include insufficient class time, lack of interest, or inadequate recognition of its importance in interpersonal communication. While teachers may recognize the importance of pragmatics and want to use it in their lessons, many are unsure how to select and incorporate pragmatic teaching activities in EFL classes. J. Siegel (2016) suggested a number of classroom activities that can be incorporated into speaking lessons to target pragmatic development and prepare students to interact with a range of interlocutors and within varying contextual factors.
H. S. Afshar & A. Asakereh (2016) investigated the speaking skills problems faced by Iranian EFL freshmen and seniors. Total of 238 Iranian EFL students (138 freshmen and 100 seniors) and 30 English instructors from various universities participated in the study by completing a questionnaire, which consisted of 35 items. It covers socially-related, instructor-related, linguistically-related and facility-related items. Various SPSS procedures of score analysis were conducted. According to the researchers, the t-test results and Chi-square analyses showed that there was no significant difference between the freshmen and the seniors‟ perceptions of their speaking skills problems. However, the researchers seemed to have failed to check the validity of assumptions for statistical processing. Therefore, their computation of t-test yielded the significance level 0.718 >0.05, which means that the obtained probability is 68%, but only 95% should be valid.
The cooperative principle describes how people achieve effective conversational communication in common social situations, in other words, how listeners and speakers act and mutually accept each other. P. Grice (1975) introduced the cooperative principle in his theory and formulated communication maxims as follows: 1) maxim of quantity (quantity of information): give the most helpful amount of information; 2) maxim of quality (quality of information): do not say what you believe to be false; 3) maxim of relation (be relevant);
4) maxim of manner: put what you say in the clearest, briefest, and most orderly manner. Despite being formulated a long time ago, these maxims are relevant for developing speaking skills, and learners must be aware of them. The recent paper by J. Siegel‟ team (2019) practically applies key components of Grice‟s maxims and the use of speech acts for consciousness raising and instruction. The authors encourage learners to assess and reflect on their pragmatic abilities. Some examples demonstrate how to enhance learners‟ spoken pragmatic ability.
The willingness of the students to engage in spontaneous communication with the teacher was described by the Hungarian and Turkish teachers (Illes and Akcan, 2017).Their findings confirm that, when allowed, students show a desire to engage in off-topic conversation and playful talk in the language class. The authors believe that teachers should create and exploit opportunities for naturally occurring interaction in English classes. S. Hanson (2017) suggests using a pair counting technique that is a quick, easy, interactive, and motivating way to help students work on spoken fluency.
3.THE RESEARCH METHODOLOGY
This article aims at researching the undergraduates‟ perceptions of using their speaking skills for key activities in English classes and self-reflections on their performance.
To gain insights into the students‟ experience of learning ESP at a university in Lithuania, a quantitative research was conducted and students‟ perception was analysed. The data were collected through the structured feedback questionnaires that were filled in by the students at the end of the course of ESP and analysed using the Statistical Package for Social Sciences (SPSS version 22).
3.1. The context of the study
A total of 145 Lithuanian 1st year undergraduate students of VGTU participated in this study. There were 95 students, who studied the course of IT program, and 50 students who selected the program of Creative Industry (CI) program. The students‟ ages ranged from 19 to 21. The majority of students were male due to the fact that study programs appeal to males more than to females.
The questionnaire employed for the data collection consisted of closed questions. It was the same one that was used in the research performed previously by G. Kavaliauskiene in 2013. This survey was designed in accordance with the accepted standards of constructing surveys (Dörnyei, 2003). All the statements of the survey are presented on a Likertscale ranging from 1 (very difficult) to 5 (very easy).
The limitation of the study is that it was conducted in one Lithuanian university where ESP is a mandatory study subject in all undergraduate study programmes, which does not allow for generalisations on the scale of Lithuanian higher education.
3.2. Data analysis
The data collected through the structured feedback questionnaires were analysed using Likert five-point scale ranging from “very difficult” to “very easy” and statistical data analyses, including the analysis of variance (ANOVA), the statistical analysis for the estimation of correlation between variables (Pearson and Spearman correlation), t-test.
Various SPSS procedures of score analysis were conducted. According to the researchers, the t-test results and Chi-square analyses showed that there was no significant difference between the freshmen and the seniors‟ perceptions of their speaking skills problems.
4.RESEARCH RESULTS
This part of the article presents the data obtained from the survey. There are 4 Charts here that show the frequencies of learners‟ responses.
Short talks
Chart 1 Frequency of responses of IT and CI groups to the short talk activity. Blue bars show responses of IT group (sample 1), and red bars show the responses of CI group (sample 2).
Improptu speaking
Chart 2 Frequency of responses of IT and CI groups to the impromptu speaking activity. Blue bars show responses of IT group (sample 1), and red bars show the responses of CI group (sample 2).
Impromptu speaking means speaking without prior preparation. The results of students‟ perceptions of their class activities on speaking impromptu are shown in Chart 2. It may be seen that 36% of IT group learners are not sure of their abilities of speaking without being prepared, and 52% of CI group are also uncertain. The third of the sample 2 believes it difficult or very difficult. However, 51% of IT group find this activity easy or very easy.
Discussions / Debates
Chart 3 Frequency of responses of IT and CI groups to participating in discussions or debates activities. Blue bars show responses of IT group (sample 1), and red bars show the responses of CI group (sample 2).
PPPs belong to the activities prepared in advance of classroom performance. This simplifies their delivery. As it can be seen in Chart 4, 73% of IT group and 65% of CI group find PPP delivery either easy or very easy. Only a small minority of 15% and 14%, respectively, are not sure, and some (11% and 16%, respectively) think them difficult.
Power Point Presentations
Chart 4 Frequency of responses of IT and CI groups to preparing and delivering PPPs. Blue bars show responses of IT group (sample 1), and red bars show the responses of CI group (sample 2).
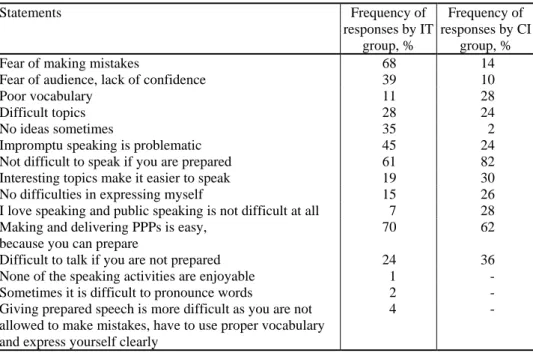
Table 1 Brief reflection by the respondents of both specializations
Statements Frequency of
responses by IT group, %
Frequency of responses by CI
group, %
Fear of making mistakes 68 14
Fear of audience, lack of confidence 39 10
Poor vocabulary 11 28
Difficult topics 28 24
No ideas sometimes 35 2
Impromptu speaking is problematic 45 24
Not difficult to speak if you are prepared 61 82
Interesting topics make it easier to speak 19 30
No difficulties in expressing myself 15 26
I love speaking and public speaking is not difficult at all 7 28 Making and delivering PPPs is easy,
because you can prepare
70 62
Difficult to talk if you are not prepared 24 36
None of the speaking activities are enjoyable 1 -
Sometimes it is difficult to pronounce words 2 -
Giving prepared speech is more difficult as you are not allowed to make mistakes, have to use proper vocabulary and express yourself clearly
4 -
For the application of the appropriate statistical treatment to the survey results it is necessary to examine histograms, i.e. the distribution of responses in the studied samples. The key assumption of the SPSS (Statistical Package for Social Sciences) procedures is a normal, a bell-shaped distribution of data. For the sake of brevity, four simplified histograms are shown below.
Histogram 1 refers to the sample 2 (50 respondents) and displays the normal, bell-shaped distribution of responses (scores). The maximum score of this histogram is at the point 3 of Likert scale. For comparison, Histogram 2 shows the responses on the same issue of short talks for the sample 1 (95 respondents). Its maximum score is at the point 4 of Likert scale. This distribution is negatively skewed, i.e. a negative skewness indicates that the size of the left-handed tail is larger than the right-handed tail (McNeese, 2016).
Histogram 2 Scores for the sample 1 (95 respondents)
Histogram 3 shows the distribution of responses on discussions/debates issue by the students of IT specialization. This distribution is negatively skewed but differs by its scores values in the tail from the results shown in Histogram 2.
Histogram 3 Scores for the sample 1 (95 respondents)
The data in Histogram 4 refer to the sample 2 (50 respondents). It may be seen that the distribution of scores in Histogram 4 is positively skewed: its maximum is at the point 2 of Likert scale.
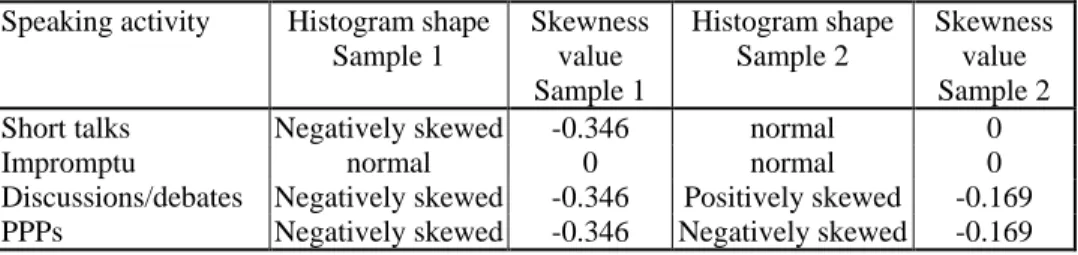
As it has already been mentioned, the skewness describes the shape of the distribution and is called „shape‟ statistics. Having analyzed all the histograms, which are not shown for the sake of brevity, we present the detailed information in Table 2. It may be seen that
normal distribution is found for impromptu speaking in both samples and for short talks in the sample 2. The rest of analyzed histograms reveal either a negatively or positively skewed distribution.
Table 2 Shapes of histograms for speaking activities in both samples
Speaking activity Histogram shape Sample 1
Skewness value Sample 1
Histogram shape Sample 2
Skewness value Sample 2 Short talks Negatively skewed -0.346 normal 0
Impromptu normal 0 normal 0
Discussions/debates Negatively skewed -0.346 Positively skewed -0.169 PPPs Negatively skewed -0.346 Negatively skewed -0.169
It is necessary to emphasize that the values of skewness are dependent on the shape and sample size. Skewness for normal distribution is equal to 0. According to B. McNeese (2016), the computed values of the skewness for the sample of 50 respondents is equal to -0.169, while for the sample of 95 respondents it is equal to -0.346. These distributions might be considered fairly symmetrical since their skewness is between -0.5 and 0.5 (McNeese, 2016). Another difficulty for selecting an appropriate SPSS procedure in this research is the unequal sizes of the samples, which might create problems for the interpretation of data (Glen, 2015) if not dealt with. Thus, having analyzed the possible statistical procedures for the computation of the scores in this research, the selection of the student‟s t-test seems to be appropriate.
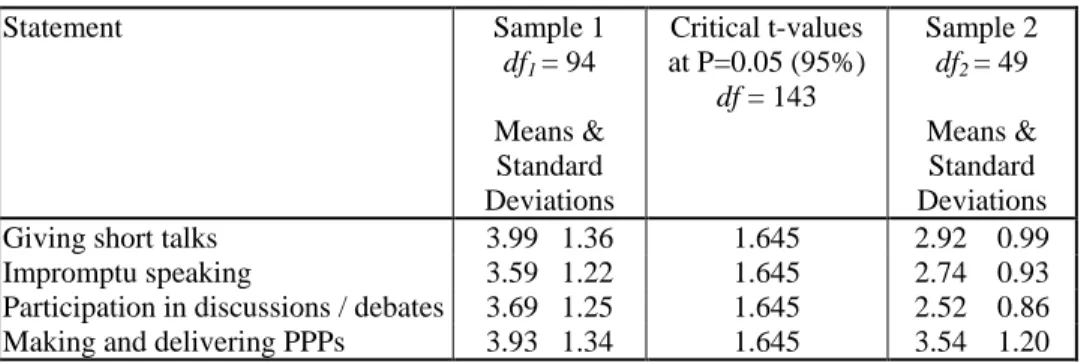
Computation of the student’s t-test
The results of the SPSS computations of the student‟s t-test are presented in Table 3. The group sizes have been adjusted by degrees of freedom df. The value of df1 for sample
1 is 94 (one is subtracted from the number of respondents), and the value of df2 for
sample 2 is equal to 49 (one is subtracted from the number of respondents). Adjusting for unequal group sizes, the resulting degree of freedom df = df1 + df2 is equal to their sum
Table 3 The results of t-test computations
Statement Sample 1
df1 = 94
Means & Standard Deviations
Critical t-values at P=0.05 (95%)
df = 143
Sample 2
df2 = 49
Means & Standard Deviations Giving short talks 3.99 1.36 1.645 2.92 0.99 Impromptu speaking 3.59 1.22 1.645 2.74 0.93 Participation in discussions / debates 3.69 1.25 1.645 2.52 0.86 Making and delivering PPPs 3.93 1.34 1.645 3.54 1.20
5. DISCUSSION AND CONCLUSIONS
The current research explored the respondents‟ attitudes to oral performance in English classes. The data have been obtained from a survey on speaking activities and learners‟ self-reflections on their performance. The speaking activities include spontaneous speaking, short talks, participation in class discussions or debates, and delivering Power Point Presentations on professional issues. The majority of the respondents find PPPs easy or very easy (73% and 65%, respectively). The students are not certain of their competence in speaking spontaneously (36% and 52%, respectively). The SPSS student‟s t-test processing has been employed to compare the means of two samples. The computation results confirmed that the means are significantly meaningful and comparable. The key difficulties that students face in class include fear of making mistakes (68%), lack of confidence and fear of audience (39%), difficult topics (28% and 24%, respectively), and sometimes lack of ideas (35%). These factors influence students‟ participation in class: they never or rarely participate in class, they seldom ask questions. Such a situation may have negative effect on their learning.
REFERENCES
Afshar, H.S. and Asakereh, A. 2016. Speaking Skills Problems Encountered by Iranian EFL Freshmen and Seniors from their Own and Their English Instructors Perspectives.
Electronic Journal of Foreign Language Teaching. Vol. 13, No 1, pp. 112-130. http://e-flt.nus.edu.sg/v13n12016/afshar.pdf
Bachman, L.F. 2005. Statistical Analyses for Language Assessment, Cambridge University Press.
Brown, J.D. and T. S. Rodgers. 2002. Doing Second Language Research. Oxford University Press.
Dörnyei, Z. 2003. Questionnaires in Second Language Research. Lawrence Erlbaum Inc. Publisher.
Glen, S. 2015. Problems with Unequal Sample Sizes.https://www.statisticshowto. datasciencecentral.com/unequal-sample-sizes/
Modern Language Journal, 86(4), 562–570. https://onlinelibrary.wiley.com/doi/ 10.1111/1540-4781.00161
S. Hanson. 2017. Pair Counting to Improve Grammar and Spoken Fluency. English Teaching Forum. Vol. 55, No 4. https://americanenglish.state.gov/resources/english-teaching-forum-2017-volume-55-number-4
Harmer, J. 2001. The Practice of English Language Teaching. 3rd edition. Longman. Hopkins, J. Chi-Square Statistic: How to Calculate It / Distribution.
https://www.statisticshowto.datasciencecentral.com/probability-and-statistics/chi-square/ Illes, E. and S. Akcan. 2017. Bringing real-life language into EFL classrooms. ELT
Journal, Vol., Issue 1, pp. 3–12. https://academic.oup.com/eltj/article/71/1/3/2447417 Kavaliauskiene, G. 2013. Ongoing Research into Speaking Skills. ESP-World. Issue 38. Vol. 14. http://www.espworld.info/Articles_38/Abstracts/Kavaliauskiene_Ongoing_Research_ into_Speaking_Skills.htm
McNeese, B. 2016. Are the Skewness and Kurtosis Useful Statistics? https://www.spcforexcel. com/knowledge/basic-statistics/are-skewness-and-kurtosis-useful-statistics
Senel, M. 2012. Oral Communication Anxiety and Problems of Turkish EFL Learners at Samsun 19 Mayis University, ELT department. Frontiers of Language and Teaching, 3, 49–58.
Siegel, J. 2016. Pragmatic Activities for the Speaking Classroom. English Teaching Forum, vol. 54, No 1.
https://americanenglish.state.gov/files/ae/resource_files/etf_54_1_pg12-19.pdf
Siegel J., J. Broadbridge, M. Firth. 2019. Saying it ‚just right„: teaching for pragmatic success in ELT. ELT Journal, vol. 73, Issue 1, pp.31-40. https://academic.oup.com/eltj/ article-abstract/73/1/31/4995517?redirectedFrom=fulltext
Timmis, I. 2012. Spoken Language Research and ELT: Where Are We Now? ELT Journal. 66/4:514-522. https://academic.oup.com/eltj/articleabstract/66/4/514/385246 ?redirectedFrom=fulltext