UMT Consulting Group
Reporting with
Microsoft Project
Server 2010
Andrew Lavinsky, MVP (Project), PMP
3/1/20112 This document is provided “as-is”. Information and views expressed in this document, including URL and other Internet Web site references, may change without notice. You bear the risk of using it.
Some examples depicted herein are provided for illustration only and are fictitious. No real association or connection is intended or should be inferred.
This document does not provide you with any legal rights to any intellectual property in any Microsoft product. You may copy and use this document for your internal, reference purposes.
Table of Contents
1. Foreword ... 5
2. Executive Summary ... 7
Introducing Microsoft BI Insights ... 7
Identifying the Available Data ... 8
Selecting an Appropriate Tool ... 9
3. Project Center Views ... 12
Tips and Tricks: Project Center Views ... 13
4. The Project Server Database ... 16
Tables ... 16
Tips and Tricks: Reporting Against the Database ... 17
OLAP Cubes ... 20
Tips and Tricks: OLAP Cubes ... 20
ODC Files ... 20
Tips and Tricks: ODC Files ... 24
5. Excel & Excel Services ... 27
Tips and Tricks: Excel Services ... 30
6. Visio & Visio Services ... 32
Charts vs. Pivot Charts ... 43
Tips and Tricks: Visio Services ... 44
4
Tips and Tricks: SSRS ... 52
8. PerformancePoint Services ... 53
Decomposition Trees ... 56
Creating Dashboards ... 58
9. The REST API ... 66
Tips and Tricks: The REST API ... 69
10. External Content Types ... 74
Tips and Tricks: External Content Types ... 74
11. Conclusion ... 77
12. About the Author ... 78
13. References ... 79
14. List of Figures ... 80
1.
Foreword
It is an irony that the best thing Microsoft did to improve the reporting story in the 2010 product release was to remove one of the most popular reporting features in version 2007. “Deprecating” (in Microsoft parlance) the data analysis views from the latest release of Project Server unleashed a wave of
innovation and exploration as organizations worked diligently to understand the expanded world of SharePoint Business Insights reporting tools, and the interaction of these tools with Microsoft Project Server 2010.
How can a popular feature be removed to improve the overall toolset? It was only after I started digging into the 2010 Business Intelligence (BI) story that I realized how much of a crutch those data analysis views truly were. Given those views, most organizations never explored the rich selection of reporting offerings available. Without those views, organizations were compelled to use the reporting tools embedded in the SharePoint Server platform.
I am as guilty of these failings as any other Enterprise Project Management (EPM) implementer. Data analysis was always good enough, and I never went out of my comfort zone to explore alternative reporting methods – until Microsoft Project Server 2010 was released. The genesis for this paper was back in January 2009, when I was asked to prepare a short presentation on the Project Server 2010 BI story. “Business intelligence,” I complained to a colleague, “what do I know about business
intelligence?” After an appeal for a change in topic, and a firm denial from the organizers, I figured the best thing would be sit down and start firing up the search engine.
So I did. And then I did some more. Then I talked to the BI folks. Then I talked to the SharePoint Server folks. Then I went through recorded demos from any number of conferences. Then I started putting together my own demos. As I worked through all of this material, I began to blog it up in pieces and parts.
The end result: not only did I build up my own reporting repertoire, but I think I stumbled upon the very compelling story that Microsoft has to tell with BI in the 2010 product offering. (Not that they have not been communicating that at every opportunity, but it just goes to the old adage that you can lead a horse to water, but you can’t make him drink.)
A couple of months later, I was chatting with a longtime member of the Microsoft Project team about the new release. I asked him, “What, in your opinion, is the most compelling feature of this new
6 The most compelling story within Project Server 2010 is both individual and individualized dashboards. Not only can I now create a dashboard intensely focused on the data requirements of an individual, but I can empower individuals to create their own customized dashboards.
2.
Executive Summary
The reporting options available to organizations implementing Project Server 2010 are rich in both depth and breadth. Not surprisingly, the most difficult aspect of implementing these options has not been in the technical implementation – which for the most part with Project Server 2010 is very well documented both online and in print. Nor have the challenges lain in the design of the reporting structure, which has always been a perennial issue. No, the challenge that most organizations seem to be facing in the first year after the release of Project Server 2010 has been understanding when and how to utilize the myriad reporting tools now available.
This document is intended as an introduction to the reporting options available in Microsoft Project Server 2010 and SharePoint Server Enterprise. The target audience for this document is the power user, business owner or administrator new to Project Server 2010 and looking for a quick way to assess the reporting options available to the organization.
This document is not intended to provide a comprehensive technical description of each of those reporting methods. Each reporting tool has been documented in extensive detail in books or various online forums, albeit not often documented in the context of a Project Server deployment. Where possible, links to additional information have been provided.
Specific reporting examples have been cited to demonstrate the ease and flexibility of each reporting tool.
Introducing Microsoft BI Insights
The 2010 Microsoft BI offering, collectively referred to as Insights offers a diverse package of
technologies for reporting against available data. The goal of the BI Insights package is to “Improving organizations by providing business insights to all employees, leading to better, faster, more
relevant decisions.”
Most importantly perhaps, the Insights packages are geared to users throughout the organization, from the executive to the end user, the information worker in the trenches who may not have deep SQL development skills, but is more accustomed to analyzing information using the more common tools of Microsoft Excel, Visio and perhaps Access.
8 available in a form that is controllable by the consumer yet secured to the needs of the organization. For an overview of the BI Insights offerings, please refer to this helpful downloadable poster:
http://www.microsoft.com/downloads/en/details.aspx?FamilyID=fc97d587-ffa4-4b43-b77d-958f3f8a87b9&displaylang=en
As stated above, Microsoft has done an excellent job with this release of providing extensive repositories of documentation on how to implement key features within the Enterprise Project Management solution space. For a comprehensive list of technical and business resources on implementing BI solutions with Microsoft Project Server 2010, please refer to this site:
http://technet.microsoft.com/en-us/projectserver/ff513702.
For a review of reporting scenarios from across the entire Microsoft technological stack but not specific to Project Server, please review the TechNet Business Intelligence Hub:
http://technet.microsoft.com/en-us/bi.
Identifying the Available Data
Before selecting an appropriate tool, the organization must first define the informational constraints that it operates under. The requirements for data output must match the organizational commitment to data input. As an example, the organization may desire to create a report to highlight the resource constraints that are impacting project throughput. Culturally however, the organization has mandated that schedules will be strictly schedule driven and will not include level of effort estimates. Given those constraints, the organization may be hard pressed to develop an appropriate report.
Reporting requirements must be appropriate to the level of data included within the project schedules.
Project Details Available Data
Schedule Only Reports may be developed depicting schedule variance, milestones performed during specific time periods, and overall task lists. Specific numbers of projects within the portfolio meeting specific criteria may generate useful business intelligence.
Schedule & Effort Reports may be developed including predicted work and utilization of specific resources. Constraints may be identified and used in optimization decisions.
Schedule, Effort & Cost
Reports may be developed that illustrate the cost of projects and resources. Cost constraints may be identified and used in optimization decisions.
Selecting an Appropriate Tool
Given the number of tools available and the sheer volume of information available online, where does an organization start when assessing which tool to use? See below for a synopsis of available tools, and when to use each one. Page number references within this document have been provided for each of the tools.
Tool Description When to Use Microsoft Project
Professional
The desktop client version of Microsoft Project provides a wealth of reporting tools – Timelines, Visual Reports, Reports, Export to Excel, Export to Access, and the ability to copy specific screenshots.
Use these tools when reporting is performed on a single project basis. Typically, these tools are used by the project manager to respond to ad hoc informational requests or to
participate in a defined manual status reporting process.
Project Center Views (Page 12)
The default dashboard feature within Project Server, the Project Center allows for the rollup and graphical depiction of key metrics from within projects.
Use Project Center views when the organization has defined specific metrics that may be tracked in projects using enterprise fields. Project Center views should generally only be used for reporting when the organization has defined metrics, and enforces a strict project update process to ensure that the reported data is valid.
Excel & Excel Services (Page 27)
Excel provides an intuitive and familiar report authoring tool to the
information consumers of the
organization. Excel Services allows the reports to be published in a secure fashion for consumption by other users.
Use this tool when a number of information consumers have spreadsheet authoring skills, and desire the ability to manipulate standard reports to meet specific needs. Excel reports may be used for project or portfolio level reporting. Excel reports may yield minimal returns to organizations that have not begun tracking effort or cost estimates within projects.
10
Tool Description When to Use Visio & Visio Services
(Page 32)
Often underappreciated as a reporting tool, Visio provides an interface for producing unconventional reports with intuitive navigation. Visio Services allow the reports to be published in a secure fashion and be made accessible to users without Visio installed on their local machines.
Use this tool when a simple chart is insufficient for reporting purposes. For example, the report consumers may be looking for a more graphical depiction or navigational structure such as a timeline, geographical or organizational representation of project or portfolio level data.
SQL Server Reporting Services (SSRS) (Page 46)
Traditionally the reporting tool of choice for many organizations, SSRS typically requires skilled individuals to develop custom reports. With the latest offering of SSRS, users may download Report Builder as a tool to develop reports. While this new tool allows users to create reports easily, the interface is still not as intuitive as commonly used desktop reporting software such as Excel or Visio.
Use SSRS reports when there is a need for an automated distribution of reports on a regular basis, for instance a weekly e-mail comprising the status for all projects within a given portfolio. SSRS reports are also useful when attempting to develop reports pulling from both Project Server and
SharePoint Server data sources. Generally, SSRS is to be used when the format of the report is static, and users are not expected to make changes other than controlling specific filtering parameters.
PerformancePoint Services
(Page 52)
PerformancePoint Services allows users to assemble diverse collections of reporting assets into modular dashboards. The reporting assets may include SSRS reports, Excel reports, and native PerformancePoint reports. Each asset may be used individually, in a single dashboard, or in multiple dashboards.
PerformancePoint Services provides several points of functionality to the Project Server user. Use
PerformancePoint Services when various reporting elements are expected to be used and reused as components within various, targeted BI dashboards. Also use
PerformancePoint Services to quickly and easily display key metrics from projects in a Web-based interface. Note that these metrics are typically pulled from OLAP cubes, and as such may only be relevant to organizations tracking cost or effort within project schedules.
Tool Description When to Use The REST API
(Page 66)
The REST API is a powerful tool for dynamically extracting information from published Excel reports and then embedding that information in web sites, Word, or PowerPoint documents.
Use this tool if the organization requires the routine production of Word or PowerPoint artifacts consuming project or portfolio level data. This tool allows the user to embed dynamic data in Office
documents for use in such artifacts as routine status reports or monthly resource reports.
External Content Types (Page 74)
External content types are configurable by using SharePoint Designer, and allow the surfacing of database data directly into SharePoint Server. This potentially makes the data more accessible, and subject to the default SharePoint Server search process.
Use this tool in conjunction with the SharePoint external list feature to surface Project Server data in the form of SharePoint lists. This model may be appropriate to organizations that have grown accustomed to providing key information to stakeholders via SharePoint lists or who need to give users the ability to create and save custom views of project data.
Power Pivot for Excel PowerPivot for SharePoint (NA)
Introduced with the 2010 release, Power Pivot consists of both a SharePoint Server application to generate list data feeds and an Excel add-in. Power Pivot pulls data from SQL Server databases and SharePoint lists and easily aggregates it into a single table. (Power Pivot was deemed out of scope for this document.)
Use this tool when multiple SharePoint lists must be combined with Project Server data to generate a single data set for reporting purposes. For
example, use this tool to combine a list containing a project narrative from team members with project data – or if project level metadata has been extended from Project Server into secure SharePoint lists.
12
3.
Project Center Views
When many Project Server users think of the term “dashboard,” the first thing that comes to mind is the Project Center views. These views roll up project data into a single, easy-to-use format — without requiring any custom development efforts.
Most organizations that implement Microsoft Project Server will start with a dashboard of key metrics displayed in Project Center views. Although the tool comes with a number of views defined, and defining a new view is not difficult, these views present a tremendous challenge to the organization. Project Center views are predicated on the assumption that the organization has defined specific metrics that may be applied to all projects. In turn, this assumption is based on the requirement that all project managers follow the same schedule development and update processes.
Item Project Center Views
Subcomponent of Microsoft Project Server
Reporting Level Portfolios, Programs
Use When The organization has defined specific metrics that will be used to assess specific project portfolios and captured those metrics in the form of
enterprise fields. The organization has also implemented strict processes to ensure that the data in the project plans is valid and up to date.
Technical Skills Required Ability to develop enterprise custom Project Server fields.
Table 3: Project Center Views
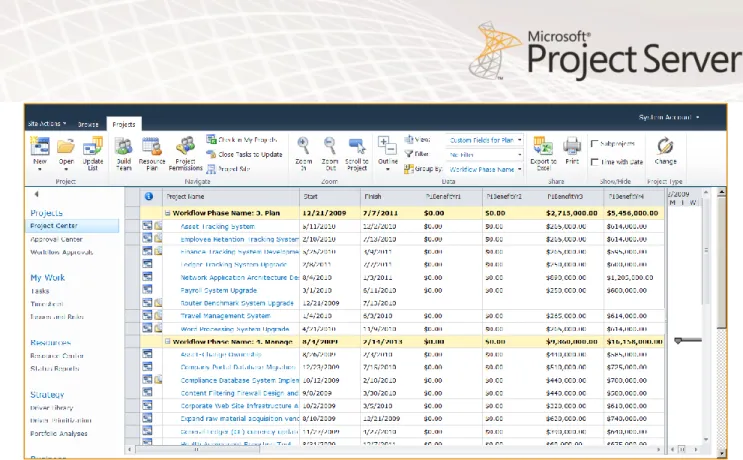
Project Center views are arguably the most important feature within Microsoft Project Server, and thus they represent the essential starting point for many of the server based reporting capabilities.
Figure 1: The Project Center View
Organizations wishing to use the Project Center view as an enterprise-wide dashboard of projects should define key characteristics to be tracked and develop custom formulas to roll up those characteristics to the project level. Additionally, organizations using the Project Center view must implement strict policies around schedule development and updating to ensure that the data represented is uniform. For example, many organizations require the reporting of finish variance on key phase gate milestones for each of the projects in the portfolio. To ensure that the dashboard is accurate, each of the project schedules must have the same phase gates identified. Each project manager must then use the same update methodology to ensure the displayed finish variance is accurate.
Tips and Tricks: Project Center Views
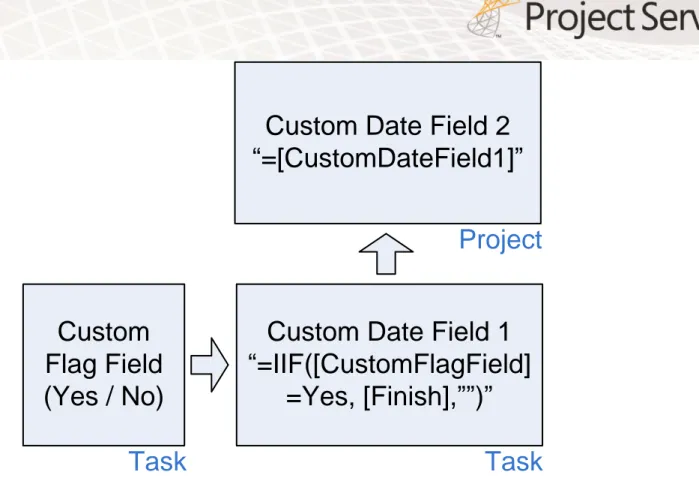
Many organizations choose to display a key project date in the Project Center view. This date may be a go-live date, an in-service date, or a federally mandated milestone. To roll this level of task data up to the Project Center level, create a level custom flag field to identify the key activity. Create a task-level date field, and configure it to display the task finish date if the custom flag field has been set to yes. Configure the new date field to roll up as the “maximum” to all summary tasks.
14
Custom
Flag Field
(Yes / No)
Custom Date Field 1
“=IIF([CustomFlagField]
=Yes, [Finish],””)”
Custom Date Field 2
“=[CustomDateField1]”
Project
Task
Task
Figure 2: Adding a Milestone Rollup Date to the Project Center
Add the project-level field to a Project Center view.
For complex Project Center views including totaled fields, dynamic filters based on the current date, or the ability to create personal settings, consider implementing a SharePoint external list as described on page 74 of this document.
16
4.
The Project Server Database
Project Server data is stored in a series of SQL Server databases. To generate more sophisticated reports in Excel, Visio, PerformancePoint Services, or other reporting tools, the user must gain a certain basic familiarity with how the data is structured in the database.
The data itself can be separated into two main categories: OLAP and non-OLAP data. Generally, SQL Server tables are suitable for providing a snapshot of the project or resource data as it is right now. OLAP data is more appropriate for providing a snapshot of the data right now and then allowing a comparison of the same data over time — for instance, resource availability over the next three months, or the actual cost of all projects on a monthly basis for the last six months.
The OLAP data is kept in an instance of SQL Server Analysis Services and may be consumed via any number of reporting tools. The non-OLAP data is stored in the SQL Server instance.
Tables
Project Server data is stored within four SQL Server databases: Archive, Draft, Published, and Reporting. Microsoft only supports reports that use data from the Reporting database. For a detailed description of the Project Server 2010 database schema, please refer to the following Project Server 2010 Software Developer Resource Kit available here:
http://www.microsoft.com/downloads/en/details.aspx?FamilyID=46007f25-b44e-4aa6-80ff-9c0e75835ad9&displaylang=en
Figure 4: Navigating the Project Server Database
Note that almost all of the custom fields appear in the View tables indicated with the “userview” suffix. Multi-value fields do not appear in those tables, and as a result, multi-value fields are often much more difficult to incorporate in standard reporting tools than the more traditional single-value fields as they require personnel with experience writing SQL queries to export to various reporting tools.
Organizations should be mindful of this fact when defining the enterprise custom fields to be used within the system.
Tips and Tricks: Reporting Against the Database
It is sometimes challenging for report authors to determine in which table a specific field is located. The online database schema referenced above provides information on how to find fields. Users may also
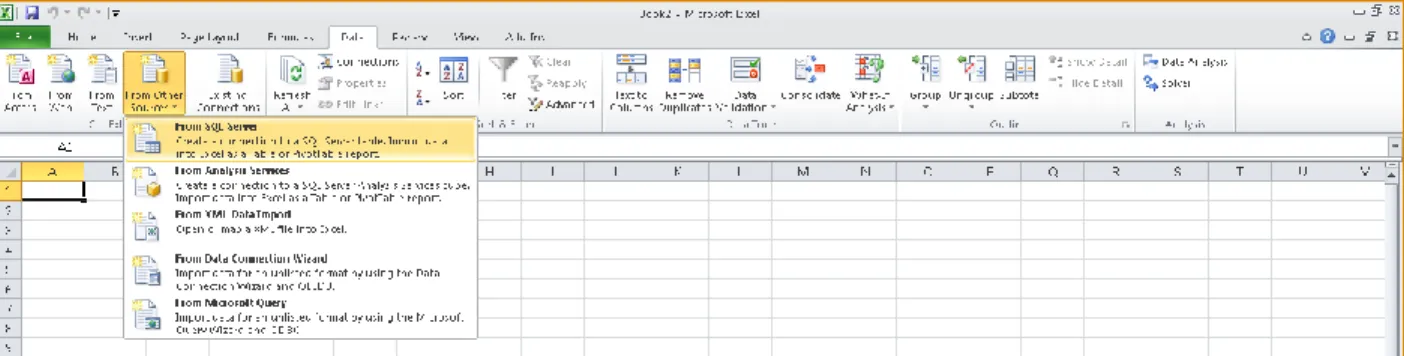
18 Users not familiar with using SQL Server management tools may consider using Excel data connections to gain visibility into specific database tables. To connect an Excel table to SQL Server, open a new file in Excel and select New Connections from the Data tab. Select the “From Other Sources” option and then "From SQL Server."
Figure 5: Connect Directly from Excel to the SQL Server Database
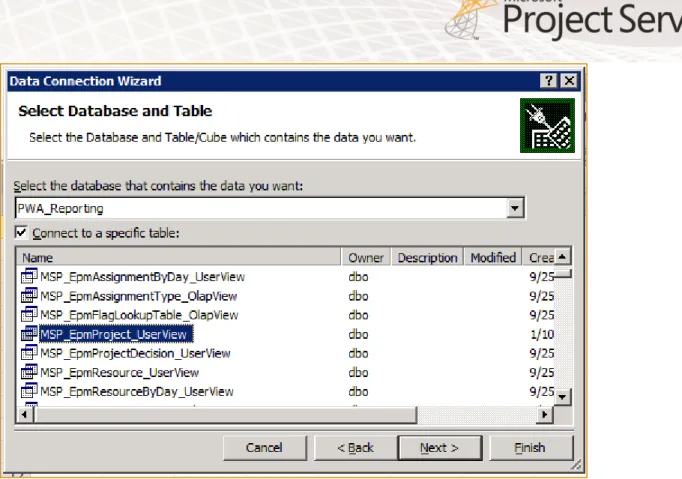
Select the appropriate database and table. After some practice, it will be easier to define the appropriate data table, but most report authors tend to start with the MSP_EpmProject_UserView table. This data set includes almost all of the project-level data and includes both the predefined fields as well as the custom non–multi-value fields defined within the organization.
Figure 6: Select the Database Table
Insert the data into Excel. This replicates the SQL Server database into an Excel workbook and may be used for general analysis purposes.
Figure 7: Review Inserted Data
For more information on modifying the data set displayed within the Excel report, please see the section on ODC files on page 20 of this document.
20
OLAP Cubes
OLAP cubes provide the capability to analyze and drill into Project Server data. Within Project Server 2010, each department may have its own set of OLAP cubes – which may then be surfaced by using Excel, Visio, PerformancePoint Services, or other reporting tools. OLAP Cubes are configured in the Server Settings, and once configured, may be accessed by using any of the identified reporting tools. Note that any custom fields developed by the organization must be added to the OLAP cube
configuration and the cube must then be rebuilt before those fields are available for report writing.
Tips and Tricks: OLAP Cubes
Excel allows users to add custom calculated fields to most pivot tables. When the pivot table is created from a SQL Server Analysis Server connection, however, that feature has been disabled. This affects the user ability to add data calculations to reports. For example, a user exports the timephased actual work and work fields to an Excel pivot table, then attempts to calculate remaining work over time, in essence creating a burn-down chart. That calculated remaining work column may not be created as part of the pivot table as the source data is tied to a SQL Server OLAP cube.
To enable calculated fields in an Excel-based PivotTable, users may download and install the free OLAP Pivot Table Extender tool from CodePlex: http://olappivottableextend.codeplex.com/
ODC Files
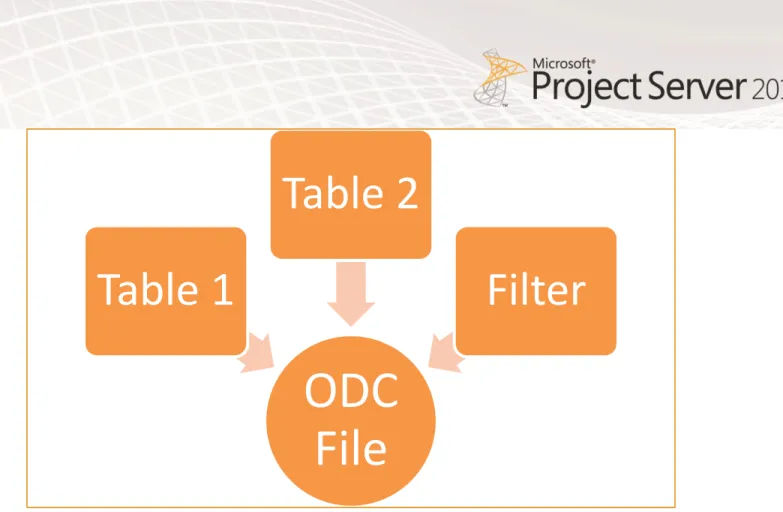
ODC files simplify the report authoring process by allowing personnel with technical skills to collect specific columns from any number of database tables, add filters and joins as required, and then provide the data sets for less technical personnel to develop reports as needed.
Figure 8: ODC Overview
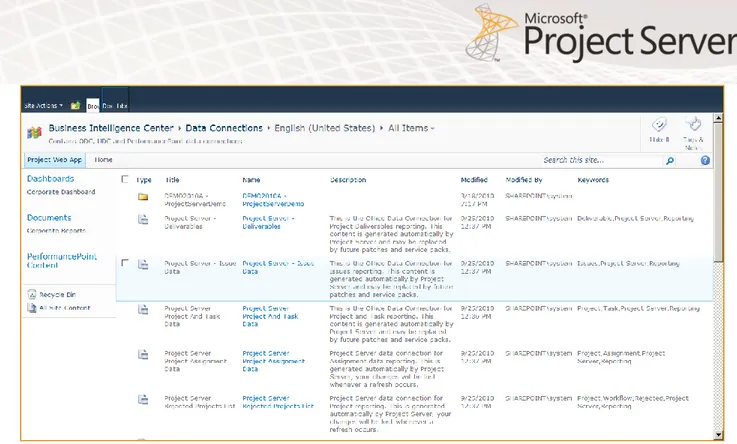
Project Server comes with a number of sample ODC files located in the Business Intelligence Center. Each of these ODC files may be copied and then customized to the needs of the organization. Report authors may also open the ODC files within Excel and review the settings to identify appropriate syntax and query structure.
ODC
File
Table 1
Table 2
22
Figure 9: Default ODC Files
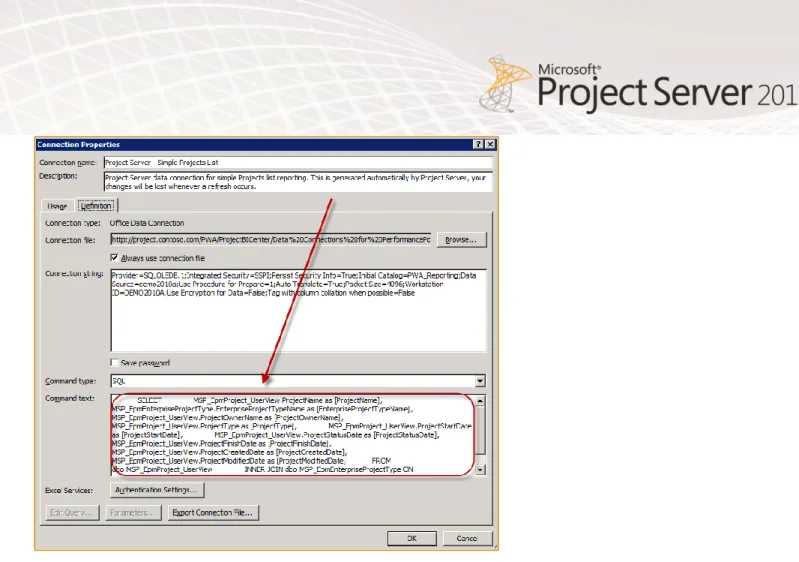
To edit an ODC file, open a suitable file to use as a basis for the report. The selected file will open in Excel. Once the data is displayed, select the Connections option from the Data tab. The ODC file will be displayed. Click the Properties button to review the specific settings. This will expose the Connections Property dialog box. In the next dialog box, select the Definitions tab roughly in the middle of the box. The screen will now display the data selected to be included in the ODC file.
Figure 10: Identifying the Default ODC Settings
To edit the selected fields, to add any new custom fields, or to implement a filter, copy the Command Text box and paste into Notepad for editing. Add the appropriate verbiage as required by using SQL query syntax.
Figure 11: Modifying the ODC Field Settings
Note that some fields may create issues when added to ODC files. Specifically, the ODC will not display the unique IDs or multi-value fields without special instructions and coding.
24
Tips and Tricks: ODC Files
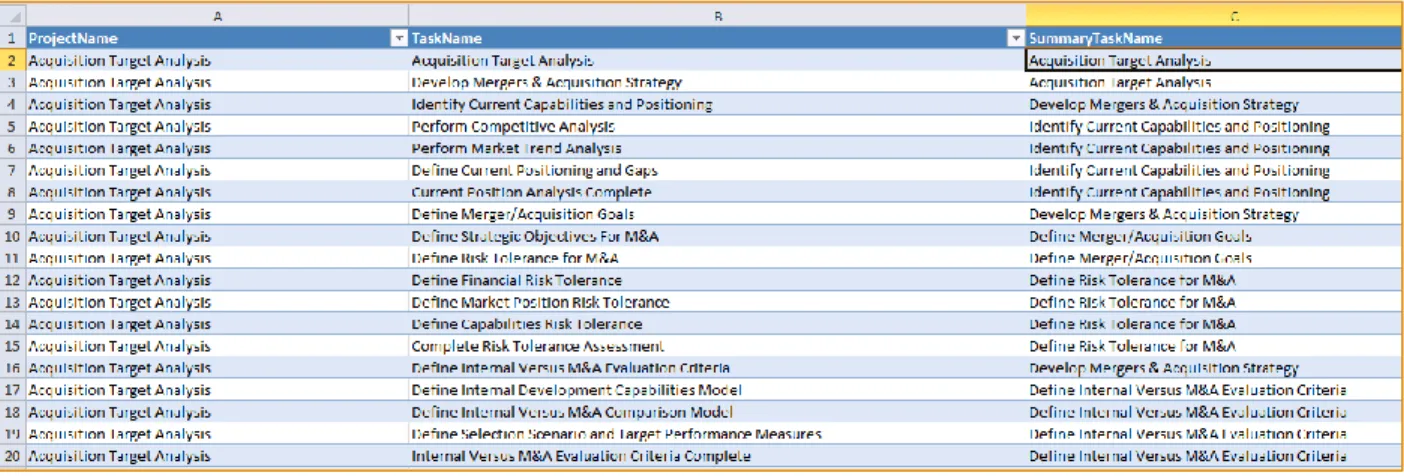
ODC files allow the combination of multiple tables to generate useful Excel and Visio files. One trick to leverage this feature is to add the parent task to task summary reports. To do so, append the following text to the Project and Task Data ODC file included by default in the Project Server BI Center installation:
SELECT SummaryTask.TaskName AS SummaryTaskName, Tasklist.TaskName FROM dbo.MSP_EpmTask_UserView AS Tasklist INNER JOIN
dbo.MSP_EpmTask_UserView AS SummaryTask ON Tasklist.TaskParentUID = SummaryTask.TaskUID
The resulting report will include both the task name and the summary task name for each task in a project.
Figure 12: Including the Summary Task Name in an Excel Report
Another trick is to filter the ODC file to only provide data on a single project. Add the following text to the default Project and Tasks ODC file to filter on a specific project.
WHERE MSP_EpmProject_UserView.ProjectName=’projectname’ AND
MSP_EPMTask_UserView.TaskOutlineLevel=1
This will enable users to more easily generate reports based on their own specific interests.
For users who are not comfortable developing ODC scripts, Microsoft has provided a helpful tool that allows users to select the desired fields, and then generates the required ODC file. The ODC Report Builder tool is a free download and is available as part of the Project Server 2010 Solution Starter pack (http://code.msdn.microsoft.com/P2010SolutionStarter).
Figure 13: Building an ODC with the Report Wizard
After you select the desired fields, the Report Wizard will generate the appropriate ODC file and post it to the selected SharePoint library.
26
5.
Excel & Excel Services
Microsoft Excel is probably the most prevalent desktop reporting tool on any desktop around the world. Excel combines the ease of desktop publishing with the power of sophisticated analysis. Excel Services as implemented in Project Server 2010 continues that story. Users may now create reports and manipulate data in Excel, then securely publish that data to a SharePoint site.
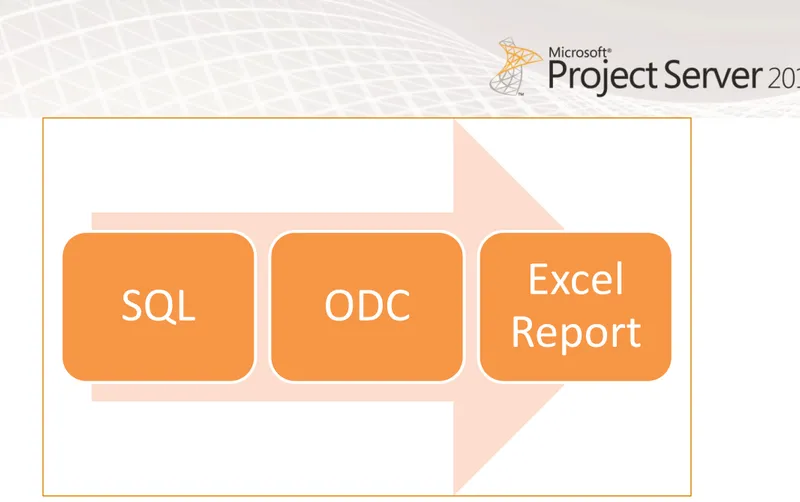
Excel reports may be generated directly against the Project Server database or through the intermediary of an ODC file prepared by the Project Server Administrator. The advantage of using an ODC file is that nontechnical users may consume any combination of tables from within the database without needing knowledge of how to develop SQL queries.
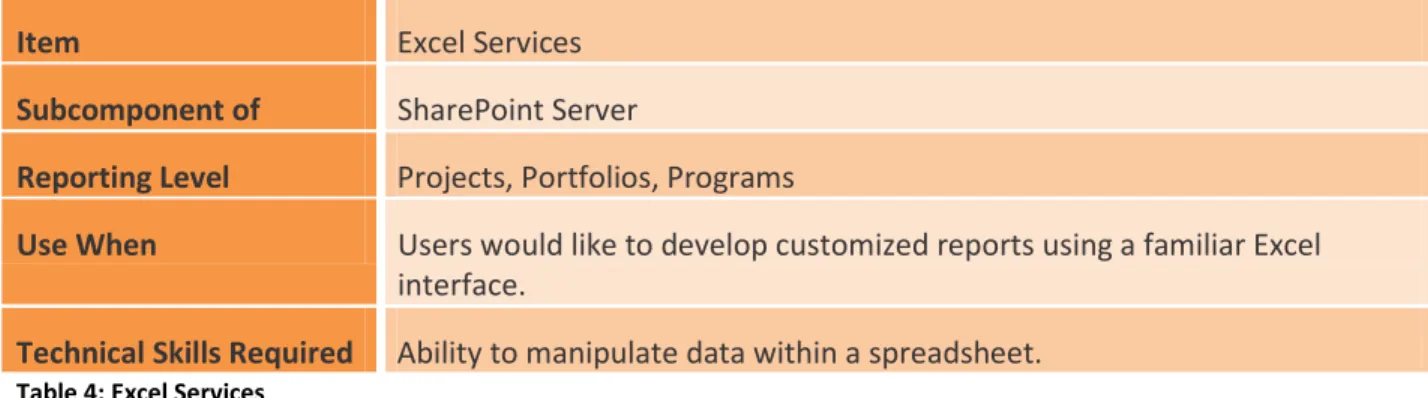
Item Excel Services
Subcomponent of SharePoint Server
Reporting Level Projects, Portfolios, Programs
Use When Users would like to develop customized reports using a familiar Excel interface.
Technical Skills Required Ability to manipulate data within a spreadsheet.
Table 4: Excel Services
To create a new Excel report, open a new file in Excel. From the Data tab, choose to pull data directly from the Project Server database or from a predefined ODC file.
28
Figure 15: Using ODC Files in Excel Reports
Configure the Excel chart by using the available fields. Add conditional formatting as required. In the example below, a timesheet report is developed and colored data bars are added.
SQL
ODC
Excel
Figure 16: Creating an Excel Report
The Excel Report may then be surfaced within SharePoint Server as an Excel document, an Excel Chart embedded in a Web part, or via a PerformancePoint dashboard. Use the REST API to surface Excel charts dynamically in Microsoft Word documents. For more information on the REST API, see page 66 of this document.
30
Figure 17: Excel Services Report
Tips and Tricks: Excel Services
Note that certain features available within the Excel client are not available within Web-based Excel reports. Specifically, combo boxes or the data validation typically used to generate drop- down lists are not supported.
Figure 18: Using PivotTables to Filter Excel Reports
To generate a drop down list to select data for display, it is recommended to either use the new Slicer functionality or to use this workaround using the filter option in a PivotTable:
http://blogs.office.com/b/microsoft-excel/archive/2008/02/13/a-pivottable-trick-that-brings-data-validation-to-excel-services.aspx.
32
6.
Visio & Visio Services
As Excel is the most overused reporting tool on desktops around the globe, Visio is probably the most underutilized reporting tool. Visio has long been able to dynamically surface data in intuitive and highly visual charts. With the introduction of Visio Services in SharePoint Server 2010, those charts may now be published to a Web browser for access by users without Visio installed on the local computer.
Visio allows users to marry project data to schematics, maps, or any other conceptual visualization of the project portfolio. Visio reports may be easily generated with a minimal amount of specific tool knowledge.
Visio unshackles users from a traditional chart-based report, and allows the implementation of graphical navigation. For instance, users may create an organization chart linked to resource data, a geographic map with project status overlaid, or a schematic of a product with the status of the various components displayed. Linking these reports to Project Server data is no more complicated than displaying data within Excel.
Item Visio Services
Subcomponent of SharePoint Server
Reporting Level Portfolios, Programs
Use When Users require an intuitive, graphical report navigation structure.
Technical Skills Required Ability to develop graphical reports in Visio.
Table 5: Visio Services
Like Excel reports, Visio leverages the same architecture of ODC files and service applications. Visio reports may be generated with data directly from the Project Server database or by consuming data from ODC files.
Figure 19: Using ODC Files in Visio Reports
Start a new report by creating the structure within a Visio diagram. Add custom shapes or backgrounds as required.
SQL
ODC
Visio
34
Figure 20: Creating a Reporting Navigational Structure
Once the report has been mocked up within Visio, add a link directly to the Project Server database or to a preconfigured ODC file by using the Data tab.
Figure 21: Connecting Visio to the SQL Server Database
36
Figure 22: Selecting Columns to Include in the Visio Report
This will add the data to Visio in the External Data window. To combine that data with a graphical element, simply drag the line of data onto the Visio object.
Figure 23: Connecting SQL Server Data to the Visio Report
A chain link icon will appear beside the linked row of data. The linked data may now be displayed within Visio by adding the Shape Data window. Users may click elements within the report to display specific data from the Project Server database.
38
Figure 24: Navigating within Visio
In addition to simply displaying data in text form, data graphics may be added to the report elements to include such graphical elements as thermometers, gauges, and other indicators. In the following example, the projects are configured to be dynamically color-coded based on the data in the Project Department field. A similar technique could be used to change the color of the item based on cost or finish variance figures.
Figure 25: Adding Data Graphics
40
Figure 26: Incorporating Data Graphics in the Visio Report
The Visio drawing may now be saved to a SharePoint document library. Users will be able to open the drawing and navigate through it directly within the browser, without a requirement to install Visio on the local computer.
Figure 27: Reviewing the Visio Report in SharePoint Server
To provide an example, in the following illustration, an organization chart has been displayed in Visio with resource availability calculations associated with each resource.
42
Figure 28: Displaying Data in an Org Chart
In the next illustration, a Visio timeline is dynamically linked to Project Server data and uploaded to a SharePoint site.
Figure 29: Displaying a Dynamic Timeline with Visio Services
Charts vs. Pivot Charts
Visio charts may be separated into two main categories: charts and Pivot Charts. The normal charts allow database data to be surfaced in a graphical format, but may not be connected to OLAP cubes in SQL Server Analysis Services. Pivot Charts may be connected to OLAP cubes, and thus allow users to flexibly manipulate the report to dive into the detail, or to roll back up to a high-level aggregated view of the project data.
When you are first creating the Visio report, select the PivotChart option to connect a Visio report directly to an Analysis Services OLAP cube. Consider using this option to surface resource availability data in the form of an organization chart.
44
Figure 30: Visio Pivot Charts
Tips and Tricks: Visio Services
When you are creating a report, consider embedding a graphical depiction of the product, facility, or geographic region within which projects will be performed. This allows the end user an intuitive navigational structure to assess and analyze information. In the illustration below, drilling dates are displayed next to a depiction of oil wells over a map of an Alaskan oil field.
Figure 31: Embedding Project Server Resource Data in a Geographic Report
46
7.
SQL Server Reporting Services (SSRS)
SQL Server Reporting Services have long been the reporting tool of choice for many organizations. Often requiring a high level of technical skill, SSRS allows report authors to dive deeply into the reporting database to develop robust reports. Organizations typically use SSRS to develop structured reports pulling from multiple data sources, or to develop reports that are e-mailed out to users on a routine schedule.
SSRS reports are probably still the best solution when disparate data sources must be combined and aggregated. For example, organizations will often use SSRS to aggregate program level risks from multiple SharePoint sites and combine with Project Server metrics. Another common use for SSRS is to tie a narrative from a project workspace status list to project level data. For example, team members provide an update of what they have done each week in the form of SharePoint list entries. Each week, the project manager will generate a report compiling these list entries with metrics from Project Server. These reports may all be tied to a scheduled subscription mechanism and e-mailed to key stakeholders on a weekly or monthly basis.
While providing a power to aggregate data that is unparalleled by any of the other reporting options discussed within this document, SSRS also require the most technical knowledge to create. However, Microsoft is aware of this hurdle to the development of SSRS reports, and has released the free Report Builder v3.0 download, a client-based report authoring tool. Unless Report Builder is used against the default Project Server database however, there is still a significant hurdle to generate the core data set to be included in the report.
Item SQL Server Reporting Services
Subcomponent of SQL Server
Reporting Level Portfolios, Programs, Projects
Use When Users require a predefined set of reports with minimal customization or when users require reports puling data from a number of data sources. When reporting on a portfolio level, SSRS may require a high level of process standardization.
Technical Skills Required Ability to develop and deploy reports by using SQL queries. Report Builder allows users familiar with the database structure to create reports with minimal development knowledge.
Below is an example of a portfolio-based report that has been included in the default Microsoft Project Server image that is freely downloadable from the Microsoft Web site. Note that this dashboard displays metrics from Project Server. Clicking each project entry will navigate the user to a second report, which displays specific project data (Figure 34).
Figure 33: Sample SSRS Report
The latest version of SSRS also features the ability to export reports into Microsoft Word documents, thereby delivering live project data into an editable artifact.
48
Figure 34: Exporting a Status Report to Microsoft Word
Report Builder
Report Builder enables users to make effective, simple reports, with minimal effort. After downloading the tool from the Microsoft Web site, follow these simple instructions to generate a prototype report. First, configure a data source. The data source may include either the Analysis Services OLAP cubes or the Project Server Reporting database. Once the data source has been configured, select the
Figure 35: Creating an SSRS Report with Report Builder
50
Figure 36: Previewing an SSRS Report
Finally, load the report back into the appropriate report library within SharePoint Server. Once it is uploaded, the report may be surfaced or referenced throughout the corporate intranet.
Figure 37: Displaying an SSRS Report in the Browser
52
Tips and Tricks: SSRS
One of the common requirements in a Project Server implementation is to aggregate multiple lists of data across a program. With Project Server 2010, this request has become even more common as organizations store more and more data in various lists and libraries accessible from the Project Server Project Detail Pages.
The SharePoint List Association Manager (SLAM) provides a free interface to develop relationships between disparate SharePoint lists, and then pulls the data into a single SQL Server table. A minimal knowledge of SharePoint Server and SQL scripting is required for the tool deployment.
8.
PerformancePoint Services
PerformancePoint Services is a collection of reporting tools that are now included within SharePoint Server 2010. PerformancePoint allows users to perform a number of reporting tasks. Most notable of these tasks, perhaps, is the ability to assemble a library of reporting assets which may then be combined into any number of project or portfolio dashboards. Additionally, PerformancePoint allows users to create reporting components that may be reused in multiple customized dashboards.
This tool is arguably the closest successor to the Data Analysis views in prior versions of Project Server. It features a client-based application called PerformancePoint Dashboard Designer, which is
downloaded to the client computer upon the first use. For more information on Dashboard Designer, refer to this link:
http://office.microsoft.com/en-us/dashboard-designer-help/getting-started-performancepoint-dashboard-designer-HA100800792.aspx
Item PerformancePoint Services
Subcomponent of SharePoint Server
Reporting Level Projects, Portfolios, Programs
Use When Specific reporting elements must be combined and recombined into specific dashboards.
When users must be presented with a dynamic interface within SharePoint Server to drill into specific project and portfolio data.
Technical Skills Required Basic spreadsheet skills. The ability to edit SharePoint sites by adding Web parts.
Table 7: PerformancePoint Services
To create a simple PerformancePoint Services report, navigate to the PerformancePoint library within the Project Server Business Intelligence Center.
54
Figure 39: Navigating to PerformancePoint Services Content
Create a new report by selecting the option in the Item tab. If this is your first time creating a report on the local computer, this action may download and install the Dashboard Designer utility.
Figure 41: The PerformancePoint Dashboard Designer
Select the Analytic Chart option to create a basic PerformancePoint report. In the next window, assign a data source, add the relevant fields, and right-click the chart to change it to a pie chart.
56
Figure 42: Creating the PerformancePoint Report
Press the Save button to save the report to the PerformancePoint report library. The report may now be surfaced within a PerformancePoint dashboard or by using a PerformancePoint Web part on a
SharePoint site.
Decomposition Trees
An embedded feature within PerformancePoint charts is the decomposition tree interface. A
decomposition tree allows the user to drill down into OLAP data. To explore this feature, you may right-click the chart in the above diagram and then select the Decomposition Tree option.
Figure 43: Decomposing a PerformancePoint Report
This will open a new interface for drilling into the data. Click each element within this interface to select how it should be analyzed.
58
Figure 44: PerformancePoint Decomposition Trees
The decomposition tree feature allows users to flexibly drill into specific charts to any level of detail. Results may be exported to Excel as needed.
Creating Dashboards
PerformancePoint Services is primarily positioned as the tool of choice to develop comprehensive dashboards of Project Server data. As implemented in PerformancePoint Services, the dashboard may be composed of specific elements pulled from specific SharePoint libraries.
To build dashboard components in Project Server, add content to the PerformancePoint Content Library in the Business Intelligence Center. The content itself does not necessarily have to reside within the PerformancePoint library, but may reside in other libraries. For example, when you are creating reports in the PerformancePoint library, the items may constitute placeholders that redirect users to specific SSRS or Excel reports.
Figure 45: Navigating to the PerformancePoint Content Library
As described on page 78 of Microsoft SharePoint 2010 PerformancePoint Services Unleashed, The items that may be added to a PerformancePoint Content library include the following:
Item Description
KPI Data indicating how well the organization is meeting a key, defined target.
Scorecard A compilation of multiple KPIs.
Indicator A visual element associated with KPIs such as a stoplight that appears red, yellow, or green.
Report Reports enable the visualization of data and may be further classified as Excel Services reports, analytic charts, strategy maps, SSRS reports, and so forth.
Filter Filters allow the filtering of elements on the dashboard. For instance, one dashboard may be filtered based on department, while another identical dashboard may use a different filter of geographic region.
60 Each of these components may be combined as needed to create a series of dashboards. After you populate the PerformancePoint list with reusable content, create a new dashboard by using the New Dashboard command.
Figure 46: Creating a New Dashboard
Figure 47: Selecting a Dashboard Format
After you select an appropriate dashboard format, pick and choose the relevant PerformancePoint content to include.
62
Figure 48: Selecting PerformancePoint Content
Selecting content from this list will populate the Details view on the right of the window. Drag the components onto the dashboard framework to populate the dashboard.
Figure 49: Adding PerformancePoint Content to the Dashboard
Add pages in the interface at the top of the view to create multiple pages of data. Each of those pages may then be populated by dragging items from the Details window on the right.
Once the dashboard has been completed, right-click the newly created dashboard name in the Workspace Browser window to deploy the dashboard to SharePoint Server.
64
Figure 50: Deploying the Dashboard to SharePoint Server
This will publish the dashboard to the site of choice. In the example below, PerformancePoint Analytic Charts and Excel Services reports have been combined to create a single dashboard page.
Figure 51: Previewing the Dashboard
For more information on creating dashboards with Project Server data, refer to the following link:
66
9.
The REST API
Document automation has long been a request of organizations that are implementing Project Server. Many users have requested the option to create status report templates in Microsoft Word that dynamically populate with Project Server data. The REST API, a built-in feature of SharePoint Server 2010, allows users to embed dynamic Excel charts into Office applications such as Word and
PowerPoint.
To use the REST API, users only need to determine the correct URL for each element within the Excel report. The syntax for developing the URL is well documented online at the following link:
http://blogs.office.com/b/microsoft-excel/archive/2009/11/09/excel-services-in-sharepoint-2010-rest-api-examples.aspx
Item The REST API
Subcomponent of SharePoint Server
Reporting Level Projects, Portfolios, Programs
Use When Users need to dynamically embed Excel-based graphics and data in Microsoft Word documents.
Technical Skills Required The ability to name charts and ranges in Excel.
Table 9: The REST API
To consume an Excel worksheet posted to a SharePoint library, the Excel sheet must first be properly prepared. In the following worksheet, the data range has been named.
Figure 52: Preparing the Excel Report
68
Figure 53: Preparing the Excel Chart
The Excel sheet should then be posted to a SharePoint library. Once it is posted to the library, users may consume the named data by using the REST API. The only requirement to use this data is an
understanding of how to develop the correct URL pointing back to the report. For a typical Project Server deployment, where the report is posted to the Business Intelligence Center, the REST URL should appear similar to the examples below (with the italicized sections replaced with specific parameters):
Chart URL:
http://servername/PWA/_vti_bin/ExcelRest.aspx/ProjectBICenter/Sample%20Reports/English%20(Unite d%20States)/WorkbookName.xlsx/Model/Charts('ChartName')
Range URL:
http://servername/PWA/_vti_bin/ExcelRest.aspx/ProjectBICenter/Sample%20Reports/English%20(Unite d%20States)/WorkbookName.xlsx/Model/Ranges('RangeName')
After you develop the URL, validate it by pasting it into a browser window and confirm that it appears correctly.
Figure 54: Displaying the Excel Chart in a Browser
That URL may now be used to embed the chart in a number of different tools and applications.
Tips and Tricks: The REST API
Embed a server-based Excel chart into a Word document by using the Microsoft Word Quick Parts option. Open the Word document and select the Quick Parts option on the Insert tab. From there, select the option to add a Field, and select the Links and References field. Finally, select the IncludePicture option and paste the URL into the appropriate field. The chart is now dynamically embedded within the Word document.
70
Figure 55: Adding Charts as a Word Quick Part
By using this technique, you can easily prepare weekly status report templates in Word, and then save them to PDF or XPS formats.
The chart will appear in the Word document and will automatically refresh whenever the document is opened.
Figure 57: Creating Word Documents with Dynamic Content
To add the data supporting the chart to the same Word document, use a similar technique, but instead of choosing the IncludePicture field, choose the IncludeText option. The resulting data may be
72
Figure 58: Adding Data to the Word Document
The REST API may also be used to embed Excel charts in SharePoint sites by using the Content Editor Web part. In the following example, the chart URL has been inserted as a picture link within the text of the Web Part.
Figure 59: Adding Data to a Project Workspace
The REST API may also be used to embed Excel Services data in PowerPoint or other Microsoft Office applications.
74
10.
External Content Types
External content types provide configurable methods of surfacing and manipulating Project Server data within the familiar format of SharePoint lists. Use external content types within organizations
accustomed to consuming data in the form of SharePoint lists, interested in adding personalized
features to Project Center-like views, or incorporating Project Server data into other SharePoint content.
External content types may be created with SharePoint Designer, a free-client based tool. SharePoint Designer may not be used directly on the PWA site, but may be used against other non-PWA sites or against sub-sites underneath the main PWA site.
For more information on creating external content types, refer to this blog post:
http://blogs.msdn.com/b/bcs/archive/2010/01/28/bcs-team-channel-creating-an-external-content-type-in-sharepoint-designer-2010.aspx.
Item External Content Types
Subcomponent of SharePoint Server
Reporting Level Project, Portfolios, Programs
Use When Organizations would like to pull Project Server data into SharePoint lists for consumption and view creation.
Technical Skills Required Ability to create service applications within SharePoint Server, including setting security appropriately.
Table 10: External Content Types
Tips and Tricks: External Content Types
External lists are a new list type implemented in SharePoint Server 2010 to surface external data that has been captured in external content types. After creating the content type, add an external list to a page.
Figure 60: Displaying Project Server Data in External Lists
The list displays data much like a Project Center view but provides a number of advantages. External lists may then be searched like regular SharePoint Server content or specific columns may be used as a reference in other lists.
More importantly, users may create grouping and totals within a personalized view of all projects. This feature becomes relevant when an organization requires a dynamic view totaling how many projects are active vs. inactive, or how many projects are within each branch of a portfolio hierarchy. The user may then save the view for personal consumption without other users seeing it.
The other feature that external lists offer over the Project Center view is that external list views may be created by using dynamic filters. For instance, a common user request in Project Server is to display all projects where the Finish or the Status Date is less than the current date. Due to constraints with how project fields are calculated, the Project Center view can support such views, but not dynamically. Each project must be opened, recalculated, and published to update the information used in the filter. External lists do not share the same technical constraint.
In the following example, the external list has been modified to only display projects scheduled to start after the current date.
76
Figure 61: Dynamically Filtering External List Views
The current date will always be recalculated as of the moment that the user accesses the list. This provides an updated, dynamic view into large numbers of projects.
11.
Conclusion
Although a number of reporting examples are discussed above, this document does not purport to be an exhaustive survey of all of the reporting options available to users of Microsoft Project Server. In
addition to the examples already presented, an extensive user base is constantly combining existing tools to develop new and innovative solutions. Additionally, an extensive community of developers and third-party solution vendors has already developed a number of solutions to extend the reporting capabilities of Project Server.
If, like any project manager, we look into a crystal ball to extrapolate current trends into the near future, the following business intelligence innovation paths have clearly been identified as already ongoing:
Increased support for the individual and individualized reporting. This will include the increased leveraging of familiar end user reporting tools to pull data from Project Server as well as new mechanisms to pull data from throughout an EPM tool deployment and aggregate it in accessible formats.
A renewed focus on capturing the human narrative of a project, and combining that subjective narrative with the objective metrics that EPM tools have been focused on in the past.
Further development of standard models for enterprise project reporting. These reports have always been the cornerstone of EPM tool deployments, and will continue doing so in the future. As the body of knowledge around reporting against Project Server 2010 grows and matures, please feel free to visit the Microsoft Project reporting site to review the latest material:
78
12.
About the Author
Andrew Lavinsky is a manager with the UMT Consulting Group. Based in Houston, TX, and primarily serving clients in the US South Central District, he focuses on implementing Microsoft technologies to enable organizational performance improvement.
As a professional trainer and consultant, Andrew has a diverse background providing services in such industries as oil and gas, health care, finance, and IT. Andrew has lectured extensively on project and IT operations management topics within the US and abroad.
A graduate of the George Washington University, Andrew has been an active volunteer with PMI, ITSMf and a number of other professional and educational organizations. In the mid-90s, Andrew was
involved in the creation of one of the first official nongovernmental organizations in China. In the late-90s, he served as a Peace Corps Volunteer in rural Mongolia; moving on to manage project delivery for Fortune 500 companies in the Chinese market.
For his contributions to the Microsoft Project community, Andrew was awarded the Microsoft MVP designation in July 2010.
The author welcomes any and all feedback via LinkedIn (http://www.linkedin.com/in/azlav) or Twitter (@alavinsky).
13.
References
Microsoft Project 2010 Resources:
Product information
Project 2010 product site: http://www.microsoft.com/project
Project Team Blog: http://blogs.msdn.com/projectEnd-User Product Help
Project 2010 Help http://office2010.microsoft.com/project-help
Project 2010 Help http://office2010.microsoft.com/project-server-help
Demand Management for Project 2010 - http://go.microsoft.com/?linkid=9739874
Business Intelligence for Project 2010 -http://go.microsoft.com/?linkid=9726143
Upgrade and Migration to Project 2010 - http://go.microsoft.com/?linkid=9676814 Interactive content - Videos & Sessions & Webcasts
http://www.microsoft.com/showcase/en/US/channels/microsoftproject
http://www.microsoft.com/events/series/epm.aspxProject Professional 2010 and Project 2010 Demo Image:
Download: http://go.microsoft.com/?linkid=9713956
Hosted Virtual Lab: http://go.microsoft.com/?linkid=9713654IT Professional related - TechNet
Tech Center: http://technet.microsoft.com/ProjectServer
Admin Blog: http://blogs.technet.com/projectadministrationDeveloper related - MSDN
Developer center: http://msdn.microsoft.com/Project
Programmability blog: http://blogs.msdn.com/project_programmabilityGot Questions? Search or ask in the official Microsoft Forums!
http://social.msdn.microsoft.com/Forums/en-US/category/projectserver2010,projectprofessional2010/
SharePoint 2010 Products
© Microsoft Corp. All rights reserved|80
14.
List of Figures
Figure 1: The Project Center View ... 13
Figure 2: Adding a Milestone Rollup Date to the Project Center ... 14
Figure 3: Displaying Milestone Rollups in the Project Center ... 14
Figure 4: Navigating the Project Server Database ... 17
Figure 5: Connect Directly from Excel to the SQL Server Database ... 18
Figure 6: Select the Database Table ... 19
Figure 7: Review Inserted Data ... 19
Figure 8: ODC Overview ... 21
Figure 9: Default ODC Files ... 22
Figure 10: Identifying the Default ODC Settings ... 23
Figure 11: Modifying the ODC Field Settings ... 23
Figure 12: Including the Summary Task Name in an Excel Report ... 24
Figure 13: Building an ODC with the Report Wizard ... 25
Figure 14: Generating an ODC file from the Report Wizard ... 26
Figure 15: Using ODC Files in Excel Reports ... 28
Figure 16: Creating an Excel Report ... 29
Figure 17: Excel Services Report ... 30
Figure 18: Using PivotTables to Filter Excel Reports... 31
Figure 19: Using ODC Files in Visio Reports ... 33
Figure 20: Creating a Reporting Navigational Structure ... 34
Figure 21: Connecting Visio to the SQL Server Database ... 35
Figure 22: Selecting Columns to Include in the Visio Report ... 36
Figure 23: Connecting SQL Server Data to the Visio Report ... 37
Figure 24: Navigating within Visio ... 38
Figure 25: Adding Data Graphics ... 39
Figure 26: Incorporating Data Graphics in the Visio Report ... 40
Figure 27: Reviewing the Visio Report in SharePoint Server ... 41
Figure 28: Displaying Data in an Org Chart ... 42
Figure 29: Displaying a Dynamic Timeline with Visio Services ... 43
Figure 30: Visio Pivot Charts ... 44
Figure 31: Embedding Project Server Resource Data in a Geographic Report ... 45
Figure 32: Navigating Within a Geographic Report ... 45
Figure 33: Sample SSRS Report ... 47
Figure 34: Exporting a Status Report to Microsoft Word ... 48
Figure 35: Creating an SSRS Report with Report Builder ... 49
Figure 37: Displaying an SSRS Report in the Browser ... 51
Figure 38: Exporting SQL Server Reports to Excel ... 51
Figure 39: Navigating to PerformancePoint Services Content ... 54
Figure 40: Creating a New PerformancePoint Services Report ... 54
Figure 41: The PerformancePoint Dashboard Designer ... 55
Figure 42: Creating the PerformancePoint Report ... 56
Figure 43: Decomposing a PerformancePoint Report ... 57
Figure 44: PerformancePoint Decomposition Trees ... 58
Figure 45: Navigating to the PerformancePoint Content Library ... 59
Figure 46: Creating a New Dashboard ... 60
Figure 47: Selecting a Dashboard Format ... 61
Figure 48: Selecting PerformancePoint Content ... 62
Figure 49: Adding PerformancePoint Content to the Dashboard ... 63
Figure 50: Deploying the Dashboard to SharePoint Server ... 64
Figure 51: Previewing the Dashboard... 65
Figure 52: Preparing the Excel Report ... 67
Figure 53: Preparing the Excel Chart ... 68
Figure 54: Displaying the Excel Chart in a Browser... 69
Figure 55: Adding Charts as a Word Quick Part ... 70
Figure 56: Inserting a Dynamic Chart in a Word Document ... 70
Figure 57: Creating Word Documents with Dynamic Content ... 71
Figure 58: Adding Data to the Word Document ... 72
Figure 59: Adding Data to a Project Workspace ... 73
Figure 60: Displaying Project Server Data in External Lists ... 75
82
15.
List of Tables
Table 1: Identifying Available Data ... 8
Table 2: Reporting Tool Selection Matrix ... 11
Table 3: Project Center Views ... 12
Table 4: Excel Services ... 27
Table 5: Visio Services ... 32
Table 6: SQL Server Reporting Services ... 46
Table 7: PerformancePoint Services ... 53
Table 8: PerformancePoint Content Types ... 59
Table 9: The REST API ... 66