ORIGINAL INVESTIGATION
Changes in triglycerides
and high-density lipoprotein cholesterol may
precede peripheral insulin resistance, with 2-h
insulin partially mediating this unidirectional
relationship: a prospective cohort study
Tianshu Han, Yu Cheng, Shuang Tian, Li Wang, Xi Liang, Wei Duan, Lixin Na
*and Changhao Sun
*Abstract
Background: Results of longitudinal researches regarding the temporal relationship between dyslipidemia and insu-lin resistance (IR) are inconsistent. This study assessed temporal relationships of blood lipids with IR and determined whether there are any mediating effects existed in these temporal relationships.
Methods: This study examined a longitudinal cohort of 3325 subjects aged 20–74 years from China with an average of 4.2 years follow-up. Measurements of fasting blood lipids, as well as fasting and 2-h serum glucose and insulin, were obtained at two time points. The Gutt index and HOMA-IR were calculated as indicators of peripheral IR and hepatic IR. A cross-lagged path analysis was performed to examine the temporal relationships between blood lipids and IR. A mediation analysis was used to examine mediating effect.
Results: After adjusting for covariates, the cross-lagged path coefficients from baseline TG and HDL-C to follow-up Gutt index were significantly greater than those from baseline Gutt index to follow-up TG and HDL-C (β1=−0.131 vs β2=−0.047, P < 0.001 for TG; β1= 0.134 vs β2= 0.023, P < 0.001 for HDL-C). The path coefficients from baseline TG and HDL-C to follow-up 2-h insulin were significantly greater than those from baseline 2-h insulin to follow-up TG and HDL-C (β1= 0.125 vs β2= 0.040, P < 0.001 for TG; β1=−0.112 vs β2=−0.026, P < 0.001 for HDL-C). 2-h insulin partially mediated the effect of TG/HDL-C on Gutt index with a 59.3% mediating effect for TG and 61.0% for HDL-C. Conclusions: These findings provide strong evidence that dyslipidemia probably precede peripheral IR and that 2-h insulin partially mediates this unidirectional temporal relationship.
Keywords: Blood lipids, 2-h insulin, Insulin resistance, Temporal relationship, Mediating effect
© The Author(s) 2016. This article is distributed under the terms of the Creative Commons Attribution 4.0 International License (http://creativecommons.org/licenses/by/4.0/), which permits unrestricted use, distribution, and reproduction in any medium, provided you give appropriate credit to the original author(s) and the source, provide a link to the Creative Commons license, and indicate if changes were made. The Creative Commons Public Domain Dedication waiver (http://creativecommons.org/ publicdomain/zero/1.0/) applies to the data made available in this article, unless otherwise stated.
Background
Both dyslipidemia and insulin resistance (IR) are patho-genetic factors that are fundamental contributors to the development of type 2 diabetes and cardiovascular dis-ease. Although the strong association between these pathogenetic factors has long been recognized [1–3],
it is largely unknown which factor is the precursor, or whether the temporal relationship between them is bidi-rectional [4, 5]. Therefore, it is necessary to clarify the temporal relationship between these factors in order to provide an early and effective target for preventing type 2 diabetes (T2D) and cardiovascular disease (CVD).
The temporal relationship between dyslipidemia and IR is a “chicken-and-egg” question in basic research. Through multiple mechanisms, the metabolites of tri-glycerides (TG) can interfere with insulin-signaling path-ways, while high-density lipoprotein cholesterol (HDL-C)
Open Access
can improve IR in target tissues [6, 7]. On the other hand, IR stimulates lipogenesis and cholesterol synthesis, which results in the overproduction of hepatic very low density Lipoprotein (VLDL), inducing dyslipidemia [8]. Results of longitudinal researches regarding on this issue have also been inconsistent. Some investigators demonstrated that baseline IR was associated with the incidence of dyslipidemia [9, 10]. Alternatively, others demonstrated that blood lipids were a long-term predictor of IR [11]. Notably, in these longitudinal studies, the exclusion of subjects with dyslipidemia or IR traits at baseline based on their study hypothesis favored a one directional result and limited the other directional result (i.e., the exclusion of subjects with dyslipidemia at baseline favors the result that IR precedes dyslipidemia and limits the other result that dyslipidemia precedes IR). This type of study design and statistical analysis are likely the main reasons why the results from these longitudinal studies are inconsist-ent thus far.
In this study, we adopted a cross-lagged path analysis to explicitly assess the temporal relationship between dyslipidemia and IR using a longitudinal data of China. The cross-lagged path analysis is a model to assess causal associations in data derived from non-experimental, lon-gitudinal research design [12]. This theoretical model has been successfully used to analysis the temporal relation-ship between inter-related variables in previous studies [13, 14]. According to this theoretical model, if the rela-tionship between dyslipidemia and IR was bidirectional, they would predict each other, and their cross-lagged path coefficients would not be significantly different. However, if IR and dyslipidemia have an underlying causal relationship, the causal variable should predict the consequent variable, and the cross-lagged path coeffi-cient of the causal variable should be significantly greater than that of the consequent variable. We also analyzed whether there were any mediating effects existed in these temporal relationships by mediation analysis in this study.
Methods Study population
The participants were from the Harbin People’s Health Study (HPHS). The HPHS was launched by the Centers for Disease Control and Prevention and the Public Health School in Harbin in 2008 [15]. It covered five urban administrate regions of Harbin. Each region were divided into three strata based on their financial situation and one or two neighbor-hood committees were chosen from 15 communities that were randomly selected from each stratum in each administrate region by performing a stratified multistage random cluster sampling design. A total of
8940 subjects, aged 20–74 years, were recruited for the study. Subjects were eligible to participate in the study if they had no history of postmenopausal hor-mone therapy, malignancy, thyroid dysfunction, renal calculi, or corticosteroid or calcitriol use. A total of 4515 subjects (approximately 50.5% of the total sub-jects) were selected by completely randomized sam-pling method to participate in a follow-up survey due to the financial limitations of this study. In 2012, 4158 subjects completed the first in-person follow-up sur-vey, for a response rate of 92.1%. The basic informa-tion did not differ significantly between the original cohort and the selected cohort. After the exclusion of 398 subjects who were taking hypoglycemic drugs or insulin injections, and 435 subjects who were receiv-ing dyslipidemia treatment at either the baseline or the follow-up survey, 3325 subjects were included in this analysis, with an average follow-up period of 4.2 years. These 3325 subjects included 633 subjects with type 2 diabetes who were not receiving any treatment and 1887 subjects with dyslipidemia who were not receiv-ing dyslipidemia medication at either baseline or the follow-up survey. The study protocols were approved by the Ethics Committee of Harbin Medical University, and written informed consent was provided by all sub-jects. The methods in this study were in accordance with the approved guidelines.
Questionnaire survey
Detailed in-person interviews were administered by trained personnel using a structured questionnaire to collect information on demographic characteristics, die-tary habits, lifestyles, physical condition and anthropo-metric characteristics. Current smokers were defined as those who smoked at least 100 cigarettes in a lifetime or smoked every day or currently smoked some days. Cur-rent drinkers were defined as those who consumed ≥1 alcoholic drink each month in the 12 months prior to the survey. Regular exercise was defined as any kind of rec-reational or sport physical activity other than walking for work or life performed at least 30 min for 3 or more days per week.
Anthropometric measurements
Biochemical analyses
Fasting serum lipids, including total cholesterol (TCHO), TG, low-density lipoprotein cholesterol (LDL-C), HDL-C, and fasting and 2-h serum glucose were measured using an automatic biochemistry analyzer (Hitachi 7100, Tokyo, Japan). Fasting and 2-h serum insulin was measured by immunofluorescence method (TOSOH automated enzyme immunoassay (EIA) analyzer AIA-2000ST). Gutt index was calculated as an indicator of peripheral IR, which is based on glucose uptake rates, metabolic clearance rates and mean serum insulin by the following equation: [75,000 + (fasting glucose − 2-h glucose) × 0.19 × body weight]/(120 × log [(fasting insulin + 2-h insulin)/2] × [(fasting glucose + 2-h glu-cose)/2]) [16]. HOMA models were used to estimate hepatic insulin resistance (HOMA-IR) and beta cell func-tion (HOMA-%β) with HOMA2 calculator updated by the University of Oxford in 2004 [17].
Outcome measures
Diabetes was identified by self-reports of a history of dia-betes diagnosis, fasting blood glucose ≥7.0 mmol/L, and/ or 2-h glucose ≥11.1 mmol/L, and/or receiving treatment for diabetes. Dyslipidemia was identified by self-reports of a dyslipidemia diagnosis history, and/or hypercholes-terolemia (fasting TCHO ≥6.22 mmol/L, and/or fast-ing LDL-C ≥4.14 mmol/L), and/or hypertriglyceridemia (fasting serum TG ≥2.26 mmol/L), and/or low HDL-C [fasting serum HDL-C <1.04 mmol/L (male), fasting serum HDL-C <1.29 mmol/L (female)], and/or receiving treatment for dyslipidemia.
Statistical analysis
All statistical analyses were performed using R 2.15.3 (http://www.r-project.org/) and LISREL 8.52. A two-sided P < 0.05 was considered statistically significant. Blood lipids, HOMA-IR, HOMA-%β, Gutt index and insulin were log-transformed to improve the normality of the distribution.
Generalized linear models were performed to test dif-ferences in continuous variables between gender and menopause status and calculate covariate-adjusted mean yearly rates of change in Blood lipids, HOMA-IR, HOMA-%β, Gutt index and insulin during the follow-up period. Univariate and multivariate linear regression models were used to determine which type of baseline blood lipids independently predicted future HOMA-IR, HOMA-%β, Gutt index and insulin.
Longitudinal changes in blood lipids, HOMA-IR, HOMA-%β, Gutt index and insulin measured at two time points can be modeled using a cross-lagged panel design. In this modeling approach, each variable in the model is regressed on all of the variables that precede it in time. A
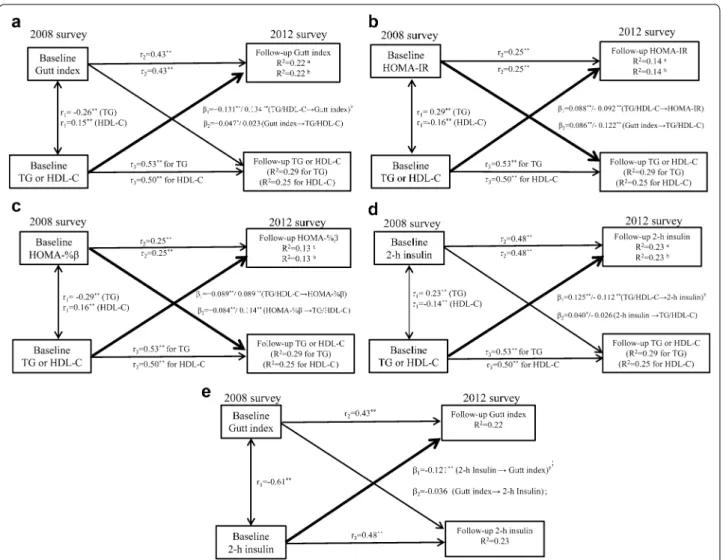
simplified, conceptual version of the model used in this analysis is presented in Fig. 1. The path coefficient with β1 describes the effect of baseline TG or HDL-C on the subsequent Gutt index, and the path coefficient with β2 describes the effect of the baseline Gutt index on the sub-sequent TG or HDL-C. Prior to the cross-lagged path analysis, the baseline and follow-up biochemical indi-ces were adjusted for age, gender, alcohol consumption, smoking, regular exercise, BMI, and caloric intake using a regression residual analysis and then were standard-ized by Z-transformation (mean = 0, standard deviation, 1). Pearson correlation coefficients of the Z-transformed quantitative variables of biochemical indices at baseline and follow-up were calculated. The cross-lagged path coefficients (β1 and β2) were estimated simultaneously based on the correlation matrix using the maximum like-lihood method in LISREL version 8.52. The percentile confidence interval of cross-lagged path coefficient was estimated using bootstrap simulation for the cross-lagged model. The validity of model fitting was indicated by the root mean square residual (RMR) and comparative fit-ness index (CFI) [18, 19]. RMR < 0.05 and CFI > 90 indi-cate relatively good fit to the observed data. The temporal relationships of blood lipids with Gutt index, HOMA-models and 2-h insulin were examined in separate mod-els. The difference between β1 and β2 derived from the standardized variables was tested using Fisher’s Z-test [14]. Although the significance of individual β1 or β2 sug-gests a directional relationship, a significant difference between β1 and β2 provides stronger evidence for a tem-poral relationship in the model.
Once the temporal relationships of these biochemical indices had been established, a causal mediation model was constructed to examine whether there are any medi-ating effects existing in these temporal relationships using R package mediation.
Results
The characteristics regarding the study variables
Additional file 1: Table S1 summarizes the mean levels of the study variables at baseline and follow-up by gender and menopausal status. The mean levels of continuous variables with adjustment for age (except age itself) and dichotomous variables were compared between genders and pre- and post-menopausal females.
The association of baseline blood lipids profile with follow‑up IR‑related indices by linear regression analysis
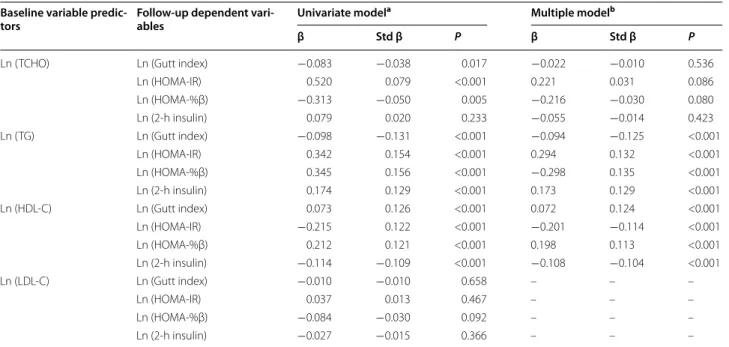
adjusting for age, gender, smoking, alcohol consumption, regular exercise, BMI, caloric intake and the baseline dependent variables, whereas TCHO and LDL-C did not. Therefore, based on the result of the linear regression model, we further analyzed the temporal relationships of TG and HDL-C with these indices in the cross-lagged path analysis.
The cross‑lagged path analysis of TG and HDL‑C with IR‑related indices
The cross-lagged path coefficients with adjustment for age, gender, smoking, alcohol consumption, regular
exercise, BMI and caloric intake are presented in Table 2 and Fig. 1. The path coefficients (β1) from the baseline TG to the follow-up Gutt index and 2-h insulin were sig-nificantly greater than the path coefficients (β2) from the baseline Gutt index and 2-h insulin to the follow-up TG (both P < 0.001 for the difference between β1 and β2). In the TG ↔ HOMA-models analysis, the path coefficients did not differ significantly between β1 and β2. HDL-C had temporal patterns similar to those noted above for TG. Based on the unidirectional relationships from TG and HDL-C to Gutt index and 2-h insulin, the temporal rela-tionship between Gutt index and 2-h insulin was further Fig. 1 The detailed parameter information on cross-lagged path analysis models. Results were adjusted for age, gender, smoking, alcohol
consumption, regular exercise, BMI and caloric intake. a–d β1, cross-lagged path coefficients from baseline TG/HDL-C to follow-up Gutt index; β2,
cross-lagged path coefficients from baseline Gutt index to follow-up TG/HDL-C; e: β1, cross-lagged path coefficients from baseline 2-h insulin to
follow-up Gutt index; β2, cross-lagged path coefficients from baseline Gutt index to follow-up 2-h insulin; r1 represents synchronous correlations; r2
and r3 represents tracking correlations; R2: variance explained. aVariance explained when TG included; b variance explained when HDL-C included;
**P < 0.01, *P < 0.05 for coefficients being different from 0; †Difference between β
1 and β2 for being different from 0; TG, triglycerides; HDL-C,
examined. The path coefficient (β1) from the baseline 2-h insulin to the follow-up Gutt index was significantly greater than the path coefficient (β2) from the baseline Gutt index to the follow-up 2-h insulin (P < 0.001 for the difference between β1 and β2).
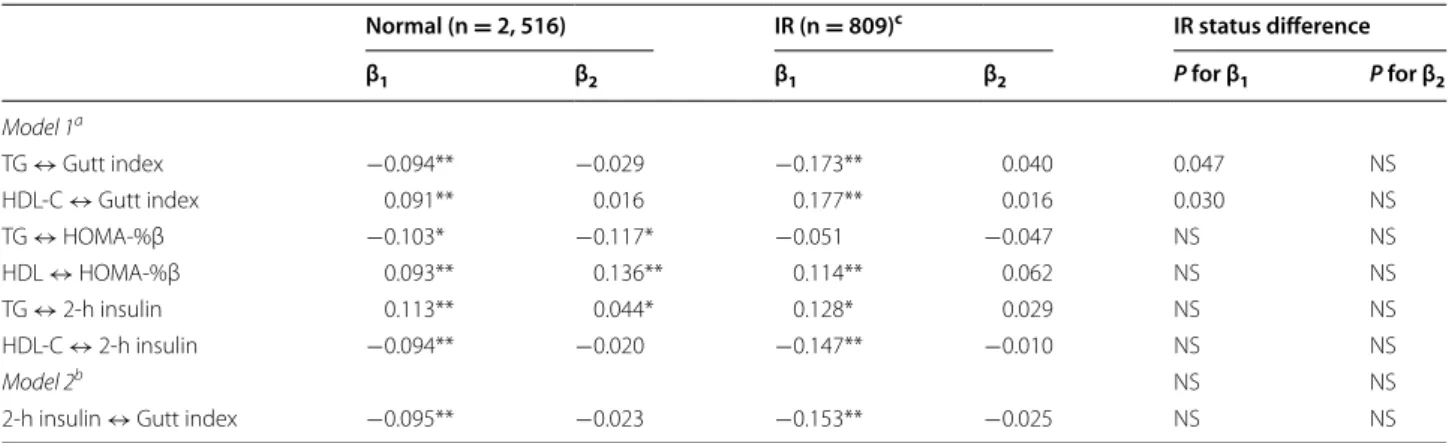
The cross-lagged path analyses were also performed in separate models by gender, menopausal status and HOMA-IR status, with adjustments for age, gender (only for HOMA-IR analysis models), smoking, alcohol consumption, regular exercise, BMI, and caloric intake. The cross-lagged path coefficients did not differ signifi-cantly between males and females or between pre- and post-menopausal females (Additional files 1: Table S2 and Table S3). According to the HOMA-IR status, the unidirectional relationship from baseline TG or HDL-C to follow-up Gutt index did not change between the two groups. However, the path coefficients (β1) from baseline TG or HDL-C to the Gutt index in the IR group were sig-nificantly greater than that in the normal group (Table 3).
The mediation analysis
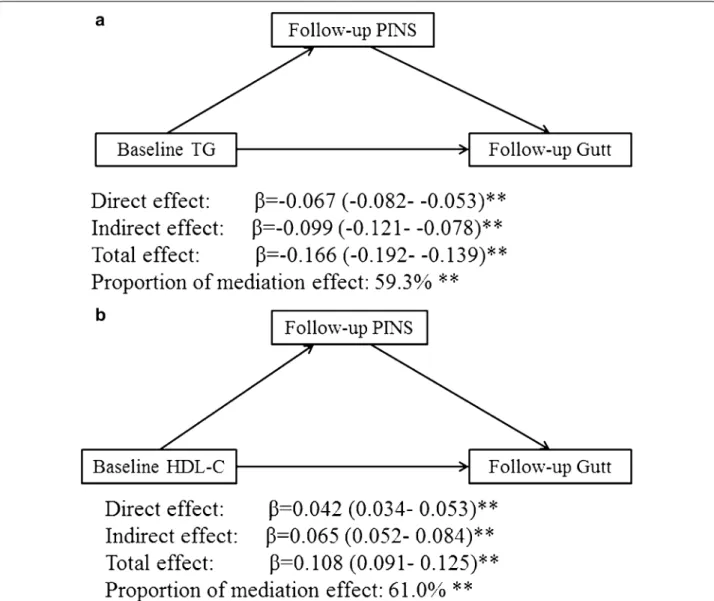
Figure 2 showed the mediating effects of follow-up 2-h insulin on the unidirectional relationship from baseline TG/HDL-C to the follow-up Gutt index after adjusting
for age, gender, smoking, alcohol consumption, regular exercise, BMI and caloric intake. The total effects of TG and HDL-C on the Gutt index were −0.166 for TG and 0.108 for HDL-C (P < 0.001). The percentage of the total effects that were mediated by 2-h insulin were estimated to be 59.3% for TG (P < 0.001) and 61.0% for HDL-C (P < 0.001). Mediation analysis was also performed by HOMA-IR status. The direct effect of TG on Gutt index in the IR group was significantly greater than that in the normal group (direct effect = 0.0701, 95% CI 0.02– 0.114, P = 0.02), which reduced the percentage of medi-ating effect of 2-h insulin.
The sensitivity analysis
Three sensitivity analyses were conducted in this study. One obtained percentile bootstrap confidence intervals to evaluate sensitivity to the distributions of cross-lagged path coefficients. The second sensitivity analysis exam-ined yearly rates of change (adjusted with age, gender, smoking, alcohol consumption, regular exercise, BMI and caloric intake) in TG, HDL-C, HOMA-models, Gutt index and 2-h insulin according to quartiles of their base-line values using general base-linear models to validate the results of cross-lagged path analyses (Fig. 3; Additional
Table 1 Linear regression analysis of baseline blood lipids with follow-up IR-related indices
β, regression coefficient; Std β, standard regression coefficient; TCHO, total cholesterol; TG, triglycerides; HDL-C, high-density lipoprotein cholesterol; LDL-C, low-density lipoprotein cholesterol; BMI, body mass index
Gutt index = [75,000 + (fasting glucose − 2-h glucose) × 0.19 × body weight]/(120 × log [(fasting insulin + 2-h insulin)/2] × [(fasting glucose + 2-h glucose)/2]) a Each regression model includes a single baseline blood lipid plus age, gender, smoking, alcohol consumption, regular exercise, caloric intake, BMI and dependent variable at baseline
b Regression model includes TCHO, TG and HDL-C plus age, gender, smoking, alcohol consumption, regular exercise, caloric intake, BMI and dependent variables at baseline
Baseline variable predic‑
tors Follow‑up dependent vari‑ables Univariate model
a Multiple modelb
β Std β P β Std β P
Ln (TCHO) Ln (Gutt index) −0.083 −0.038 0.017 −0.022 −0.010 0.536 Ln (HOMA-IR) 0.520 0.079 <0.001 0.221 0.031 0.086 Ln (HOMA-%β) −0.313 −0.050 0.005 −0.216 −0.030 0.080 Ln (2-h insulin) 0.079 0.020 0.233 −0.055 −0.014 0.423 Ln (TG) Ln (Gutt index) −0.098 −0.131 <0.001 −0.094 −0.125 <0.001
Ln (HOMA-IR) 0.342 0.154 <0.001 0.294 0.132 <0.001 Ln (HOMA-%β) 0.345 0.156 <0.001 −0.298 0.135 <0.001 Ln (2-h insulin) 0.174 0.129 <0.001 0.173 0.129 <0.001 Ln (HDL-C) Ln (Gutt index) 0.073 0.126 <0.001 0.072 0.124 <0.001 Ln (HOMA-IR) −0.215 0.122 <0.001 −0.201 −0.114 <0.001 Ln (HOMA-%β) 0.212 0.121 <0.001 0.198 0.113 <0.001 Ln (2-h insulin) −0.114 −0.109 <0.001 −0.108 −0.104 <0.001 Ln (LDL-C) Ln (Gutt index) −0.010 −0.010 0.658 – – –
Table 2 The cross-lagged path coefficients with adjustment for covariates
Data are cross-lagged path coefficients and its 95% confidence interval with bootstrap simulation Covariates included age, gender, BMI, alcohol consumption, smoking, regular exercise and caloric intake
TG, triglycerides; HDL-C, high-density lipoprotein cholesterol; BMI, body mass index; RMR, root mean square residual; CFI, comparative fitness index
Gutt index = [75,000 + (fasting glucose − 2-h glucose) × 0.19 × body weight]/(120 × log [(fasting insulin + 2-h insulin)/2] × [(fasting glucose + 2-h glucose)/2]) a Model 1: β
1 describes the path from the baseline TG/HDL-C to the follow-up Gutt index, HOMA-models or 2-h insulin, and β2 describes the path from the baseline Gutt index, HOMA-models or 2-h insulin to the follow-up TG/HDL-C
b Model 2: β
1 describes the path from the baseline 2-h insulin to the follow-up Gutt index, and β2 describes the path from the baseline Gutt index to the follow-up 2-h insulin
c P value for the difference between β 1 and β2
* P < 0.05 for β1 and β2 being different from 0, ** P < 0.01 for β1 and β2 being different from 0
Path coefficients Goodness‑of‑fit
model
β1 β2 P valuec RMR CFI
Model 1a
TG ↔ Gutt index −0.131 (−0.168 to −0.099)** −0.047 (−0.072 to −0.010)* <0.001 0.048 0.916
HDL-C ↔ Gutt index 0.134 (0.103 to 0.167)** 0.023 (−0.012 to 0.057) <0.001 0.021 0.970
TG ↔ HOMA-IR 0.088 (0.055 to 0.121)** 0.086 (0.049 to 0.123)** 0.934 0.038 0.934
HDL-C ↔ HOMA-IR −0.092 (−0.119 to −0.061)** −0.122 (−0.150 to −0.099)** 0.216 0.040 0.914 TG ↔ HOMA-%β −0.089 (−0.119 to −0.057)** −0.084 (−0.109 to −0.060)** 0.837 0.058 0.895 HDL ↔ HOMA-%β 0.089 (0.061 to 0.120)** 0.119 (0.096 to 0.151)** 0.216 0.039 0.941 TG ↔ 2-h Insulin 0.125 (0.090 to 0.159)** 0.040 (0.010 to 0.068)* <0.001 0.045 0.919 HDL-C ↔ 2-h Insulin −0.112 (−0.146 to −0.080)** −0.026 (−0.056 to 0.010) <0.001 0.041 0.987 Model 2b
2-h insulin ↔ Gutt index −0.121 (−0.162 to −0.081)** −0.036 (−0.079 to 0.010) <0.001 0.059 0.884
Table 3 The cross-lagged path coefficients by HOMA-IR status in the total sample, with adjustment for covariates
Data are cross-lagged path coefficients
NS, non-significant; TG, triglycerides; HDL-C, high-density lipoprotein cholesterol; BMI, body mass index
Gutt index = [75,000 + (fasting glucose − 2-h glucose) × 0.19 × body weight]/(120 × log [(fasting insulin + 2-h insulin)/2] × [(fasting glucose + 2-h glucose)/2]) Covariates included age, gender, BMI, alcohol consumption, smoking, regular exercise and caloric intake
a Model 1: β
1 describes the path from the baseline TG/HDL-C to the follow-up Gutt index, HOMA-models or 2-h insulin, and β2 describes the path from the baseline Gutt index, or 2-h insulin to the follow-up TG/HDL-C
b Model 2: β
1 describes the path from the baseline 2-h insulin to the follow-up Gutt index, and β2 describes the path from the baseline Gutt index to the follow-up 2-h insulin
c Insulin resistance (IR) was defined as the upper quartile of HOMA-IR
* P < 0.05 for β1 and β2 being different from 0, ** P < 0.01 for β1 and β2 being different from 0
Normal (n = 2, 516) IR (n = 809)c IR status difference
β1 β2 β1 β2 P for β1 P for β2
Model 1a
TG ↔ Gutt index −0.094** −0.029 −0.173** 0.040 0.047 NS HDL-C ↔ Gutt index 0.091** 0.016 0.177** 0.016 0.030 NS TG ↔ HOMA-%β −0.103* −0.117* −0.051 −0.047 NS NS HDL ↔ HOMA-%β 0.093** 0.136** 0.114** 0.062 NS NS TG ↔ 2-h insulin 0.113** 0.044* 0.128* 0.029 NS NS HDL-C ↔ 2-h insulin −0.094** −0.020 −0.147** −0.010 NS NS
Model 2b NS NS
file 2: Fig. S1, Additional file 3: Fig. S2, Additional file 4: Fig. S3). For example, the yearly rate of change in the Gutt index during the follow-up period significantly var-ied across increasing quartiles of baseline TG (P < 0.001) (Fig. 3a), however, the yearly rate of change in TG did not show a significantly varying trend across quar-tiles of baseline Gutt index (P = 0.095) (Fig. 3c). These results were consistent with the temporal relationships in the cross-lagged models shown in Table 2 and Fig. 1. The third sensitivity analysis used other insulin sensitiv-ity indices such as Stumvoll index and Avignon index instead of Gutt index in the cross-lagged path analysis.
The results of the Stumvoll index and Avignon index were similar to that of the Gutt index (Additional file 1: Table S4). Selection of different indices for IR probably did not affect the consequence of these analyses.
Discussion
mediating effect for HDL-C. Gender and menopausal status had no effect on these temporal relationships.
In this study, we examined the temporal relationships between blood lipids and IR using cross-lagged path anal-ysis, which is a powerful statistical approach in dissecting a causal relationship between inter-correlated variables. Two unidirectional relationships from TG and HDL-C to peripheral IR were confirmed in our analyses, suggesting a potential causal role for TG and HDL-C in the etiol-ogy of peripheral IR. Our results are supported by some human studies. For example, IR is not independently associated with future dyslipidemia when visceral adi-pose tissue included [20], genetic studies have shown that mutations in some genes that only involved in lipoprotein pathways cause dyslipidemia, which consequently lead to IR [21–24], and intervention studies have suggested that controlling dyslipidemia can improve IR [25–27]. Basic and animal studies may provide potential mechanisms of these unidirectional relationships. The metabolites of TG such as free fatty acids (FFAs), diacylglycerol and etc. can regulate insulin-signaling pathways through activating several serine/threonine kinases, which suppress insulin
receptor and tyrosine phosphorylation of insulin receptor substrates, inducing peripheral IR [1, 28, 29]. HDL-C can improve peripheral IR probably through multiple mech-anisms, including: (1) suppression of inducible nitric oxide synthase and fatty acid synthase; (2) regulation of fat storage in adipocytes via upregulation of the uncou-pling protein, and inducing the phosphorylation of AMP kinase in myocytes and liver by its principal apolipopro-tein moiety, apoA-1 [30, 31]. In terms of hepatic IR, we found bidirectional relationships of TG and HDL-C with hepatic IR, which were different from that with periph-eral IR. Although hepatic IR is frequently associated with peripheral IR, the severity of IR may differ among the various tissues in different individuals [32]. This indicates that treatment for IR should be organ-specific.
Further, we found changes in TG and HDL-C preceded changes in 2-h insulin concentration. The effect of TG/ FFA cycle on lipid signaling of β-cells is likely one pri-mary mechanism of these unidirectional relationships [33]. The intermediates within the TG/FFA cycle can increase insulin secretion in β-cells through: (1) activat-ing lipases from islet tissue; (2) activatactivat-ing protein kinase Fig. 3 The yearly-rates of change () in TG, HDL-C and Gutt index by quartiles of their baseline-values. General linear model was used to compare
C; (3) alteration of membrane physicochemical proper-ties of β-cells [34–38]. Moreover, FFA forms from hydrol-ysis of TG can cross β-cell membrane and active β-cell surface fatty acids receptor, which causes an increase in intracellular Ca2+, leading to increased insulin secretion
[39, 40]. In addition, HDL-C regulates insulin secretion through regulation of cholesterol homeostasis in β-cells via ATP-binding cassette transporters [41, 42]. Increased in HDL-C can reduce β-cell cholesterol content in mice with dyslipidemia, which consequently influence β-cell function [43].
We also found change in 2-h insulin preceded periph-eral IR. Catherine Le Stunff et al. showed that early change in postprandial insulin concentration, not in insu-lin sensitivity, was associated with obesity in early life. This study suggested that postprandial insulin may play an earlier role than peripheral IR in the development of metabolic defects throughout the whole body [44], fur-ther supporting our result in this study. Some mecha-nisms may also support the result that increased insulin concentration preceded peripheral IR. Increased insulin concentration can cause peripheral IR by mediating its own signaling pathway through: (1) diminishing insulin receptors affinity and insulin receptor’s kinase activity, (2) reducing the number of insulin receptors exposed on the cell surface by promoting internalization and degra-dation of hormone-occupied receptors [45].
Because the unidirectional relationships from TG and HDL-C to 2-h insulin, and from 2-h insulin to peripheral IR were established in this study, these findings prompted us to hypothesize that 2-h insulin concentration prob-ably played mediating roles in the temporal relation-ships of TG and HDL-C with peripheral IR. The results of mediation analysis in this study did, in fact, show that 2-h insulin partially mediated the temporal relationships with a 59.3% mediating effect for TG and a 61.0% medi-ating effect for HDL-C. Moreover, hepatic IR probably influences this mediating effect. Hepatic IR causes the overproduction of VLDL, which results in hypertriglyc-eridemia. Hypertriglyceridemia probably augments the effect of TG on the peripheral IR and reduces the per-centage of mediating effect of 2-h insulin.
This study emphasized the important roles of TG and HDL-C as plausible therapeutic targets for improving peripheral IR. It has been suggested that an imbalance in insulin action probably plays a vital role in the devel-opment of metabolic abnormalities [46]. The results of this study indicated that changes in TG and HDL-C were likely causal factors of peripheral IR through influenc-ing insulin action. Although TG could represent com-bined mass of fasting or non-fasting triglyceride-rich lipoproteins [47], increase the risk of CVD and predict ten-year all-cause mortality in patients with T2D [48],
the significance of TG as a plausible therapeutic target was underestimated for many years [49]. In China, dys-lipidemia has increased significantly during the past dec-ade. The prevalence rates of abnormal lipid levels were estimated at 30.7 and 13.8% for TG and HDL-C [50]. However, the awareness, treatment and control rates of dyslipidemia were estimated at 24.4, 8.8 and 4.3% [51]. It is urgent to initiate dyslipidemia intervention program for improving IR so as to reduce the burden of CVD and T2D.
Although postprandial hyperlipidemia probably played an important role of metabolic defects [52], this study did not include it based on the following reasons. First, the primary objective of this study is to examine the causal relationship between dyslipidemia and IR from epidemi-ologically point for providing potential effectively treat-ment target. Fasting lipidemia are more feasible than postprandial lipidemia as treatment targets in the pri-mary care because time and labor intensive are probably two major constraints of postprandial lipidemia measure in large population-based survey. Second, insulin and TG peak frequently occurs at different time points after an oral fat test. It has been reported that TG concentration at 2 h after consumption is not associated with insulin secretion [53]. Third, fasting TG significantly correlates with fasting apolipoprotein B-48 concentration, which may represent the postprandial lipidemia response [54, 55].
Strengths/weaknesses
This study examined the temporal relationships of blood lipids with IR using a novel theoretical model. Moreo-ver, based on fasting and 2-h status, both hepatic and peripheral IR were included, providing more informa-tion for these temporal relainforma-tionships. Further, this study examined the potential mechanisms of these causal rela-tionships using mediation analysis. However, this study also has some weaknesses. First, this study only included Asian subjects, which is likely to limit the generalizabil-ity of our findings to other ethnic populations. Second, hepatic IR and peripheral IR were calculated based on glucose and insulin levels. The results of this study should be confirmed in other studies by more sophisticated methods such as glucose clamp technique and intrave-nous glucose tolerance test.
the mechanisms of IR. Moreover, these results provide more evidence for the early prevention of IR by improv-ing dyslipidemia.
Abbreviations
BMI: body mass index; CFI: comparative fitness index; FFAs: free fatty acids; HDL-C: high-density lipoprotein cholesterol; HPHS: Harbin People’s Health Study; IR: insulin resistance; LDL-C: low-density lipoprotein cholesterol; RMR: root mean square residual; T-CHO: total cholesterol; TG: triglycerides; VLDL: very low density lipoprotein.
Authors’ contributions
LXN, CHS conceived and designed the experiments; TSH, CY, ST, LW, XL, WD performed the experiments; LXN, TSH analyzed the data; LXN, TSH wrote the paper. All authors read and approved the final manuscript.
Acknowledgements
We are indebted to the participants of HPHS for their continued cooperation and participation.
Competing interests
The authors declare that they have no competing interests.
Availability of data and materials
We do not have permission to share the underlying data as these concern subjects-related data and arise from an urban surveillance dataset of Harbin. Researchers should contact the corresponding author if they wish to explore the possibility of collaborative work.
Ethics approval and consent to participant
The study protocols were approved by the Ethics Committee of Harbin Medi-cal University, and written informed consent was provided by all subjects. Additional files
Additional file 1: Table S1. Characteristics regarding the study variables at baseline and follow-up by gender and menopausal groups. Table S2. The cross-lagged path coefficients by gender, with adjustment for covariates. Table S3. The cross-lagged path coefficients by menopausal status in female sample, with adjustment for covariates. Table S4. The cross-lagged path coefficients of TG and HDL-C with other insulin sensitiv-ity indices adjusted for covariates.
Additional file 2: Fig. S1. The yearly-rates of change (∆) in TG, HOMA-models and 2-h insulin by quartiles of their baseline-values. General linear model was used to compare yearly change rates in TG, HOMA-models and 2-h insulin across quartiles of their baseline values, with adjustment for age, gender, smoking, alcohol consumption, regular exercise, BMI and caloric intake. BMI, body mass index; TG, fasting triglycerides.
Additional file 3: Fig. S2. The yearly-rates of change (∆) in HDL-C, HOMA-models and 2-h insulin by quartiles of their baseline-values. General linear model was used to compare yearly change rates in HDL-C, HOMA-models and 2-h insulin across quartiles of their baseline values, with adjustment for age, gender, smoking, alcohol consumption, regular exercise, BMI and caloric intake. BMI, body mass index; HDL-C, high-den-sity lipoprotein cholesterol.
Additional file 4: Fig. S3. The yearly-rates of change (∆) in 2-h insulin and Gutt index by quartiles of their baseline-values. General linear model was used to compare yearly change rates in 2-h insulin and Gutt index across quartiles of their baseline values, with adjustment for age, gender, smoking, alcohol consumption, regular exercise, BMI and caloric intake. Gutt index= [75,000 + (fasting glucose - 2-h glucose) × 0.19 × body weight]/(120 × log [(fasting insulin + 2-h insulin)/2] × [(fasting glucose + 2-h glucose)/2]).
Funding
This work was supported by funds from the National Natural Science Founda-tion of China (81130049, 81202188) and by the Wu Lian De Grant of Harbin Medical University (WLD-QN1406).
Received: 13 July 2016 Accepted: 26 October 2016
References
1. Grundy SM. Hypertriglyceridemia, insulin resistance, and the metabolic syndrome. Am J Cardiol. 1999;83(9B):25F–9F.
2. Giannini C, Santoro N, Caprio S, Kim G, Lartaud D, Shaw M, Pierpont B, Weiss R. The triglyceride-to-HDL cholesterol ratio: association with insulin resistance in obese youths of different ethnic backgrounds. Diabetes Care. 2011;34(8):1869–74.
3. Du T, Yuan G, Zhang M, Zhou X, Sun X, Yu X. Clinical usefulness of lipid ratios, visceral adiposity indicators, and the triglycerides and glu-cose index as risk markers of insulin resistance. Cardiovasc Diabetol. 2014;13:146.
4. Li N, Fu J, Koonen DP, Kuivenhoven JA, Snieder H, Hofker MH. Are hyper-triglyceridemia and low HDL causal factors in the development of insulin resistance. Atherosclerosis. 2014;233(1):130–8.
5. Al-Mahmood AK, Afrin SF, Hoque N. Dyslipidemia in insulin resistance: cause or effect. 2014. Bangladesh J Med Biochem. 2014;7(1):27–31. 6. Petersen KF, Shulman GI. Etiology of insulin resistance. Am J Med.
2006;119(5 Suppl 1):S10–6.
7. von Eckardstein A, Sibler RA. Possible contributions of lipoproteins and cholesterol to the pathogenesis of diabetes mellitus type 2. Curr Opin Lipidol. 2011;22(1):26–32.
8. Reaven G. Insulin resistance and coronary heart disease in nondiabetic individuals. Arterioscler Thromb Vasc Biol. 2012;32(8):1754–9. 9. Haffner SM, Valdez RA, Hazuda HP, Mitchell BD, Morales PA, Stern MP.
Prospective analysis of the insulin-resistance syndrome (syndrome X). Diabetes. 1992;41(6):715–22.
10. Salonen JT, Lakka TA, Lakka HM, Valkonen VP, Everson SA, Kaplan GA. Hyperinsulinemia is associated with the incidence of hypertension and dyslipidemia in middle-aged men. Diabetes. 1998;47(2):270–5.
11. Risérus U, Arnlöv J, Berglund L. Long-term predictors of insulin resistance: role of lifestyle and metabolic factors in middle-aged men. Diabetes Care. 2007;30(11):2928–33.
12. Kenny DA. Cross-lagged panel correlation: A test for spuriousness. Psy-chol Bull. 1975;82(6):887.
13. Cameron AJ, Boyko EJ, Sicree RA, Zimmet PZ, Söderberg S, Alberti KG, Tuomilehto J, Chitson P, Shaw JE. Central obesity as a precursor to the metabolic syndrome in the AusDiab study and Mauritius. Obesity (Silver Spring). 2008;16(12):2707–16.
14. Chen W, Li S, Fernandez C, Sun D, Lai CC, Zhang T, Bazzano L, Urbina EM, Deng HW. Temporal relationship between elevated blood pressure and arterial stiffening among middle-aged black and white adults: the Bogalusa Heart Study. Am J Epidemiol. 2016;183(7):599–608. 15. Na L, Han T, Zhang W, Wu X, Na G, Du S, Li Y, Sun C. A snack dietary
pattern increases the risk of hypercholesterolemia in northern chinese adults: a Prospective Cohort Study. Plos ONE. 2015;10(8):e0134294. 16. Gutt M, Davis CL, Spitzer SB, Llabre MM, Kumar M, Czarnecki EM,
Schneider-man N, Skyler JS, Marks JB. Validation of the insulin sensitivity index (ISI(0,120)): comparison with other measures. Diabetes Res Clin Pract. 2000;47(3):177–84. 17. Wallace TM, Levy JC, Matthews DR. Use and abuse of HOMA modeling.
Diabetes Care. 2004;27(6):1487–95.
18. Jöreskog K, Sörbom D. Structural equation modeling with the SIMPLIS command language. Chicago: Scientific Software International. Inc; 1996. 19. Jöreskog KG, Sörbom D. PRELIS 2 user’s reference guide: a program for
multivariate data screening and data summarization: a preprocessor for LISREL. Chicago: Scientific Software International; 1996.
21. Hölzl B, Iglseder B, Sandhofer A, Malaimare L, Lang J, Paulweber B, Sandhofer F. Insulin sensitivity is impaired in heterozygous carriers of lipoprotein lipase deficiency. Diabetologia. 2002;45(3):378–84. 22. Goodarzi MO, Taylor KD, Guo X, Hokanson JE, Haffner SM, Cui J, Chen YD,
Wagenknecht LE, Bergman RN, Rotter JI. Haplotypes in the lipoprotein lipase gene influence fasting insulin and discovery of a new risk haplo-type. J Clin Endocrinol Metab. 2007;92(1):293–6.
23. Robciuc MR, Maranghi M, Lahikainen A, Rader D, Bensadoun A, Öörni K, Oörni K, Metso J, Minicocci I, Ciociola E, et al. Angptl3 deficiency is associated with increased insulin sensitivity, lipoprotein lipase activity, and decreased serum free fatty acids. Arterioscler Thromb Vasc Biol. 2013;33(7):1706–13.
24. López-Ríos L, Pérez-Jiménez P, Martínez-Quintana E, Rodriguez GG, Díaz-Chico BN, Nóvoa FJ, Serra-Majem L, Chirino R. Association of Taq 1B CETP polymorphism with insulin and HOMA levels in the population of the Canary Islands. Nutr Metab Cardiovasc Dis. 2011;21(1):18–24.
25. Tenenbaum A, Fisman EZ, Boyko V, Benderly M, Tanne D, Haim M, Matas Z, Motro M, Behar S. Attenuation of progression of insulin resistance in patients with coronary artery disease by bezafibrate. Arch Intern Med. 2006;166(7):737–41.
26. Tenenbaum H, Behar S, Boyko V, Adler Y, Fisman EZ, Tanne D, Lapidot M, Schwammenthal E, Feinberg M, Matas Z, et al. Long-term effect of bezafi-brate on pancreatic beta-cell function and insulin resistance in patients with diabetes. Atherosclerosis. 2007;194(1):265–71.
27. Tenenbaum A, Motro M, Fisman EZ, Schwammenthal E, Adler Y, Goldenberg I, Leor J, Boyko V, Mandelzweig L, Behar S. Peroxisome proliferator-activated receptor ligand bezafibrate for prevention of type 2 diabetes mellitus in patients with coronary artery disease. Circulation. 2004;109(18):2197–202.
28. Schinner S, Scherbaum WA, Bornstein SR, Barthel A. Molecular mecha-nisms of insulin resistance. Diabet Med. 2005;22(6):674–82. 29. Kim JK, Fillmore JJ, Sunshine MJ, Albrecht B, Higashimori T, Kim DW,
Liu ZX, Soos TJ, Cline GW, O’Brien WR, et al. PKC-theta knockout mice are protected from fat-induced insulin resistance. J Clin Invest. 2004;114(6):823–7.
30. Han R, Lai R, Ding Q, Wang Z, Luo X, Zhang Y, Cui G, He J, Liu W, Chen Y. Apolipoprotein A-I stimulates AMP-activated protein kinase and improves glucose metabolism. Diabetologia. 2007;50(9):1960–8.
31. Ruan X, Li Z, Zhang Y, Yang L, Pan Y, Wang Z, Feng GS, Chen Y. Apolipo-protein A-I possesses an anti-obesity effect associated with increase of energy expenditure and up-regulation of UCP1 in brown fat. J Cell Mol Med. 2011;15(4):763–72.
32. Abdul-Ghani MA, Matsuda M, Balas B, DeFronzo RA. Muscle and liver insulin resistance indexes derived from the oral glucose tolerance test. Diabetes Care. 2007;30(1):89–94.
33. Nolan CJ, Madiraju MS, Delghingaro-Augusto V, Peyot ML, Prentki M. Fatty acid signaling in the beta-cell and insulin secretion. Diabetes. 2006;55(Suppl 2):S16–23.
34. Hu L, Deeney JT, Nolan CJ, Peyot ML, Ao A, Richard AM, Luc E, Faergeman NJ, Knudsen J, Guo W, et al. Regulation of lipolytic activity by long-chain acyl-coenzyme A in islets and adipocytes. Am J Physiol Endocrinol Metab. 2005;289(6):E1085–92.
35. Peter-Riesch B, Fathi M, Schlegel W, Wollheim CB. Glucose and carbachol generate 1, 2-diacylglycerols by different mechanisms in pancreatic islets. J Clin Invest. 1988;81(4):1154–61.
36. Warnotte C, Gilon P, Nenquin M, Henquin JC. Mechanisms of the stimula-tion of insulin release by saturated fatty acids. A study of palmitate effects in mouse beta-cells. Diabetes. 1994;43(5):703–11.
37. Rhee JS, Betz A, Pyott S, Reim K, Varoqueaux F, Augustin I, Hesse D, Südhof TC, Takahashi M, Rosenmund C, et al. Beta phorbol ester- and diacylglycerol-induced augmentation of transmitter release is mediated by Munc13s and not by PKCs. Cell. 2002;108(1):121–33.
38. Sheu L, Pasyk EA, Ji J, Huang X, Gao X, Varoqueaux F, Brose N, Gai-sano HY. Regulation of insulin exocytosis by Munc13-1. J Biol Chem. 2003;278(30):27556–63.
39. Itoh Y, Kawamata Y, Harada M, Kobayashi M, Fujii R, Fukusumi S, Ogi K, Hosoya M, Tanaka Y, Uejima H, et al. Free fatty acids regulate insulin secretion from pancreatic beta cells through GPR40. Nature. 2003;422(6928):173–6.
40. Briscoe CP, Tadayyon M, Andrews JL, Benson WG, Chambers JK, Eilert MM, Ellis C, Elshourbagy NA, Goetz AS, Minnick DT, et al. The orphan G protein-coupled receptor GPR40 is activated by medium and long chain fatty acids. J Biol Chem. 2003;278(13):11303–11.
41. Brunham LR, Kruit JK, Pape TD, Timmins JM, Reuwer AQ, Vasanji Z, Marsh BJ, Rodrigues B, Johnson JD, Parks JS, et al. Beta-cell ABCA1 influences insulin secretion, glucose homeostasis and response to thiazolidinedione treatment. Nat Med. 2007;13(3):340–7.
42. Sturek JM, Castle JD, Trace AP, Page LC, Castle AM, Evans-Molina C, Parks JS, Mirmira RG, Hedrick CC. An intracellular role for ABCG1-mediated cholesterol transport in the regulated secretory pathway of mouse pancreatic beta cells. J Clin Invest. 2010;120(7):2575–89.
43. Hao M, Head WS, Gunawardana SC, Hasty AH, Piston DW. Direct effect of cholesterol on insulin secretion: a novel mechanism for pancreatic beta-cell dysfunction. Diabetes. 2007;56(9):2328–38.
44. Le SC, Bougnères P. Early changes in postprandial insulin secre-tion, not in insulin sensitivity, characterize juvenile obesity. Diabetes. 1994;43(5):696–702.
45. Shanik MH, Xu Y, Skrha J, Dankner R, Zick Y, Roth J. Insulin resistance and hyperinsulinemia: is hyperinsulinemia the cart or the horse. Diabetes Care. 2008;31(Suppl 2):S262–8.
46. Williams KJ, Wu X. Imbalanced insulin action in chronic over nutrition: clinical harm, molecular mechanisms, and a way forward. Atherosclerosis. 2016;247:225–82.
47. Hermans MP, Ahn SA, Rousseau MF. Novel unbiased equations to cal-culate triglyceride-rich lipoprotein cholesterol from routine non-fasting lipids. Cardiovasc Diabetol. 2014;13:56.
48. Miselli MA, Nora ED, Passaro A, Tomasi F, Zuliani G. Plasma triglycerides predict ten-years all-cause mortality in outpatients with type 2 diabetes mellitus: a longitudinal observational study. Cardiovasc Diabetol. 2014;13:135.
49. Tenenbaum A, Klempfner R, Fisman EZ. Hypertriglyceridemia: a too long unfairly neglected major cardiovascular risk factor. Cardiovasc Diabetol. 2014;13:159.
50. Sun GZ, Li Z, Guo L, Zhou Y, Yang HM, Sun YX. High prevalence of dys-lipidemia and associated risk factors among rural Chinese adults. Lipids Health Dis. 2014;13:189.
51. Huang Y, Gao L, Xie X, Tan SC. Epidemiology of dyslipidemia in Chinese adults: meta-analysis of prevalence, awareness, treatment, and control. Popul Health Metr. 2014;12(1):28.
52. Nakamura K, Miyoshi T, Yunoki K, Ito H. Postprandial hyperlipidemia as a potential residual risk factor. J Cardiol. 2016;67(4):335–9.
53. Riboldi BP, Luft VC, de Castilhos CD, de Cardoso LO, Schmidt MI, Barreto SM, de Sander MF, Alvim SM, Duncan BB. Glucose and triglyceride excur-sions following a standardized meal in individuals with diabetes: ELSA-Brasil study. Cardiovasc Diabetol. 2015;14:21.
54. Ohno Y, Miyoshi T, Noda Y, Oe H, Toh N, Nakamura K, Kohno K, Morita H, Ito H. Bezafibrate improves postprandial hypertriglyceridemia and associated endothelial dysfunction in patients with metabolic syndrome: a randomized crossover study. Cardiovasc Diabetol. 2014;13:71. 55. Kyaw TT, McGowan A, Phelan N, Correia N, Boran G, O’Connor AL, Roche