2013 – 2017 Gas Access
Arrangement Review (GAAR)
SP AusNet’s Revised Access
Arrangement Proposal (RAAP)
RAAP Chapter 1:
Demand Forecasts
2013 – 2017 GAAR: SP
AusNet Response to AER’s Draft Decision
RAAP CHAPTER 1 2 / 17
RAAP Chapter 1: Demand Forecasts
This chapter sets out SP AusNet’s response to the Draft Decision regarding Demand Forecasts (Attachment 9 of AER Draft Decision and its consultation report from ACIL Tasman).
This chapter updates the information provided in Chapter 4 of SP AusNet’s Initial Access Arrangement Proposal. In the event of inconsistency between information contained in this chapter and the Access Arrangement Information (AAI) submitted as part of its earlier proposal, the information contained in this chapter supersedes that contained in the AAI.
1 Introduction
In summary, SP AusNet:
does not accept amendments required by the Draft Decision with respect to estimates of Effective Degree Days (EDD);
accepts the revision to demand forecasts to reflect updated population data and forecasts.
does not accept the removal of the Demand Risk Adjustment Factor. The remainder of this attachment is structured as follows:
Section 2 explains Regulatory Requirements;
Section 3 sets out SP AusNet’s response to the Draft Decision on Demand Forecasts; Section 4 sets out SP AusNet’s response to the Draft Decision on the inclusion of a
Demand Risk Adjustment Factor.
In support of the information provided in this Chapter, the following Appendix is provided: RAAP Appendix 1.A: CIE Memo – Revisions to Demand Forecasts for SP AusNet The information set out in this Chapter accords with all of the applicable requirements of the NGR.
2
Demand Forecasts
2.1
Draft Decision
The Draft Decision approved SP AusNet’s proposed demand forecasts subject to updating new population data, and using AEMO’s estimates of Effective Degree Days (EDD) in place of the CSIRO’s. The AER indicated it was satisfied with the forecasting methodology developed by CIE but not its application, specifically regarding some of the modelling inputs.
2013 – 2017 GAAR: SP
AusNet Response to AER’s Draft Decision
RAAP CHAPTER 1 3 / 17
In relation to the methodology and approach submitted by SP AusNet, the AER found that the forecasting methodology provided a reasonable basis for determining demand forecasts1, noting:2
“SP AusNet applied a comprehensive and statistically rigorous approach to develop its proposed demand forecasts. The approach establishes the relationship between demand and its key drivers for each tariff class. The AER considers that SP AusNet's consultant (CIE) has been transparent in setting out its methods and assumptions. The AER's consultant (ACIL) also confirmed this view.” [footnotes omitted]
While the AER and its consultant, ACIL Tasman, identified some areas of potential deficiencies in the CIE model, the AER concluded that, on balance, redressing those issues was not certain to improve the quality of the forecasts:3
“The AER understands that the relationship between the demand for gas and its key drivers is complex. The combination of this complexity and data issues may have limited the explanatory power of forecasting models. The AER considers that an attempt to improve the model (in terms of either the range of explanatory variables included or the estimation of demand coefficients) is unlikely to result in significantly better or more reliable forecasts. In this context, and given SP AusNet's transparency in relation to its approach, the AER accepts that the methodology used to forecast the proposed demand is arrived at on a reasonable basis.” [footnotes omitted]
In relation to the application of the forecasting model, the Draft Decision required the following changes to input parameters:
Include the customer numbers for the new town Huntly, consistent with information provided to the AER by SP AusNet subsequent to lodging its Initial Access Arrangement Proposal4;
Update the population data and forecasts in line with new “Victoria in Future 2012” information released by the Victorian Department of Planning and Community Development (DPCD) subsequent to SP AusNet lodging its Initial Access Arrangement Proposal; and
Using AEMO’s forecasts for EDD in place of the CSIRO’s.
The AER rejected SP AusNet’s demand forecasts as it perceived that SP AusNet relied upon ‘weather normalisation’ that used the CSIRO’s EDD projections for the period 2005-2011, rather than actual data for those years:5
“ACIL identified that SP AusNet's forecasts are based on a projection of EDD between 2005 and 2011. ACIL stated that this approach is unusual and that a more appropriate approach would be to base an assumption about normal
1
AER, Access Arrangement Draft Decision SPI Networks (Gas) Pty Ltd 2013-17, Part 2, Attachment 9, Section 9.4, p.190
2
Ibid, Section 9.4.3, p.191
3
Ibid, Section 9.4.3, p.192
4
SP AusNet correspondence, Proposed Network Extension – Reticulation of the Huntly Township, 25 June 2012
5
2013 – 2017 GAAR: SP
AusNet Response to AER’s Draft Decision
RAAP CHAPTER 1 4 / 17
weather conditions on historical data. Such historical data has been published by AEMO following its 2012 review of weather standards for gas forecasting.”
The AER further stated that it:6
“..accepts ACIL's findings on weather normalisation. The AEMO's data for the six years to 2011 are based on actual observations (not on a projection as in the CSIRO's data). The AER considers that the AEMO's series is a reasonable basis and represents the best estimates possible under the circumstances. For this reason, it is appropriate for SP AusNet to use the current AEMO EDD standard as the basis for weather normalising the historical data.”
The AER stated that it believed AEMO’s forecast of EDD provided the best estimate possible in the circumstances and provided a reasonable basis for estimation and, as such, the use of the CSIRO EDD series resulted in demand forecasts that are:7
“..lower, on average, for each year of the regulatory period than they would have been if the AEMO regression line was used as the basis of weather normalisation.”
The Draft Decision approved forecasts of a total five-year growth in residential customer numbers of 12.63% and 3.46% for commercial customers.
The Draft Decision accepted the forecasts set out in SP AusNet’s Initial Access Arrangement Proposal for Tariff D and Tariff M.
2.2
Response to Draft Decision
SP AusNet accepts the revisions required by the Draft Decision to update population data and population forecasts, and account for the new town of Huntly in the customer and energy demand forecasts. However, SP AusNet does not accept the amendments required by the Draft Decision relating to ‘weather normalisation’ and the use of AEMO EDD forecasts.
The net result of the Draft Decision amendments to demand forecasts overstates likely energy consumption in SP AusNet’s gas network for the forthcoming regulatory period. Over-estimating energy consumption threatens SP AusNet’s ability to recoup its full revenue requirement because the price cap that is approved will be based on a higher volume than is likely to materialise.
SP AusNet’s detailed response on these issues is set out below.
2.2.1Updated model
In response to an information request from the AER, SP AusNet provided a version of its demand forecasting model (25 July 2012) that enabled the AER to review the impacts of adjustments to SP AusNet’s demand forecasts, including updates to population data and choice of EDD forecast (CSIRO or AEMO).
It was this model that was the basis for the revised forecasts that the AER approved in the Draft Decision.
6
Ibid, Section 9.4.4, p.194
7
2013 – 2017 GAAR: SP
AusNet Response to AER’s Draft Decision
RAAP CHAPTER 1 5 / 17
In support of its RAAP, SP AusNet is providing a further update to its demand forecast model.8 The update corrects a minor cell referencing error that was identified following the release of the Draft Decision.
A statement from CIE is attached to this RAAP Chapter setting out the basis on which the revised forecast model was determined.9
2.2.2Updated population data
The DPCD released updated population data and forecasts in its “Victoria in Future 2012” publication. The information contained in this publication superseded the data forecasts that were used as an input to CIE’s demand forecasting model.
SP AusNet accepts the inclusion of the newer forecast data, and has used the revised customer numbers in the updated model, as required by the Draft Decision.
2.2.3Weather normalisation
Historical ‘projections’ not used to weather normalise
The Draft Decision and the AER’s consultant report from ACIL Tasman appear to reflect a misunderstanding about how the CSIRO EDD forecast was utilised in SP AusNet’s demand forecasting model.
For example, the Draft Decision states that:10
“SP AusNet used measures of annual effective degree days (EDD) derived by the CSIRO to normalise historic gas consumption data.”
Similarly, statements in the ACIL Tasman report seem to indicate that it believes that the ‘weather normalisation’ conducted by CIE used CSIRO’s forecast EDD for 2005 to 2010 rather than the actual EDDs for those years:11
“In our experience it is unusual to use a projection as the basis for weather normalising historical data. It is not clear from CSIRO’s report that CSIRO intended its projections to be used this way or that this is an appropriate use for them. A more usual approach would be to base an assumption about normal weather conditions on historical data.”
This statement is incorrect. CIE used the CSIRO forecast of EDD as the forecast of ‘normal’ weather conditions for the years 2012 to 2017. This was used to forecast the weather-related component of future gas demand.
The use of a forecast of future ‘normal’ weather conditions is not to be confused with the analysis that was undertaken of historical gas consumption and weather conditions to determine the effects of weather on consumption. CIE completed its historical analysis of the weather impacts on gas demand using actual EDD and gas consumption data for those years. It is this analysis that underpins the weather parameters and correlations used as
8 SP AusNet Revised Demand Model – CIE. 9
RAAP Appendix 1.A.
10
AER, Access Arrangement Draft Decision SPI Networks (Gas) Pty Ltd 2013-17, Part 2, Attachment 9, p.192
11
2013 – 2017 GAAR: SP
AusNet Response to AER’s Draft Decision
RAAP CHAPTER 1 6 / 17
inputs to the demand forecasting model. Therefore, the CSIRO’s EDD were not used in historic ‘weather normalisation’ by SP AusNet.
A statement from CIE clarifying how EDD forecasts and actual EDD were used in the development of their model is provided as Appendix 1.A to this Chapter.12
It is noted that the forecasting model that produced the demand forecasts approved in the Draft Decision included parameters for weather effects that were unchanged from those in the model submitted with the Initial Access Arrangement Proposal. That is, the switch from the CSIRO’s EDD forecast to AEMO’s EDD forecast did not affect the amount by which gas consumption varies with weather changes as this was determined from historical analysis. The switch did affect the forecast of gas consumption because of the different forecast of future normal weather conditions.
Therefore, the fundamental issue is which EDD forecast is the most appropriate – AEMO’s forecast, being a multifactorial method based on the concept of Heating Degree Days (HDD),13 or the CSIRO’s, which is based on its climate modelling, inclusive of the Urban Heating Island (UHI) effect plus medium anthropogenic global warming.
Absence of 2006 to 2010 had no major effect on CSIRO forecast
Given that the CSIRO’s EDD forecasts are not being used to normalise consumption data for weather effects, the issue for consideration is whether the effect of the CSIRO not revising its analysis to include 2006 to 201014 data has introduced bias into its forecasts. The CSIRO addressed this issue in its report, submitted as Appendix 4B to SP AusNet’s Initial Access Arrangement Proposal. The CSIRO stated that its work, which updated previous analysis and extended its forecasts to 2017, assumed:15
“The availability of new observed temperatures in Melbourne between 2006 and 2010 does not significantly modify the long-term trends from 1950 estimated in the previous report, i.e. the rate of increase in average temperature at Melbourne central weather station based on the records from 1950 to 2010 does not show a significant difference compared to the period from 1950 to 2005.”
The same report outlined the CSIRO’s validation of that assumption: 16
“In this update, it is assumed that continuing trends in temperature, the contribution of urbanisation and greenhouse warming trends remain the same as in the previous study. We would estimate that a more thorough study which fully employed observations for the intervening years of 2007 to 2010 and direct model output for those years from more up to date simulations would not lead to estimates significantly different from those provided here. This is because the additional data has little impact on the observed long term warming trend in Melbourne average temperature and the model estimated anthropogenic warming trend is very similar for 2012-2017 to what it is in the previous five years. Both previous (CSIRO, 2001) and latter (CSIRO and Bureau of Meteorology,
12
RAAP Appendix 1.A.
13
ACIL Tasman, Review of Demand Forecast for SP AusNet, Victorian GAAR for the period 2013-2017, p. 25
14
The ACIL report refers to the period for which projections were used in place of actual data as 2005-2010. However the CSIRO report identifies this period as 2006-2010. The AER refers to the period 2005 to 2011.
15
CSIRO, Projected Changes in Temperature and Heating Degree-days for Melbourne 2012-2017, AAI Appendix 4B, p.5
16
2013 – 2017 GAAR: SP
AusNet Response to AER’s Draft Decision
RAAP CHAPTER 1 7 / 17
2007) climate change projections for Melbourne have the similar increase in average temperature of 0.9°C by 2030.” [emphasis added]
The importance of the long-term trends to the CSIRO’s weather modelling, rather than near-term data, was reiterated in its response dated 30 May 2012 to an information request issued by the AER on 15 May 2012 regarding the applicability of this forecasting approach to the five year horizon of the forthcoming regulatory period:17
“CSIRO projections on HDD/EDD are based on projected long-term trends in average temperature and urban heat island intensity. These projections are consistent with our understanding of the climate system and are scientifically appropriate. However, it is important to note that what we project is a trend in underlying climatic conditions. It does not include natural year-to-year variability. We project a small trend in the reference ‘normal’ conditions consistent with long-term warming trends. This effectively changes the odds each year in the risk of a hot or cold year. The actual deviation from normal conditions for each individual year is not predicted.”
SP AusNet notes that the absence of year-to-year variability is appropriate to forecasting normal conditions.
While the CSIRO’s forecasts have been criticised for the failure to use 2006 to 2010 actual data, AEMO only produced a forecast for the planning period years of 2012 to 2016.18 It is not clear that AEMO intended for their trend analysis to be extrapolated beyond 2016, as required by the Draft Decision.
CSIRO are best estimates in the circumstances
The CSIRO is recognised internationally as a climate expert. It is in partnership with the Bureau of Meteorology to form the Centre for Australian Weather and Climate Research.19 SP AusNet considers neither itself, the AER, AEMO, nor ACIL Tasman could possibly have a superior level of expertise in the area of climate forecasting.
This is important because climate forecasting involves understanding of complex scientific systems that exhibit slow moving trends. The latter is important to preparing accurate forecasts of gas consumption, and this is the reason why long-term data series are required, and the use of short term trends and/or projections are a less robust means of predicting future climate outcomes.
SP AusNet considers that the CSIRO is clearly the most qualified organisation to provide a robust climate forecast for the purposes of deriving gas usage forecasts for the forthcoming access arrangement period.
Citing the inclusion of actual data from 2005 to 2010 as the most important factor to producing a good climate forecast ignores other key differences in methodology between the CSIRO and AEMO forecasts. This is particularly the case given the CSIRO’s prior statements that these data would have minimal effect on its forecast and AEMO’s explicit statement regarding its own forecasts that:20
17
CSIRO, 30 May 2012, Response to Request for Information, p.3
18
AEMO, 2012 Review of Weather Standards for Gas Forecasting. Part 1-Victorian EDD review, April 2012, p.12
19
The Centre for Australian Weather and Climate Research, http://www.cawcr.gov.au/aboutus.php
20
2013 – 2017 GAAR: SP
AusNet Response to AER’s Draft Decision
RAAP CHAPTER 1 8 / 17
“The report does not conclude which EDD standards are appropriate for use in Access Arrangement (AAI) forecasts.”
ACIL Tasman is correct that the use of the CSIRO EDD forecast results in a lower demand forecast than AEMO’s EDD forecast. However to adopt a forecast on this basis would be an error. SP AusNet believes the CSIRO forecasts are arrived at on a reasonable basis and are the best forecasts available under the circumstances. Hence the demand forecasts based on the CSIRO EDD forecast are the best available demand forecasts for SP AusNet’s network.
2.3
Revised Proposal
SP AusNet has updated its demand forecasts for updated population data and population forecasts, and to account for the new town of Huntly, as required by the Draft Decision. SP AusNet rejects the use of the AEMO EDD forecast of future normal weather conditions, and retains the CSIRO’s EDD forecast in its model.
Consequently, SP AusNet’s revised forecast for customer numbers and usage is consistent with clause 74(2) of the NGR.
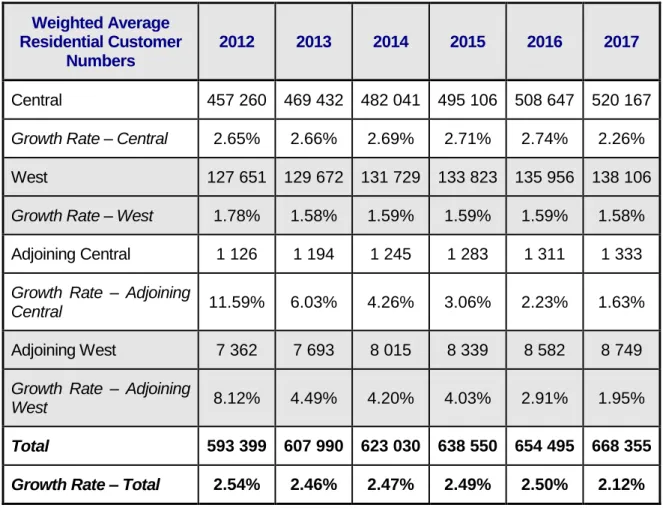
Table 2-1: Revised forecast residential customer numbers
Weighted Average Residential Customer
Numbers
2012 2013 2014 2015 2016 2017
Central 457 260 469 432 482 041 495 106 508 647 520 167
Growth Rate – Central 2.65% 2.66% 2.69% 2.71% 2.74% 2.26%
West 127 651 129 672 131 729 133 823 135 956 138 106
Growth Rate – West 1.78% 1.58% 1.59% 1.59% 1.59% 1.58%
Adjoining Central 1 126 1 194 1 245 1 283 1 311 1 333 Growth Rate – Adjoining
Central 11.59% 6.03% 4.26% 3.06% 2.23% 1.63%
Adjoining West 7 362 7 693 8 015 8 339 8 582 8 749 Growth Rate – Adjoining
West 8.12% 4.49% 4.20% 4.03% 2.91% 1.95%
Total 593 399 607 990 623 030 638 550 654 495 668 355
Growth Rate – Total 2.54% 2.46% 2.47% 2.49% 2.50% 2.12%
2013 – 2017 GAAR: SP
AusNet Response to AER’s Draft Decision
RAAP CHAPTER 1 9 / 17
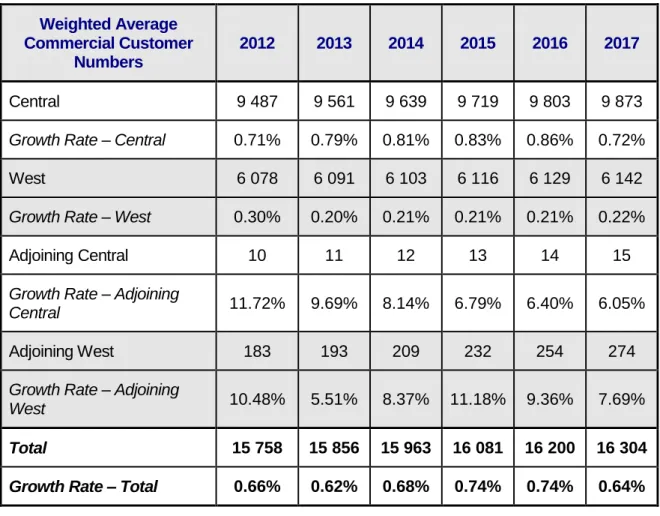
Table 2-2: Revised forecast average commercial customer numbers
Weighted Average Commercial Customer
Numbers
2012 2013 2014 2015 2016 2017
Central 9 487 9 561 9 639 9 719 9 803 9 873
Growth Rate – Central 0.71% 0.79% 0.81% 0.83% 0.86% 0.72%
West 6 078 6 091 6 103 6 116 6 129 6 142
Growth Rate – West 0.30% 0.20% 0.21% 0.21% 0.21% 0.22%
Adjoining Central 10 11 12 13 14 15
Growth Rate – Adjoining
Central 11.72% 9.69% 8.14% 6.79% 6.40% 6.05%
Adjoining West 183 193 209 232 254 274
Growth Rate – Adjoining
West 10.48% 5.51% 8.37% 11.18% 9.36% 7.69%
Total 15 758 15 856 15 963 16 081 16 200 16 304
Growth Rate – Total 0.66% 0.62% 0.68% 0.74% 0.74% 0.64%
2013 – 2017 GAAR: SP
AusNet Response to AER’s Draft Decision
RAAP CHAPTER 1 10 / 17
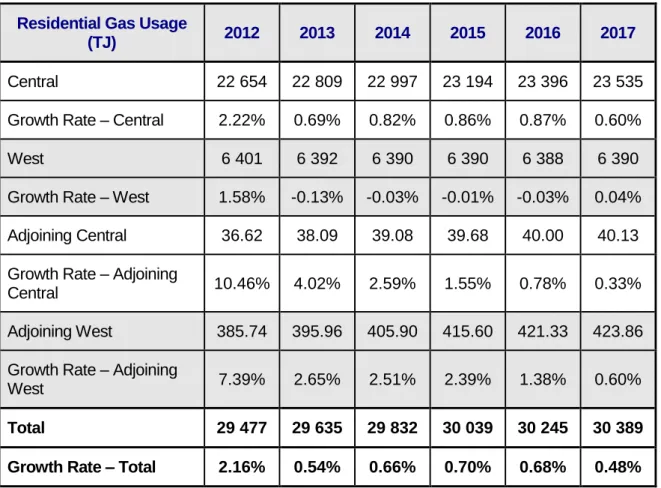
Table 2-3: Revised forecast residential gas usage
Residential Gas Usage
(TJ) 2012 2013 2014 2015 2016 2017
Central 22 654 22 809 22 997 23 194 23 396 23 535 Growth Rate – Central 2.22% 0.69% 0.82% 0.86% 0.87% 0.60%
West 6 401 6 392 6 390 6 390 6 388 6 390
Growth Rate – West 1.58% -0.13% -0.03% -0.01% -0.03% 0.04% Adjoining Central 36.62 38.09 39.08 39.68 40.00 40.13 Growth Rate – Adjoining
Central 10.46% 4.02% 2.59% 1.55% 0.78% 0.33%
Adjoining West 385.74 395.96 405.90 415.60 421.33 423.86 Growth Rate – Adjoining
West 7.39% 2.65% 2.51% 2.39% 1.38% 0.60%
Total 29 477 29 635 29 832 30 039 30 245 30 389
Growth Rate – Total 2.16% 0.54% 0.66% 0.70% 0.68% 0.48%
2013 – 2017 GAAR: SP
AusNet Response to AER’s Draft Decision
RAAP CHAPTER 1 11 / 17
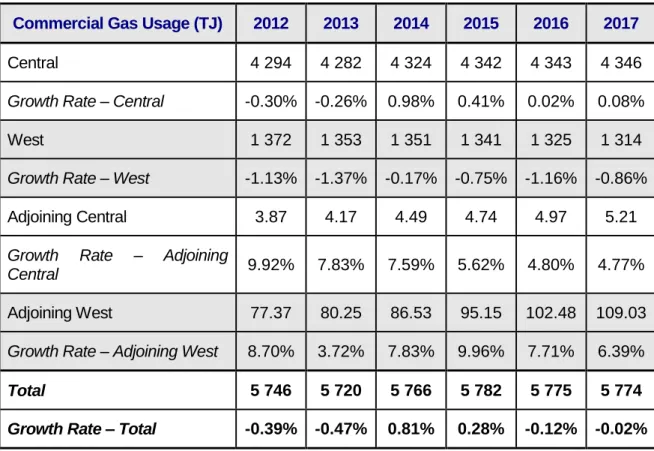
Table 2-4: Revised forecast commercial gas usage
Commercial Gas Usage (TJ) 2012 2013 2014 2015 2016 2017
Central 4 294 4 282 4 324 4 342 4 343 4 346
Growth Rate – Central -0.30% -0.26% 0.98% 0.41% 0.02% 0.08%
West 1 372 1 353 1 351 1 341 1 325 1 314
Growth Rate – West -1.13% -1.37% -0.17% -0.75% -1.16% -0.86%
Adjoining Central 3.87 4.17 4.49 4.74 4.97 5.21
Growth Rate – Adjoining
Central 9.92% 7.83% 7.59% 5.62% 4.80% 4.77%
Adjoining West 77.37 80.25 86.53 95.15 102.48 109.03
Growth Rate – Adjoining West 8.70% 3.72% 7.83% 9.96% 7.71% 6.39%
Total 5 746 5 720 5 766 5 782 5 775 5 774
Growth Rate – Total -0.39% -0.47% 0.81% 0.28% -0.12% -0.02%
Source: SP AusNet Revised Demand Model-CIE.xls
3
Demand Risk Adjustment Factor
3.1
Draft Decision
The Draft Decision rejected SP AusNet’s proposal for a Demand Risk Adjustment Factor21,
which was proposed to mitigate against the risk of rapid increases in wholesale gas prices (e.g. east coast gas prices adjusting to world price parity due to LNG plants creating a greater tradability of gas).
While the AER agreed that the commissioning of LNG export projects has the potential to drive up domestic wholesale gas prices, it did not agree that it was likely that Victorian gas prices would rise significantly enough in the next period to warrant the proposed tariff adjustment. The AER pointed to evidence which suggested:
the gas market is governed by long term supply and transportation contracts that will slow the impact of emerging LNG export opportunities on domestic prices;
the Queensland government has forecast the impact on gas prices in that state to be $5-8 per gigajoule by 2016, with prices rising more slowly in Victoria; and
21 Referred to as a ‘Demand True Up’ by the AER,
Access Arrangement Draft Decision SPI Networks (Gas) Pty Ltd 2013-17, Part 2, Attachment 11, p.221
2013 – 2017 GAAR: SP
AusNet Response to AER’s Draft Decision
RAAP CHAPTER 1 12 / 17
it is likely that government agreements will be in place to reserve some gas for domestic markets as this is a common policy measure used to slow domestic price impacts.22 In coming to this conclusion, the AER stated that:23
“In accordance with r. 97(3)(d) of the NGR the AER has taken into account the fact that no other Victorian gas service provider has proposed to introduce a demand true up factor in the annual tariff variation mechanism.”
It further states that:24
“Under the NGR, the AER can reject a proposed element of the reference tariff variation mechanism if it considers a preferable alternative exists that better promotes the requirements in the NGR and NGL. For the above reasons, the AER considers that the proposed tariff variation formula revised to remove the demand risk factor would constitute a better alternative. Therefore, the AER does not approve the adjustment factor as proposed by SP AusNet. The AER requires SP AusNet to revise the proposed tariff variation mechanism by removing the demand true up component from the adjustment factor as outlined in revision 1.7.”
3.2
Response
SP AusNet disputes the AER’s position and its analysis for the following reasons:
Its decision to remove the Demand Adjustment Factor is in fact inconsistent with the National Gas Law and the Revenue and Pricing Principles.
The AER’s analysis of the materiality of the likely outcomes in the competitive gas market is flawed.
There is a consequential impact on the cost of equity that has not been considered by the AER.
3.2.1The National Gas Law and Revenue and Pricing Principles
As was outlined in SP AusNet’s Access Arrangement Information:25
“If actual wholesale and retail gas prices are materially higher, then SP AusNet’s actual demand will be lower than forecast and revenue recovery will not be achieved. Such an outcome would be inconsistent with the NGL s.24(2) requirements that SP AusNet be provided a reasonable opportunity to at least recover its efficient costs.”
22
Ibid, Part 2, Attachment 11, p.222-223
23
Ibid, p. 223
24
Ibid, p. 223
25
2013 – 2017 GAAR: SP
AusNet Response to AER’s Draft Decision
RAAP CHAPTER 1 13 / 17
SP AusNet went on to say that there were two possible ways of mitigating this asymmetric risk:26
“CIE could adopt an ex ante, probability-weighted estimate of the possible wholesale gas price forecasts, for inclusion in their gas usage forecasts model; or The AER could allow SP AusNet to adopt an ex post adjustment in the price control formula to accommodate for the actual outcomes that result from this risk eventuating.”
The reasons for SP AusNet choosing the demand adjustment factor were clearly outlined in its Initial Access Arrangement Proposal.
The Draft Decision has, in effect, provided no protection to SP AusNet for this asymmetric, exogenous risk, because it not allowed for either of the two options outlined in SP AusNet’s Initial Access Arrangement Proposal to be adopted. The AER’s position appears to be primarily based on the ‘unlikeliness’ of this event/s occurring in the forthcoming access arrangement period.
For example, the AER states that:27
“The AER considers that Victorian gas prices will respond to upward pressure with a lag; and this is unlikely to occur within the 2013–17 access arrangement period.”
The terms ‘will’ and ‘unlikely’ are both pertinent. The former implies that the AER agrees with SP AusNet’s initial position that there is a real (asymmetric) risk that gas prices will increase at some point in the future. The term ‘unlikely’ (which SP AusNet contends is an inappropriate term, but this is discussed in further detail in the next section) indicates that the AER also agrees with SP AusNet that there is a possibility that this could happen in the forthcoming access arrangement period.
Taken together, the above statement reaffirms SP AusNet’s original position that this is a real risk, and if the risk eventuates, it would lead to outcomes that would be inconsistent with the requirements of section 24(2) of the NGL that SP AusNet be provided a reasonable opportunity to at least recover its efficient costs.
However, SP AusNet contends that the ‘unlikeliness’ (or probability) of an event is not the only threshold test under the NGL and the Revenue and Pricing Principles that can be used to support rejecting SP AusNet’s proposed demand adjustment factor. The other two aspects that must be considered are the administrative costs of dealing with the event if it were to occur, and the consequence of the event.
In relation to the former, in theory, detailed analysis of the administrative costs would need to be undertaken to assess whether the costs associated with establishing such an adjustment factor, and assessing applications under that adjustment factor, are less than the potential costs (probability multiplied by consequence) to SP AusNet of not having an adjustment factor for such events. Whilst SP AusNet has not undertaken a detailed costing exercise to estimate the administrative costs, it considers it reasonable to assume that these costs would be immaterial, given that all the parameters required to make the assessment are publically available, and the formula has been transparently outlined in its submission.
26
Ibid, p.220
27
2013 – 2017 GAAR: SP
AusNet Response to AER’s Draft Decision
RAAP CHAPTER 1 14 / 17
The probability and consequence of such events are discussed below.
3.2.2Analysis of the probability and consequence of such events is flawed
SP AusNet disputes some of the analysis undertaken by the AER to support the probability and consequence of a wholesale price increase events occurring. For example, the assertion that the “gas market is governed by long term supply and transportation contracts that will slow the impact of emerging LNG export opportunities on domestic prices” ignores the economic reality that if the opportunity cost of gas increases, this impacts on the prices that will be charged to end customers (unless it is end customers that have entered into long term contracts). Put another way, if the opportunity cost of selling gas into the domestic retail market increases – which it will if the counterparty to a gas contract could instead on sell that gas to an LNG provider – this will in turn drive pricing decisions in the domestic retail market. It also clearly increases the cost to the marginal retailer.
Further, the reference to historic instances of Governments’ quarantining gas for domestic use, as a reason that east coast price impacts will be slow28is totally subjective and, to our knowledge, is not based on any stated current Government’s policy position.
In contrast, the Federal Government’s recent Energy White Paper noted that east coast markets were already beginning to experience upward pressure on prices:29
“While we have adequate overall reserves of gas to meet projected domestic and export production needs in all markets until at least 2035, there may be some transitional tightness in the east coast gas market as new coal-seam gas and LNG projects ramp up to full production. These factors are already manifesting in higher gas prices and tighter supply dynamics.”
Finally, SP AusNet notes that the potential impact on its gas usage needs to be considered in the context of the magnitude of the downside risks it faces.
In particular, recent changes in energy demand have demonstrated that a historic break point has been reached where demand has started to fall – this creates a new period of uncertainty for energy network businesses, the bulk of whose costs are, in economic terms, sunk.
The forecasts provided by AEMO for demand growth on the Declared Transmission System (DTS) has seen a decrease in growth rate (1.5% compared to 2%) compared to last year’s Victorian Annual Planning Report Update. This is due to:
greater global economic uncertainty; carbon pricing; and
forecast downsizing of manufacturing plant operations or plant closures.30
28
AER, Access Arrangement Draft Decision SPI Networks (Gas) Pty Ltd 2013-17, Part 2, Attachment 11, pp.222-223
29
DRET, Energy White Paper 2012, p.xiv.
30
AEMO, 2011, Gas Statement of Opportunities 2011 (GSSO 2012), Attachment A1. Victorian Gas Declared Transmission Medium Term Outlook. http://www.aer.gov.au/sites/default/files/APA%20GasNet%20-%20Attachment%20A1%20-%20Victorian%20Gas%20DTS%20Medium%20Term%20Outlook.pdf. Accessed 02/11/12, p.2.
2013 – 2017 GAAR: SP
AusNet Response to AER’s Draft Decision
RAAP CHAPTER 1 15 / 17
The forecasts were based on high, medium and low growth economic scenarios, with carbon prices in the core policy scenario.
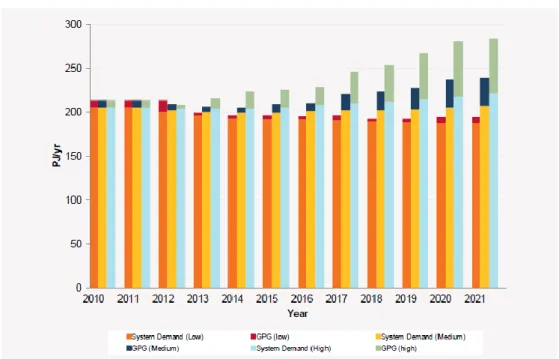
Figure 1-1: Annual System forecast, all scenarios
Source: reproduced from AEMO, GSSO 201131, p.A1-13. Includes DTS-connected Gas Powered Generation.
This graph demonstrates that in forecasting the DTS system which takes into account policy, population and economic growth, there is a decrease in demand for system demand over the next few years for both low and medium cases. It also demonstrates the large variance in forecasts for each scenario adding to uncertainty for future demand. The Tariff V class, which accounts for 58% of gas demand32, is driven by population growth, employment levels, and household income. A decrease in demand is attributed to improved gas appliances, increased reverse-cycle air conditioner usage for heating, and reduced water heating.33
3.2.3SP AusNet has Victoria’s highest growth forecast
As the distribution business with the highest forecast growth in the forthcoming access arrangement period, SP AusNet is potentially the most susceptible to negative impacts from a rapid rise in gas prices.
The revisions the Draft Decision requires further compound the risk by making upward revisions to the demand forecasts.
31
Ibid, p.13.
32
Ibid, p.1.
33
2013 – 2017 GAAR: SP
AusNet Response to AER’s Draft Decision
RAAP CHAPTER 1 16 / 17
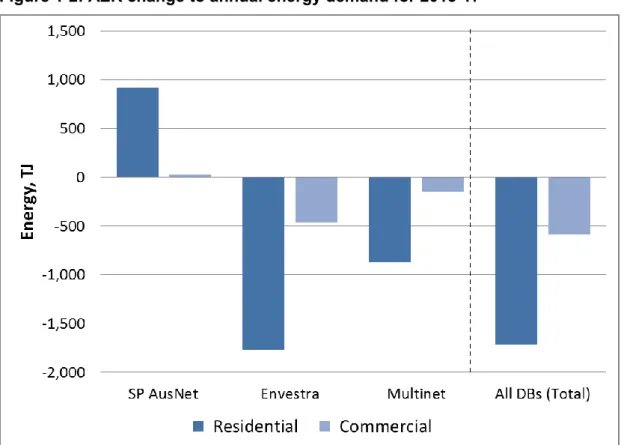
In the Draft Decision, the AER approved forecasts that total gas demand in Victoria will fall in the forthcoming access arrangement period. In contrast to the overall trend, the AER required revisions to SP AusNet’s demand forecasts that increase the energy demand in SP AusNet’s network area in the five year period.
Figure 1-2: AER change to annual energy demand for 2013-17
Source: SP AusNet analysis of Draft Decisions and Access Arrangement Proposals.
Figure 1-2 summarises the differences between the demand forecasts in the Draft Decision with the forecasts proposed by each Victorian gas distribution business for residential and commercial usage from the base year 2012 to 2017. It highlights that there is an overall negative amount of usage for the forecast period.
3.2.4Risks put on networks without adequate compensation in the cost of equity
The issue of increased uncertainty in demand is amplified by the fact the cost of equity approved by the AER in its recent revenue determinations has been falling.
The cost of equity should reflect the risk inherent in the business. However, recent decisions of the AER have not reflected this, resulting in a lower, rather than higher, cost of equity. More specifically, the increased exposure of domestic gas markets to world gas prices exposes SP AusNet to a higher non-diversifiable risk, which in turn, increases its beta. In particular, fluctuations in the world economy will now be inherently linked to demand for energy which, as implied above, flows through to the equilibrium price for LNG, which in turn will flow through to the domestic price for gas.
2013 – 2017 GAAR: SP
AusNet Response to AER’s Draft Decision
RAAP CHAPTER 1 17 / 17
This linkage increases the overall non-diversifiable risk, which underpins the derivation of the equity beta.
3.3
Revised Proposal
SP AusNet rejects the Draft Decision on the Demand Risk Adjustment factor and reasserts the case for the Demand Risk Adjustment Factor it proposed in its Initial Access Arrangement Proposal.
If the AER does not approve SP AusNet’s proposed adjustment factor, it must approve SP AusNet’s demand forecasts.