© 2019 by the Serbian Biological Society How to cite this article: Јovanović NŽ, Žunić SS, Trbojević-Stanković JB, Laušević 187 ŽD, Nešić DM, Stojimirović BB. The relationship between vascular endothelial growth factor (VRGF) in the serum and drained dialysate with the quality of peritoneal dialysis and peritoneal membrane transport rates. Arch Biol Sci. 2019;71(1):187-94.
The relationship between vascular endothelial growth factor (VEGF) in the serum
and drained dialysate with the quality of peritoneal dialysis and peritoneal membrane
transport rates
Nataša Ž. Jovanović1, Snežana S. Žunić2, Jasna B. Trbojević-Stanković3, Željko D. Laušević4, Dejan M. Nešić5
and Biljana B. Stojimirović1,*
1Clinic of Nephrology, Clinical Center of Serbia, Faculty of Medicine, University of Belgrade, Serbia
2Institute of Pathophysiology, Faculty of Medicine, University of Belgrade, Serbia
3Clinic of Urology, University Clinical Center “Dr Dragiša Mišović – Dedinje”, Faculty of Medicine, University of Belgrade,
Serbia
4Institute for Digestive diseases, Clinical Center of Serbia, Faculty of Medicine, University of Belgrade, Serbia
5Institute of Medical Physiology, Faculty of Medicine, University of Belgrade, Serbia
*Corresponding author: [email protected]
Received: November 20, 2018; Revised: December 19, 2018; Accepted: December 22 2018; Published online: December 27, 2018
Abstract: Vascular endothelial growth factor (VEGF), a powerful angiogenetic agent crucial for microvascular hyperper-meability and neoangiogenesis in the peritoneum, is associated with increased solute transport rates in chronic peritoneal dialysis (PD) patients. We investigated the correlation between serum and drained dialysate (dd) concentrations of VEGF and the transport characteristics of peritoneal membrane and dialysis quality in 20 patients with end-stage renal failure at the beginning and after six months of PD. The serum VEGF (sVEGF) concentration rose significantly (149.33±116.71 pg/ mL vs 239.36±102.23 pg/mL; p=0.012) and ddVEGF concentration increased slightly (38.44±50.47 pg/mL vs 43.55±51.10 pg/mL) during the first 6 months of PD. At the beginning of chronic PD, ddVEGF concentrations correlated inversely with the peritoneal equilibrium test (PET) glucose (R=-0.565; p=0.009) and creatinine (R=-0.506; p=0.023) and residual renal function (RRF) (R=-0.691; p=0.001); sVEGF concentrations inversely correlated with PET creatinine (R=-0.457; p=0.043) and residual diuresis (RD) (R=-0.691; p=0.001). After 6 months of treatment, ddVEGF concentrations correlated directly with PETcreatinine (R=0.450; p=0.047), and inversely with RRF (R=-0.552; p=0.012) and residual renal weekly Kt/V (R=-0.488; p=0.029). The sVEGF concentration inversely correlated with RD (R=-0.589; p=0.006). High ddVEGF at the beginning of PD is predictive of adverse alterations of the peritoneal membrane, i.e. increased transport rate of glucose and creatinine. ddVEGF values may help to identify patients who will preserve adequate transport characteristics of the peritoneal mem-brane and maintain successful long-term PD.
Keywords: dialysis quality; peritoneal dialysis; peritoneal equilibration test; residual renal function; vascular endothelial growth factor
INTRODUCTION
Peritoneal dialysis is a well-established renal-replace-ment treatrenal-replace-ment for patients affected by end-stage renal disease. Long-term exposure to bioincompatible dialysis fluid, repeated episodes of bacterial peritonitis, chronic inflammation of the peritoneal membrane, mechanical problems with peritoneal catheter, hypoproteinemia and ultrafiltration failure all seriously affect patient survival in long-term PD [1].
Increased angiogenesis is believed to be a major pathohistological alteration during chronic PD, eventu-ally leading to serious complications in long-term PD represented by increased peritoneal solute transport rates and ultrafiltration failure [2-5]. Angiogenesis is the formation of new blood vessels from pre-existing endothelium. Some angiogenetic factors, such as VEGF, are increased in uremic conditions and upon exposure to high glucose solution during PD [6].
The vasopermeability factor, also known as vascular endothelial growth factor (VEGF), is a glycoprotein with a huge affinity for endothelial cells and it is also a powerful factor of angiogenesis. Different cell types produce VEGF in ischemic, hypoglycemic and hyper-glycemic conditions under the influence of cytokines such as IL-6, hormones, inactivated oncogenes, vHL and p53, and growth factors such as TGF-β1. The VEGF factor is detected on human endothelial cells of peri-toneal blood vessels [7,8]. In patients on chronic PD, VEGF is upregulated in the peritoneal membrane and is present in drained dialysate. Cultured mesothelial and endothelial cells isolated from the peritoneum produce VEGF [9,10]. It has been proven that VEGF plays a key role in neoangiogenesis in diabetic proliferative retinopathy and, by analogy, in the development of microvascular hyperpermeability and neoangiogenesis of the peritoneum during chronic PD treatment [10]. Neoangiogenesis is responsible for the enlargement of the effective peritoneal vascular area and increased solute transport rate [11-13].
Serum VEGF (sVEGF) concentrations vary widely and different studies have reported ranges from 66 to 1180 ng/L, 20.1 to 1492 pg/mL and from 17.4 to 347.5 pg/mL [14, 15].
The aim of this study was to investigate the cor-relation between serum and drained dialysate VEGF
concentrations, dialysis quality and transport properties of the peritoneal membrane in patients at the begin-ning and after six months of chronic PD.
MATERIALS AND METHODS
Patients
The study protocol was reviewed and approved by the Ethics Committee, Faculty of Medicine, University of Belgrade. After a thorough explanation of the study procedure, all patients signed informed consent to participate in the study. All blood samples were col-lected in accordance with the Declaration of Helsinki as revised in 2000.
We included 20 patients with end-stage kidney disease whose basic demographic data and presence of diabetes mellitus are presented in Supplementary Table S1. The patients were free of clinical and laboratory signs of infection 4 weeks prior to enrollment. Patients used at least 8 L of conventional lactate-buffered acidic (pH 5.5) PD fluid daily, with glucose concentrations ranging from 1.25 to 2.76%, and drained a higher amount than instilled.
Blood analyses
Fasting venous blood samples were taken in K3EDTA
vacutainer tubes to determine the complete blood count (CBC) and in biochemistry vacutainer vials to measure serum concentrations of glucose, urea, creatinine, albumin and iron, total iron-binding capacity (TIBC), ferritin, fibrinogen and C-reactive protein. The blood samples were centrifuged at 2000 x g for 10 min. The concentrations of glucose, urea, creatinine and albumin were assessed in 24-hour urine and drained dialysate.
The CBC was determined with the Beckman
Coul-ter® HmX Hematology Analyzer.Hemoglobin (HGB)
was determined by the cyanmethemoglobin method. The biochemical analyzer ARCHITECT ci8200
(Abbott Diagnostics, Wiesbaden, Germany)was used to
concentrations of VEGF in the serum and dd after an 8-h dialysis dwell. Sandwich enzyme-linked immuno-sorbent assay (ELISA) kits from Quantikine® Human VEGF were used to determine the concentrations of VEGF, sVEGF and ddVEGF. Blood and dialysate samples taken after an 8-h overnight dialysis dwell to determine concentrations of VEGF were immediately stored at -70°C before the estimation. A monoclonal antibody specific for VEGF was precoated onto mi-croplates. Samples and VEGF standards were pipetted into the wells and any VEGF present was bound by the immobilized antibody. After washing away any unbound substances, an enzyme-linked polyclonal antibody specific for VEGF was added to the wells. Following washing to remove any unbound reagent, a substrate solution was added to the wells and color proportionate to the concentration of bound VEGF bound in the initial step was developed, and its inten-sity was measured. Intra- and interassay coefficients of variation were 2.6 and 9.8%, respectively, and the lower limit of detectability was 3.5 pg/mL.
Peritoneal dialysis quality was assessed by cal-culating the total weekly Kt/V and the total weekly ClCr, which are the sum of the peritoneal and residual renal components. Peritoneal dialysis was performed continuously and dialysis quality was assessed at 7-day intervals [16].
Peritoneal and residual renal Kt/V and ClCr were calculated using Watson’s formula [17]. ClCr was nor-malized according to the body surface area, calculated using Dubois-Dubois’ formula [18].
RRF was calculated as the mean value of residual clearance of urea and residual ClCr.
PCR and nPCR were calculated according to Berg-strom’s [19] or Randerson’s formula [20].
Peritoneal membrane transport characteristics were examined by the standard PET according to Twardowski[19, 21].
Statistical analysis
Data were analyzed with SPSS ver. 20.0. Serum and ddVEGF concentrations were expressed as mean values±median, since they were not normally distributed.
Other results were expressed as means±SD. Data were analyzed with Student’s t-test, χ2 and Mann-Whitney
tests. Pearson’s product-moment coefficient and Spear-man’s rank correlation coefficient were used to analyze the correlations. A p value of less than 0.05 was used as the criterion for a statistically significant difference.
RESULTS
Biochemical parameters
Biochemical parameters were in agreement with the underlying disease and treatment modality at the be-ginning and after 6 months of dialysis (urea plasma concentration 18.94±5.47 mmol/L and 18.99±6.11 mmol/L, serum creatinine 661.25±177.65 μmol/L and 698.85±243.30 μmol/L). Parameters of CBC (he-moglobin concentrations were 99.15±14.52 g/L and 102.95±10.90g/L respectively) and iron concentrations (10.77±5.00μmol/L and 10.30±3.68 μmol/L respectively) were adequate, while fibrinogen (5.50±1.41 g/L and 5.16±1.50 g/L respectively) and CRP concentrations (6.30±6.04 IU/L and 6.64±5.63 IU/L respectively) were above the reference range. No significant difference was found between the biochemical parameter values at baseline and at the end of the follow-up.
Residual diuresis and dialysis membrane parameters during follow-up
At the beginning of dialysis, the patients’ residual di-uresis was 867.5±426.82 mL/day and after 6 months it was 822.5±432.7 mL/day; the total weekly Kt/V was 2.198±0.403 and 2.154±0.450 respectively, and the ClCr was 70.490±13.580 L/week and 69.375±13.98 L/week, respectively, also in agreement with the sug-gested dialysis quality guidelines. The mean values of nPCR were lower than the suggested 1 g/kgTM/day at both measuring points (0.859±0.178 and 0.880±0.188 g/kgTM/day). No significant difference was observed between the values during the follow-up.
Peritoneal transport rates of glucose and creati-nine increased slightly but not significantly during the follow-up. At the beginning and after 6 months of dialysis, the PET for glucose was 0.400±0.129 and
0.365±0.199, and PETcreatinine was 0.614±0.170 and
VEGF concentrations in the serum and drained dialysate
Serum VEGF concentrations were 149.33±116.71 pg/mL at the beginning and they rose significantly (p=0.012) to 239.36±102.23 pg/mL after 6 months of PD therapy. Drained dialysate VEGF concentrations were 38.44±50.47 pg/mL at the beginning and rose insigni-ficantly to 43.55±51.15 after 6 months of PD (Table 1).
Table 1. Concentrations of serum vascular endothelial growth
factor (sVEGF) and drained dialysate (ddVEGF) at the beginning (0) and after 6 months of PD.
group mean med. Z t p
sVEGF
(pg/mL) 06 149.33±116.71 173.38239.36±102.23 224.06 0.013 -2.793 0.012 ddVEGF
(pg/mL)
0 38.44±50.47 15.60
0.560 -0.293 0.773 6 43.55±51.15 16.7
Z – Z test; med. – median; ddVEGF – drained dialysate vascular endothelial growth factor; sVEGF – serum vascular endothelial growth factor
Correlation between serum and drained dialysate VEGF and dialysis parameters
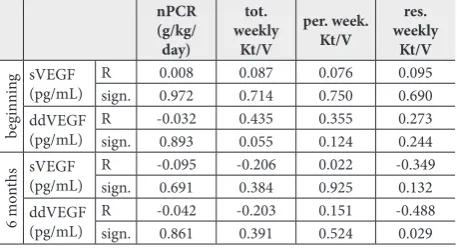
At the beginning of chronic PD no significant correlation was found between serum and ddVEGF concentra-tions and nPCR and Kt/V parameters (Table2). After 6 months of chronic PD, a significant inverse correlation was observed between ddVEGF concentrations and residual weekly Kt/V (R= -0.488, p=0.029) (Table 2), but no statistical correlation was found between the sVEGF concentration and total weekly, peritoneal weekly and residual weekly Kt/V, and between ddVEGF concen-trations and total weekly and peritoneal weekly Kt/V.
Table 2. Correlation of Kt/V and concentrations of serum
vas-cular endothelial growth factor (sVEGF) and drained dialysate (ddVEGF) at the beginning of PD and after 6 months of PD.
nPCR (g/kg/
day)
tot. weekly
Kt/V
per. week. Kt/V
res. weekly
Kt/V
beg
innin
g sVEGF
(pg/mL) Rsign. 0.0080.972 0.0870.714 0.0760.750 0.0950.690 ddVEGF
(pg/mL) Rsign. -0.0320.893 0.4350.055 0.3550.124 0.2730.244
6 m
ont
hs sVEGF(pg/mL) Rsign. -0.0950.691 -0.2060.384 0.0220.925 -0.3490.132
ddVEGF
(pg/mL) Rsign. -0.0420.861 -0.2030.391 0.1510.524 -0.4880.029
tot. – total; per. – peritoneal; res. – residual; nPCR – normalized protein catabolic rate; ddVEGF – drained dialysate vascular endothelial growth factor; sVEGF – serum vascular endothelial growth factor
At the beginning and after 6 months of chronic PD, no significant correlation was found between VEGF concentrations in the serum and drained dialysate and the ClCr parameters (Table 3).
Table 3. Correlation between creatinine clearance (ClCr) and
concentrations of serum vascular endothelial growth factor (sVEGF) and drained dialysate (ddVEGF) at the beginning and after 6 months of PD.
tot. week ClCr
(L/week/m2) per. week ClCr (L/week/m2) res. week ClCr (L/week/m2)
beg
innin
g sVEGF (pg/mL) R 0.147 -0.083 0.066
sign. 0.538 0.727 0.783
ddVEGF
(pg/mL) Rsign. 0.2140.365 0.1810.446 0.1990.401
6 m
ont
hs sVEGF (pg/mL) Rsign. -0.2540.280 -0.3740.104 0.0750.753 ddVEGF
(pg/mL) Rsign. -0.3200.169 -0.1980.403 0.3670.112
tot. week. – total weekly; per. week. – peritoneal weekly; res. week – residual weekly; ddVEGF – drained dialysate vascular endothelial growth factor; sVEGF – serum vascular endothelial growth factor; ClCr – creatinine clearance
At the beginning of chronic PD, a highly signifi-cant inverse correlation was found between ddVEGF
concentrations and PETglucose (R= -0.565, p=0.009)
(Fig. 1) and with RRF (R=-0.691, p=0.001) (Fig. 2), and was statistically significant with PETcreatinine (R= -0.506, p=0.023) (Fig. 3). Furthermore, a significant inverse correlation was found between sVEGF con-centrations and PETcreatinine (R= -0.457, p=0.043) (Fig. 4), and a highly significant inverse correlation with RD (R=-0.691, p=0.001) (Fig. 4).
After 6 months of chronic PD treatment, we ob-served the following: a significant direct correlation
between ddVEGF concentrations and PETcreatinine
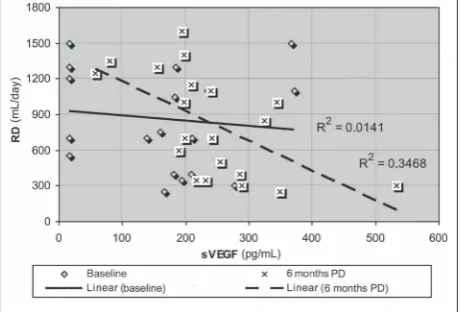
(R=0.450, p=0.047), (Fig. 3); a significant inverse correlation between ddVEGF concentrations and RRF (R=-0.552, p=0.012) (Fig. 2), and a significant inverse correlation between sVEGF concentrations and RD (R=-0.589, p=0.006), (Fig. 4).
DISCUSSION
This investigation included 20 patients on PD. Analyses were performed at the beginning and after 6 months of dialysis.
The serum VEGF concentration rose significantly while the concentration of ddVEGF rose slightly during the follow-up. These findings correspond with literature data reporting a significant increase of locally-produced VEGF in the peritoneal membrane during long-term PD with conventional solutions [12].
The molecular weight of VEGF is 35 kDa, therefore serum VEGF is readily transferred to the dialysate. Both the serum and drained dialysate VEGF concentrations are modified not only by the uremic milieu but also
Fig. 5. Correlation between RD and VEGF concentrations in the
serum at the beginning and after 6 months of PD. sVEGF – se-rum vascular endothelial growth factor; RD – residual diuresis; PD – peritoneal dialysis.
Fig. 1. Correlation between PETglucose and VEGF concentrations
in the drained dialysate at the beginning and after 6 months of PD. ddVEGF – drained dialysate vascular endothelial growth fac-tor; PET – peritoneal equilibration test; PD – peritoneal dialysis.
Fig. 2. Correlation between RRF and VEGF concentrations in the
serum at the beginning and after 6 months of PD.sVEGF – serum
vascular endothelial growth factor; RRF – residual renal function; PD – peritoneal dialysis.
Fig. 3. Correlation between PETcreatinine and VEGF concentrations
in the drained dialysate at the beginning and after 6 months of PD. ddVEGF – drained dialysate vascular endothelial growth fac-tor; PET – peritoneal equilibration test; PD – peritoneal dialysis.
Fig. 4. Correlation between PETcreatinine and VEGF concentrations
by the dialysate glucose concentration and peritonitis episodes. Therefore we opted to enroll patients treated with glucose dialysate concentrations up to 2.76% and not higher, and that were also free of peritonitis.
In the examined group of patients, the concen-trations of sVEGF did not correlate with peritoneal, residual renal and total weekly clearances of urea and creatinine, neither at the beginning nor after 6 months of PD. Still, sVEGF concentrations were significantly lower in patients with lower RRF and lower RD after 6 months of PD.
Previous studies documented significant differ-ence in sVEGF concentrations that were related to RRF levels: the mean serum concentration of VEGF in patients with RRF<2 mL/min, 41.15 pg/mL (range 21.10-82.70 pg/mL), and in patients with RRF>2 mL/ min, 27.15 pg/mL (range 18.90-36.60 pg/mL). Previ-ous studies reported a direct correlation between sVEGF concentrations and chronic inflammatory state, represented by plasma concentrations of IL-1, CRP and fibrinogen [22]. Investigators found a nega-tive correlation between RRF and the parameters of inflammation, such as hyalurone [20] and tumor ne-crosis factor (TNF)-α [14]. Serum CRP concentrations at the beginning of chronic PD were predictors of a deterioration of the RRF during a one-year follow-up [24]. It was concluded that preserved RRF contributes to better clearance of growth factors and inflamma-tory cytokines. However, high serum concentrations of growth factors and cytokines could influence RRF decline [25].
At the beginning of PD, we found a significant inverse correlation between sVEGF concentrations
and the peritoneal transport rate of creatinine, sug-gesting that the baseline sVEGF concentration was not predictive of a high creatinine transport rate at the beginning of chronic PD. After six months of PD, we found no significant correlation between serum concentrations of VEGF and the peritoneal transport rate of creatinine. The sVEGF concentration was not correlated with the peritoneal transport rate of glucose, neither at the beginning nor after 6 months of PD. Previous studies reported somewhat different results. One study, which included 40 patients on chronic PD during 3 to 56 months, found significantly higher sVEGF concentrations in high and higher-than-average transporters when compared to low and lower-than-average transporters [14]. The short follow-up period in our study could explain the lack of correlation between sVEGF concentrations and solute peritoneal transport rates in our patients.
At the beginning of chronic PD, we found a signifi-cant inverse correlation between ddVEGF concentration and residual weekly Kt/V. The ddVEGF concentrations did not correlate with the clearance of other solutes during the entire follow-up.
Similar to previous reports, we found significant inverse correlations between ddVEGF concentrations and RD and RRF at the beginning and after 6 months of PD [22]. There is little data about the correlation between ddVEGF concentrations and RRF function and residual solute clearances, but we speculate that preserved RRF also contributed to a better clearance of growth factors and inflammatory cytokines in the drained dialysate, besides contributing to the clearance of systemic factors [25].
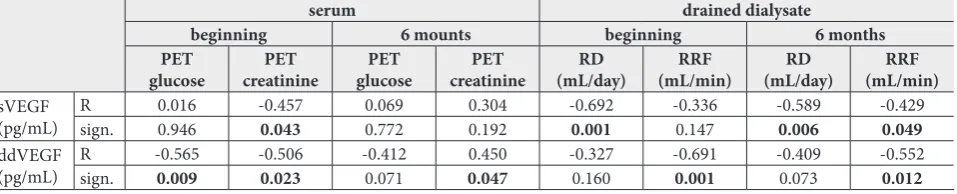
Table 4. Correlation between concentrations of serum vascular endothelial growth factor (sVEGF) and drained dialysate (ddVEGF) and
the transport properties of the peritoneum and RRF at the beginning and after 6 months of PD.
serum drained dialysate
beginning 6 mounts beginning 6 months
PET
glucose creatininePET glucosePET creatininePET (mL/day)RD (mL/min)RRF (mL/day)RD (mL/min)RRF
sVEGF
(pg/mL) Rsign. 0.0160.946 -0.4570.043 0.0690.772 0.1920.304 -0.6920.001 -0.3360.147 -0.5890.006 -0.4290.049
ddVEGF
(pg/mL) Rsign. -0.5650.009 -0.5060.023 -0.4120.071 0.0470.450 -0.3270.160 -0.6910.001 -0.4090.073 -0.5520.012
At the beginning of PD, the concentration of ddVEGF significantly inversely correlated with the transport rate of glucose. This suggests that higher ddVEGF concentrations at the beginning of PD are predictive of a higher transport rate of glucose, which represents an adverse characteristic of the peritoneal membrane, particularly at the beginning of the PD program. This correlation disappeared after 6 months of PD, probably because the concentrations of ddVEGF and transport rate depended on several different factors.
At the beginning of chronic PD, the concentration of ddVEGF significantly inversely correlated with cre-atinine peritoneal transport rate, but after 6 months of PD, the concentration of ddVEGF significantly correlated with creatinine peritoneal transport rate. Thus, higher ddVEGF concentrations are predictive of increased creatinine peritoneal transport rate in long-term PD.
The previously mentioned study of 40 patients with no signs of systemic inflammatory disease re-ported significantly higher ddVEGF concentrations in high and higher-than-average transporters when compared to the group of low and lower-than-average transporters [14]. In another study, a significant cor-relation was found between VEGF concentration and the concentration of proinflammatory cytokine IL-6 in drained dialysate, suggesting a pathogenetic link between inflammation, neoangiogenesis and a high peritoneal transport rate [23]. Further research proved the influence of genetic polymorphism on ddVEGF concentrations and changes in the peritoneal transport rate during a one-year follow-up of chronic PD [15].
A positive correlation was found between the con-centration of locally-produced VEGF in the effluent dialysate and the peritoneal transport rate of creatinine and urate, as well as the glucose absorption rate [26]. The peritoneal transport rate of creatinine and urate and the glucose absorption rate characterize the effective vascular surface area of the peritoneal membrane [9]. The hyperglycemia-induced microvascular changes in the peritoneal membrane were mostly prevented by application of monoclonal anti-VEGF antibodies, while treatment with non-specific control antibodies was not effective. These experimental findings confirmed that VEGF plays an important role in glucose-induced
neoangiogenesis and hyperpermeability of the perito-neal membrane in long-term PD [2,3,6].
VEGF was also found to be the mediator of neo-angiogenesis in diabetic retinopathy [7,11]. High concentrations of VEGF in aqueous humor have been correlated with the level of retinopathy and, by analogy, it has been speculated that the correlation between solute transport rate and the concentration of VEGF in the effluent confirms that VEGF is an important mediator of neoangiogenesis in the peritoneal mem-brane during long-term PD [7,11,13].
CONCLUSION
This prospective study of the effects of VEGF on the peritoneal membrane exposed to PD is among the few conducted in vivo on human subjects. Increased VEGF concentrations in the serum and drained dialysate were observed during the first six months of PD. Significant inverse correlations between the concentrations of VEGF in the drained dialysate and RD and RRF at PD initiation suggest an important role of preserved RRF in the clearance of growth factors. Increased concentrations of VEGF in the drained dialysate at the beginning of PD are predictive of a higher transport rate of glucose, as well as of an increased creatinine peritoneal transport rate in long-term PD, with both representing adverse characteristics of the peritoneal membrane. We believe that the presented data may be of clinical importance as they suggest predictive value of drained dialysate VEGF in identifying patients who will preserve adequate transport characteristics of peritoneal membrane and maintain successful long-term PD.
Acknowledgments: The study was supported by a research grant
from the Ministry of Education, Science and Technological De-velopment of the Republic of Serbia No. 145070.
Author contributions: Nataša Jovanović and Biljana Stojimirović
were responsible for conceiving the study and its design and for drafting the manuscript. JasnaTrbojević-Stanković and Dejan Nešić collected the literature. Nataša Jovanović and Biljana Stojimitović made critical revisions to the paper. Snežana Žunić and Žarko Laušević provided statistical expertise.
Conflicts of interest disclosure: The authors have no actual or
REFERENCES
1. Krediet RT, Struijk DG. Peritoneal changes in patients on long-term peritoneal dialysis. Nat Rev Nephrol. 2013;9:419-29.
2. Schilte MN, Celie JW, ter We PM, Beelen RHJ, van den Born J. Factors contributing to peritoneal tissue remodelling in peritoneal dialysis. Perit Dial Int. 2009;29:605-17.
3. Gao D, Zhao ZZ, Liang XH, Li Y, Cao Y, Liu ZS. Effects of peritoneal dialysis on expression of vascular endothelial growth factor, basic fibroblast growth factor and endostatin of the peritoneum in peritoneal dialysis patients. Nephrology. 2011;16:736-42.
4. Jovanović N, Žunić Božinovski S, Krstić S, Obrenović R, Trbojević-Stanković J, Stojimirović B. Vascular Endothe-lial Growth Factor in Peritoneal Dialysis Patients. Clin Lab. 2014;60:1695-701.
5. Stojimirović B, Jovanović N, Trbojević-Stanković J, Krstić S, Nešić D, Žunić-Božinovski S. Levels of vascular endothelial growth factor during first six months of peritoneal dialysis. Srp Arh Celok Lek. 2015:143(9-10):578-83.
6. Aguirre AR, Abensur H. Protective measures against ultra-filtration failure in peritoneal dialysis patients. Clinics. 2011;66(12):2151-7.
7. Pettersson A, Nagy JA, Brown LF, Sundberg C, Morgan E, Jungles S, Carter R, Krieger JE, Manseau EJ, Harvey VS, Eck-elhoefer IA, Feng D, Dvorak AM, Mulligan RC, Dvorak HF. Heterogeneity of the angiogenic response induced in different normal adult tissues by vascular permeability factor/vascular endothelial growth factor. Lab Invest. 2000;80(1):99-115. 8. Carmeliet P. VEGF as a key mediator of angiogenesis in
can-cer. Oncology. 2005;69(3):4-10.
9. Ha H, Cha MK, Choi HN, Lee HB. Effects of peritoneal dialy-sis solutions on the secretion of growth factors and extracel-lular matrix proteins by human peritoneal mesothelial cells. Perit Dial In. 2002;22:171-7.
10. Gupta N, Mansoor S, Sharma A, Sapkal A, Sheth J, Falatoon-zadeh P, Kuppermann B, Kenney M. Diabetic Retinopathy and VEGF. Open Ophthalmol J. 2013;7:4-10.
11. Heimbürger O. Peritoneal transport with icodextrin solution. Contrib Nephrol. 2006;150:97-103.
12. Zweers MM, Struijk DG, Smit W, Krediet RT. Vascular endo-thelial growth factor in peritoneal dialysis: a longitudinal follow-up. J Lab Clin Med. 2001;137:125-32.
13. Van Esch S, Zweers MM, Jansen MA, de Waart DR, van Manen JG, Krediet RT. Determinants of peritoneal solute transport rates in newly started nondiabetic peritoneal dialy-sis patients. Perit Dial Int. 2004;24:554-61.
14. Pecoits-Filho R, Araújo MR, Lindholm B, Stenvinkel P, Aben-sur H, Romão JE, Marcondes M, de Oliveira AHF, Noronha IL. Plasma and dialysate IL-6 and VEGF concentrations are associated with high peritoneal solute transport rate. Nephrol Dial Transplant. 2002;17:1480-6.
15. Szeto CC, Chow KM, Poon P, Szeto CYK, Wong TYH, Li PKT. Genetic polymorphism of VEGF: impact on
longitudi-nal change of peritoneal transport and survival of peritoneal dialysis patients. Kidney Int. 2004;65:1947-55.
16. Gotch F. What is important in dialysis? Efficiency: blood flow, KoA and Kt/V? Contrib Nephrol. 2008;161:168-77. 17. Basile C, Vernaglione L, Bellizzi V, Lomonte C, Rubino A,
D’Ambrosio N, Di Iorio B. Total body water in health and dis-ease: Have anthropometric equations any meaning? Nephrol Dial Transplant. 2008;23(6):1997-2002.
18. Ruggieri G, Rocca AR. Analysis of past and present methods of measuring and estimating body surface area and the result-ing evaluation of its doubtful suitability to universal applica-tion. Blood Purif. 2010;30(4):296-305.
19. Jovanović N, Trbojević-Stanković J, Nešić D, Obrenović R, Boričić N, Stojimirović B. Cancer antigen 125 concentration in patients on chronic peritoneal dialysis treatment – relation-ship with dialysis quality and membrane transport properties. Arch Biol Sci. 2018;70(1):13-20.
20. Szeto CC, Chow KM, Leung CB, Wong TY, Li PK. Assessment of protein nitrogen appearance in Chinese peritoneal dialysis patients-which method to use? Ren Fail. 2003;25(2):235-46. 21. Prowant BF, Moore HL, Twardowski ZJ, Khanna R. Under-standing discrepancies in peritoneal equilibration test results. Perit Dial Int. 2010;30(3):366-70.
22. Stompór T, Zdzienicka A, Motyka M, Dembińska-Kiec A, Davies SJ, Sulowicz W. Selected growth factors in peritoneal dialysis: their relationship to markers of inflammation, dialy-sis adequacy, residual renal function and peritoneal mem-brane transport. Perit Dial Int. 2002;22:670-6.
23. Cho JH, Hur IK, Kim CD, Park SH, Ryu HM, Yook JM, Choi JY, Choi HJ, Choi HJ, Park JW, Do JY, Kim YL. Impact of sys-temic and local peritoneal inflammation on peritoneal solute transport rate in new peritoneal dialysis patients: a 1-year prospective study. Nephrol Dial Transplant. 2010;25(6):1964-73.
24. Aguilera A, Sánchez-Tomero JA, Bajo MA, Ruiz-Caravaca ML, Alvarez V, del Peso G, Herranz A, Cuesta MV, Castro MJ, Selgas R. Malnutrition-inflammation syndrome is associated with endothelial dysfunction in peritoneal dialysis patients. Adv Perit Dial. 2003;19:240-5.
25. Williams JD, Craig KJ, Topley N, Williams GT. Peritoneal dialysis: Changes to the structure of the peritoneal mem-brane and potential for biocompatible solutions. Kidney Int. 2003;63(Suppl. 84):S151-61.
26. Liu J, Wu X, Liu Y, Xu Y, Huang Y, Xing C, Wang X. High-glucose-based peritoneal dialysis solution induces the upregulation of VEGF expression in human peritoneal mesothelial cells: The role of pleiotrophin. Int J Mol Med. 2013;32(5):1150-8.
Supplementary Data
Supplementary Table S1.