ISSN: 2501 - 1235 ISSN-L: 2501 - 1235 Available on-line at: www.oapub.org/edu
doi: 10.5281/zenodo.1112296 Volume 5 │ Issue 5 │ 2019
THE EVALUATION OF THE CONNECTION BETWEEN MOTOR
PERFORMANCE SKILLS AND BODY COMPOSITION OF THE GIRLS
Nurten Dinç, Mehmet Hilmi Gökmeni, Murat Taş, Burcu Kıvrak, Canberk Çiçekli
Manisa Celal Bayar University, Coaching Training Department, Manisa, Turkey
Abstract:
The Purpose: This study was done for evaluating the connection between motor
performance skills and body composition of the girls between 6-10 ages. The Method:
57 schoolgirls between 6-10 ages were included to the study. Weight, Age, Height, Body Mass Index (BMI), Free Fat Mass (FFM), Lean Muscle Mass (LMM), Body Fat Mass (BFM) and Body Fat Percentage (BFP) values were measured with (Inbody 230) branded tanita. Long jump, right hand and left hand strength, back strength, 20 meters speed test, sit & reach test, 1 minute pull-up and flamingo balance tests were applied to
the participants. Results: Pearson Correlation Test was applied for the analysis by using
SPSS 23.0 program. According to the results, the average age is (8,00±,926) years, the average height is (128,7±6,64) cm and the average weight is (28,6±6,67) kg. There is a statistically meaningful relation between long jump, right hand, left hand, back strength, flamingo balance test and BFM, FFM, LMM, BMI and BFP at the (p<0.01) level. However, there is no relation found between 20 meters speed test, sit & reach test, 1
minute pull-up test and body composition parameters. Discussion and Conclusion: At
the end of our study, we can say that there is a meaningful relation in a positive way between some motor performance skills and body composition of the girls.
Keywords: body composition, girls, balance, flexibility
│ │
1. Introduction
For last 20-30 years, physical activity levels of the children have changed dramatically. Besides, they are spending more time in indoor places over outdoor places for their physical activities. They go to the school by bus or by car instead of by foot or by bicycle. This situation leads low rates for doing exercises (Fjørtoft et al. 2011). Health problems mostly seen in elderly ages like overweighting (obesity), cardiovascular diseases, diabetes, musculoskeletal diseases cause low standard of living and many risks. On these days, these diseases are seen in teenage periods (Haslofça et al. 2011). In this context, motor performance skills can be considered as an important matter for physical suitability and motor development levels of the children. The children who have better motor performance skills are more physically active and have lower chance of being inactive in contrast to the children who have worse motor performance skills. Also, it’s a fact that in order to improve the motor performance skills of the children, activities like running, pace, agility, jumping and balance are needed to be applied (Karim et al. 2015).
Basic movement skills are observed fundamental action forms of the childhood.
Movements during sports, exercise and physical activity include physical skills like running, bouncing, jumping, balance, contort, escaping, throwing and catching (Brien et al. 2016). Gaining basic movement skills (BMS) are listed developmentally (biological, psychological, sociological, motivational, cognitive etc.). The process of gaining these skills contains active play experiences and created programs (Siahkouhian et al. 2011). As BMS sufficiencies increase, health and physical sufficiency increase. Besides, ideal body weight maintaining rate grows (Bryant et al. 2014). According to some results, BMS is related to physical activity level. Not improving these skills in childhood may affect physical activity level in adulthood (Comeau et al. 2017). For example, Henrique and his friends have made a research on 293 children. After 2 years of monitoring physical activity, they found that BMS are improved in the ratio of 21% (Henrique et al. 2016). In the guidance of these knowledgements, our study was made for evaluating motor performance skills and body composition relations of the girls.
2. Material and Method
2.1 Statistical Analysis
The data analyze was made with SPSS 23.0 program. Frequency analyze was made to find the height, weight and age averages of children. Pearson Correlation Test was applied in order to specify the relationship between their performance tests and body composition measurements.
3. Results and Discussion
Table 1: Average and Standard Deviation Values of the Participants
Variables N Average (X) ± SS
Age (years) 57 8,00±,926
Height (cm) 57 128,7±6,64
Body Weight (kg) 57 28,6±6,67
BMI (kg/m2) 57 17,1±2,73
BFP (%) 57 24,0±7,84
FFM (%) 57 21,3±3,24
BFM (kg) 57 7,32±4,03
LMM (kg) 57 10,5±1,93
Long Jump (cm) 57 122,3±14,5
Right Hand Strength (kg) 57 10,7±2,60
Left Hand Strength (kg) 57 9,73±2,30
Back Strength (kg) 57 28,7±6,20
20 meters Speed Test (sn.) 57 5,19±,623
Sit & Reach Test (cm) 57 10,6±4,63
1 min Pull-Up Test (number) 57 21,1±4,16
Flamingo Balance Test (n) 57 16,4±8,28
Average and standard deviation values of physical parameters and performance tests of the participants were given in Table 1.
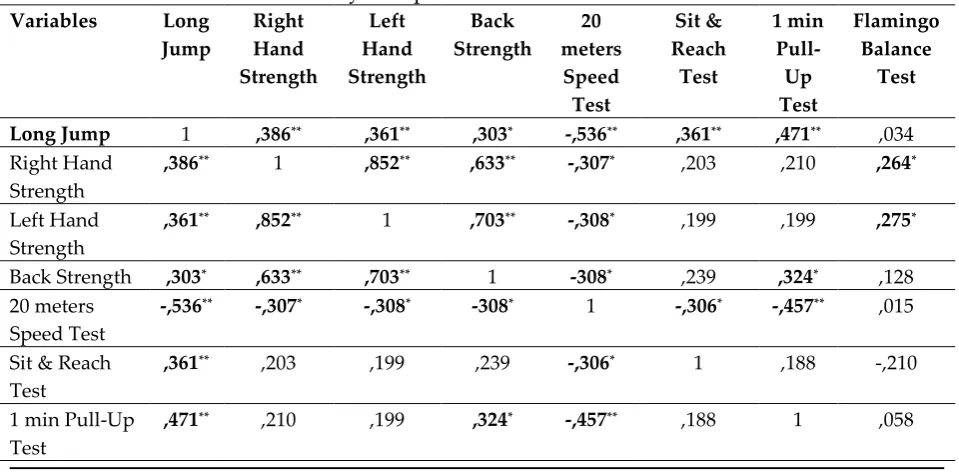
Table 2: Relation between Body Composition and Motor Performance Skills of the Girls
Variables Long
Jump Right Hand Strength Left Hand Strength Back Strength 20 meters Speed Test Sit & Reach Test 1 min Pull-Up Test Flamingo Balance Test
Long Jump 1 ,386** ,361** ,303* -,536** ,361** ,471** ,034
Right Hand Strength
,386** 1 ,852** ,633** -,307* ,203 ,210 ,264*
Left Hand Strength
,361** ,852** 1 ,703** -,308* ,199 ,199 ,275*
Back Strength ,303* ,633** ,703** 1 -308* ,239 ,324* ,128 20 meters
Speed Test
-,536** -,307* -,308* -308* 1 -,306* -,457** ,015
Sit & Reach Test
,361** ,203 ,199 ,239 -,306* 1 ,188 -,210
│ │ Flamingo
Balance Test
,034 ,264* ,275* ,128 ,015 -,210 ,058 1
BFM ,103 ,445** ,491** ,326* ,006 -,040 -,060 ,229 FFM ,312* ,690** ,750** ,557** -,160 -,101 ,073 ,369**
LMM ,325* ,685** ,749** ,561** -,161 -,095 ,081 ,373**
BMI ,095 ,444** ,510** ,325 ,035 -,003 -,074 ,260
BFP ,003 ,275** ,302* ,164 ,092 -,101 -,080 ,171
*P< 0.05; **P< 0.01
There is a meaningful difference between Long Jump Test and Right Hand Strength (r=,386; p<0.01), Left Hand Strength (r=,361; p<0.01), Back Strength (r= 303; P<0.05), 20 Meters Speed Test (r= -,536; p<0.01), Sit & Reach Test (r=,361; p<0.01), 1 Min. Pull-Up Test (r=,471; p<0.01), Free Fat Mass (FFM) (r=,312; p<0.05) and Lean Muscle Mass (LMM) (r=,325; p<0.05) levels. However, there isn’t a meaningful difference between Flamingo Balance Test, Body Fat Mass (BFM), Body Mass Index (BMI) and Body Fat Percentage (BFP).
There is a meaningful difference between Right Hand Strength and Left Hand
Strength (r=,852; p<0.01), Back Strength (r=,633; P<0.01), 20 Meters Speed Test (r= -,307; p<0.05), Flamingo Balance Test (r=,264; p<0.05), BFM (r=,445; p<0.01), FFM (r=,690; p<0.01), LMM (r=,685; p<0.01), BMI (r=,444; p<0.01) and BFP (r=,275; p<0.01) levels, while there isn’t a meaningful difference between Sit & Reach Test and 1 Min. Pull-Up Test.
A meaningful difference between girls’ Left Hand Strength and Back Strength
(r=,703; P<0.01), 20 Meters Speed Test (r= -,308; p<0.05), Flamingo Balance Test (r=,275; p<0.05), BFM (r=,491; p<0.01), FFM (r=,750; p<0.01), LMM (r=,749; p<0.01), BMI (r=,510; p<0.01) ve BFP (r=,302; p<0.05) levels but no meaningful difference is found between Sit & Reach Test and 1 Min. Pull-Up Test.
There is a meaningful difference between Back Strength and 20 Meters Speed
Test (r= -,308; p<0.05), 1 Min. Pull-Up Test (r=,324; p<0.05), BFM (r=,326; p<0.05), FFM (r=,577; p<0.01), LMM (r=,561; p<0.01) and BMI (r=,325; p<0.05) levels but there isn’t a meaningful difference between Sit & Reach Test, Flamingo Balance Test and BFP.
A meaningful difference is found between 20 Meters Speed Test and Sit & Reach
Test (r= -,306; p<0.05), 1 Min. Pull-Up Test (r= -,457; p<0.05) levels. However, there isn’t a meaningful difference between Flamingo Balance Test, BFM, FFM, LMM, BMI and BFP.
There isn’t a meaningful difference found between Sit & Reach Test and Right
Hand Strength, Left Hand Strength, Back Strength, 1 Min. Pull-Up Test, Flamingo Balance Test, BFM, FFM, LMM, BMI and BFP.
There isn’t a meaningful difference between girls’ 1 Min. Pull-Up Test and Right
A meaningful difference is observed between Flamingo Balance Test and FFM (r=,369; p<0.01) levels while there’s not a meaningful difference between Long Jump Test, Back Strength, 20 Meters Speed Test, Sit & Reach Test, 1 Min. Pull-Up Test, BFM, BMI and BFP.
According to our study, BFP average of the girls is 24,0±7,84. BFP average of the
girls is 23,4±7,7 as a result of the study that Marmeleira et al. (2017) have made about the relations between motor performance and body compositions of the children between 6-10 ages. Moreover, Ozkocak (2018) made a study on body composition of the children between 5-14 years and found that BFP average of the girls is 24,77±6,31. The results in Marmeleira and friends (2017) and Ozkocak (2018) are close to our study findings.
Our study has showed that BMI average of the girls is 17,1±2,7. According to the
study on the children between 6-10 ages, Souza et al. (2014) have found that BMI average of the girls is 16,16±1,47. Duncan et al. (2017) made a study about relationship between BMI average and basic motor skills of the children between 6-11 years and they found that BMI averages of the girls is 16,7±0,3. Santos et al. (2014) made a study about relationship between body composition and motor performance of the children between 7-10 years and they found that BMI average of the girls is 17,0±2,9. In addition, Kim et al. (2016) made a search on pre-school children in Korea and they found that BMI average of the girls is 16,3±0,62. As we made a research on other studies in the literature, the results are close to our study findings.
We found the average 20 meters Speed Test of the girls is 5,19±0,62. Román et al.
(2016) made a search on pre-school children and observed that the average 20 meters Speed Test of the girls is 6,25±1,16. Dumit et al. (2010) studied about obesity and physical suitability on the children and adolescents. They found the average 20 meters Speed Test of the girls is 4,40±0,40. Moreover, Sanchez et al. (2015) made an anlyze on pre-school children for physical suitability and the average 20 meters Speed Test of the girls is found as 5,80±0,71. Also, Roman et al. (2015) made a study about identifying physical suitability of the children between 3-6 ages and found the average 20 meters Speed Test of the girls is 6,37±1,08. Our findings are similar as other literature findings.
When we analyzed the relation between BMI and both hands strength of the
girls, there is a (p<0.01) level statistically meaningful relation. In addition to our study, the findings are similar as Montalcini et al. (2016), Souza et al. (2014), Liao (2016) and Ervin et al. (2014) results and Lad et al. (2013) study result is (P<0.05) level. However,
Omar et al. (2014) findings are opposite to our findings.
In our study, the average Sit & Reach Test of the girls is found as 16,4±,8,28.
│ │
the girls is 18,72±4,65. Urlu (2014) analyzed physical activity level of the children between 10-12 years old and found the average Sit & Reach Test of the girls that study
on 4th semester is 20,87±7,36. Casonatto et al. (2015) made a study about physical
suitability and BMI of the children and observed the average Sit & Reach Test of the girls is 29,0±8,0. Chaves et al. (2016) analyzed Peruvian children between 6-14 ages for motor improvements. They found the average Sit & Reach Test of the 10 years old girls group is 22,1±1,3. The results are similar as Mayorga et al. (2013), Chillón et al. (2011), Celik et al. (2013), Urlu (2014) and Chaves et al. (2016) studies but Casonatto et al. (2015) study findings are higher than ours so there is an opposition with our findings.
Long Jump Test average of the children is found as 122,3±14,5. Addition to our
studies, Santos et al. (2015) made a research about lower body strength of the children and they found Long Jump Test average of the girls is 127,35 ±20,3. Ranson et al. (2015) studied on school children and they found Long Jump Test average of the children is 128,97±19,29. Zaqout et al. (2016) made a study about physical suitability of the European children and observed that Long Jump Test average of the girls is 110,9±24,0. Henrique et al. (2017) analyzed motor improvement performances of the Portuguese children and found Long Jump Test average of the 9 years old girls is 104,7±38,5. Lastly, Chaves et al. (2015) analyzed motor improvements of the Portuguese children between 6-10 years and they observed Long Jump Test average of the girls is 111,60 ± 20,32. Our results are same as Zaqout et al. (2016), Henrique et al. (2017) and Chaves et al. (2015). On the other hand, results in Santos et al. (2015) and Ranson et al. (2015) examinations are higher than our findings.
4. Conclusion
In conclusion, we can say that there is a meaningful connection in positive way between motor performance skills and body composition of the girls.
About the Author(s)
Nurten Dinç is Assistant Professor, Department of Sports Health, Manisa Celal Bayar University.
Mehmet Hilmi Gökmen is Master Student Department of Sports Health, Manisa Celal Bayar University.
Murat Taş is Professor, Department of Sports Health, Manisa Celal Bayar University.
Burcu Kıvrak is Master Student Department of Sports Health, Manisa Celal Bayar University.
References
Brien W.O., Belton S., Issartel J., 2016. The relationship between adolescents’ physical activity, fundamental movement skills and weight status. Journal of Sports
Scıences. 12; 1159–1167. http://dx.doi.org/10.1080/02640414.2015.1096017.
Bryant E.S., Duncan M.J., Bırch S.L., 2014. Fundamental movement skills and weight status in British primary school children. European Journal of Sport Science 7;
730–736. https://doi.org/10.1080/17461391.2013.870232.
Casonatto J., Fernandes R.A., Batista M.A., Cyrino E.S., Silva M.J., 2015, Arruda M.D., Ronque E.R. Association between health-related physical fitness and body mass index status in children. Journal of Child Health Care 1-10.
doi: 10.1177/1367493515598645.
Chaves R., Jones A.B., Gomes T., Souza M, Pereira S, Maia J, 2015. Effects of ındividual and school-level characteristics on a child’s gross motor coordination development. International Journal of Environmental Research and Public Health. 12; 8883-8896. doi:10.3390/ijerph120808883.
Chaves R.N.D., Valdıvia A.B., Nevill A., Freitas D., Tani G., Katzmarzyk P.T., Maia J.A.R., 2016. Developmental and physical-fitness associations with gross motor coordination problems in Peruvian children. Research in Developmental
Disabilities. 54; 107- 114. http://dx.doi.org/10.1016/j.ridd.2016.01.003.
Chillón P., Ortega F.B., Ferrando J.A., Casajus J.A., 2011. Physical fitness in rural and urban children and adolescents from Spain. Journal of Science and Medicine in Sport 14; 417-423. doi:10.1016/j.jsams.2011.04.004.
Comeau M.E., Bouchar, D.R., Levesque C., Johnson M.J., Rioux B.V., Mayo A., Sénéchal M., 2017. Association between functional movements skills and health ındicators in children aged between 9 and 12 years old. Int. J. Environ. Res. Public Health 14, 1-15. doi:10.3390/ijerph14091010.
Çelik A., Günay E., Aksu F., 2013. The evaluation of physical and motoric features of the elementary students between 7-9 age group. Dokuz Eylul University Medical Faculty Journal. 27(1), 7-13.
Dumith S.C., Ramires V.V., Souza M.A., Moraes D.S., Petry F.G., Oliveira E.S., Ramires S.V., Hallal P.C., 2010. Overweight/obesity and physical fitness among children and adolescents. Journal of Physical Activity and Health 7, 641-648.
Duncan M.J., Braynt E., Stodden D., 2017. Low fundamental movement skill proficiency is associated with high bmı and body fatness in girls but not boys aged 6–11
years old. Journal of Sports Scıences 21, 2135–2141.
http://dx.doi.org/10.1080/02640414.2016.1258483.
Evrin R.B., Fryar C.D., Wang C.Y., Miller I.V., Ogden C.L., 2014. Strength and body weight in us children and adolescents. Pediatrics 3, 1-19.
│ │
Fjørtoft I., Pedersen A.V., Sigmundsson H., Vereijken B., 2011. Measuring physical fitness in children who are 5 to 12 years old with a test battery that ıs functional and easy to administer. American Physical Therapy Association 91, 1087–1095. Haslofça E., Haslofça F., Kutlay E., 2011. The Relations Between Physical Suitability
Parameters on The Children Between 9-10 Ages. Sports Medicine Journal 46, 67-76.
Henrique R.S., Bustamante A.V., Freitas D.L., Tani G., Katzmarzyk P.T., Maia J.A., 2017. Tracking of gross motor coordination in Portuguese children. Journal of Sports
Sciences 1-9. http://dx.doi.org/10.1080/02640414.2017.1297534.
Henrique R.S., Re A.H.N., Stodden D.F., Fransen J.F., Campos C.M.C., Queiroz D.R., Cattuzzo M.T., 2016. Association between sports participation, motor competence and weight status: a longitudinal study. Journal of Science and
Medicine in Sport 19, 825–829. http://dx.doi.org/10.1016/j.jsams.2015.12.512.
Karim O.A., Ammar, A., Chtourou H., Wagner M., Schlenker L., Parish A., Gaber T., Hökelmann A., Bös K., 2015. A comparative study of physical fitness among Egyptian and German children aged between 6 and 10 years. Advances in
Physical Education 5, 7-17. http://dx.doi.org/10.4236/ape.2015.51002.
Kim C.I., Lee K.Y., 2016. The relationship between fundamental movement skills and body mass index in Korean preschool children. European Early Childhood
Education Research Journal 6, 928–935.
http://dx.doi.org/10.1080/1350293X.2016.1239326.
Lad U.P., Satyanarayana P., Lad S.S., Sırı C.H.C., Kumarı, N.R., 2013. A study on the correlation between the body mass ındex (BMI), the body fat percentage, the handgrip strength and the handgrip endurance in underweight, normal weight and overweight adolescents. Journal of Clinical and Diagnostic Research 7(1), 51-54. DOI: 10.7860/JCDR/2012/5026.2668.
Liao H.K., 2016. Hand grip strength in low, medium, and high body mass ındex males and females. Middle East J Rehabil Health 1, 1-7. doi: 10.17795/mejrh-33860. Marmeleira J., Veiga G., Cansado H., Raimundo A., 2017. Relationship between motor
proficiency and body composition in 6- to 10-year-old children. Journal of Paediatrics and Child Health 7, 1-6. doi:10.1111/jpc.13446.
Mayorga D.V., Merino R.M., Garcia J.C.R., 2013. Valıdıty of sıt-and-reach wıth plantar flexıon test ın chıldren aged 10-12 years. International Journal of Medicine and Science of Physical Activity and Sport 15(59), 577-591.
Montalcini T., Ferro Y., Salvati M.A., Romeo S., Miniero R., Pujia A., 2016. Gender difference in handgrip strength of Italian children aged 9 to 10 years. Italian Journal of Pediatrics 16, 1-6. doi 10.1186/s13052-016-0226-y.
Omar M.T., Alghadir A., Baker S.A., 2014. Norms for hand grip strength in children aged 6–12 years in Saudi Arabia. Developmental Neuro Rehabılıtation 1-6.
Özkoçak, V., 2018. Body composition of the children between 5-14 age group. Turkish
Studies Social Sciences 13(10), 875-885. http://dx.doi.org/10.7827.
Ranson R., Stratton G., Taylor S.R., 2015. Digit ratio (2D:4D) and physical fitness (eurofit test battery) in school children. Early Human Development 91, 327–331.
http://dx.doi.org/10.1016/j.earlhumdev.2015.03.005.
Román P.A., Castillo R.M., Zurita M.L., Sánchez J.S., Pinillos F.G., López D.M., 2016. Physical fitness in preschool children: association with sex, age and weight status. Child Care Health and Development 1-7. DOI:10.3305/nh.2015.32.4.9486. Sánchez C.C., Artero E.G., Concha F., Leyton B., Kain J., 2015. Anthropometric
characteristics and physical fitness level in relation to body weight status in Chilean preschool children. Nutr Hosp 1, 346-353. doi:10.3305/nh.2015.32.1.9092. Santos J.R., Ruız J.R., Cohen D.D., Montesınos J.L., Pınero J.C., 2015. Relıabılıty and
valıdıty of tests to assess lower-body muscular power ın chıldren. Journal of Strength and Conditioning Research 8, 2277–2285.
Santos M.A.M.D., Almeıda M.B.D., Castro R.M.D., Katzmarzyk P.T., Maıa J.A.R., Leandro C.G., 2014. Birthweight, body composition, and motor performance in 7- to 10-year-old children. Developmental Medıcıne & Chıld Neurology 470-475. doi: 10.1111/dmcn.12664.
Siahkouhian M., Mahmoodi H., Salehi M., 2011. Relationship between fundamental movement skills and body mass ındex in 7-to-8 year-old children. World Applied Sciences Journal 9, 1354-1360.
Souza M.A., Baptista C.R., Benedicto M.M., Pizzato T.M., Sverzut A.C., 2014. Normative data for hand grip strength in healthy children measured with abulb
dynamometer: a cross-sectional study. Society of Physiotherapy 1-6.
http://dx.doi.org/10.1016/j.physio.2013.11.004.
Souza M.C.D., Chaves R.N.D., Lopes V.P., Malina R.M., Garganta R., Seabra A., Maia J., 2014. Motor coordination, activity, and fitness at 6 years of age relative to activity and fitness at 10 years of age. Journal of Physical Activity and Health 11,
1239-1247. http://dx.doi.org/10.1123/jpah.2012-0137.
Urlu, Y., 2014. Analyzing physical activity levels of the children between 10-12 age group (Antalya example). PhD Thesis, University of Balıkesir.
Zaqout M., Vyncke K., Moreno L.A., Etayo P.D., Lauria F., Molnar D., Lissner L., Hunsberger M., Veidebaum T., Tornaritis M., Reisch L.A., Bammann K.A., Sprengeler O., Ahrens W., Michels N., 2016. Determinant factors of physical fitness in European children. Int J Public Health 1-10. doi 10.1007/s00038-016-0811-2.
│ │
Creative Commons licensing terms