*Correspondence to Author:
Dr. Shaheen Sultana
Taif University, Saudi Arabia Phone no: +966544122485
How to cite this article:
Venu Manukonda, Shaheen Sulta-na, Amit Singh, Maria Khan, Mo-hammad Yusuf, Ibrahim Abdullah Maghrabi. Development and
Valida-tion of Rp-hplc Method for Analysis of Raloxifene in Pharmaceutical Dosage Forms. Journal of Pharma-ceutical Research and Reviews, 2018; 2:7.
eSciPub LLC, Houston, TX USA. Website: http://escipub.com/
Venu Manukonda et al., JPRR, 2018; 2:7
Journal of Pharmaceutical Research and Reviews
(ISS
N
:2
5
7
6
-8
4
17)
Research Article JPRR (2018) 2:7
Development and Validation of Rp-hplc Method for Analysis of
Raloxifene in Pharmaceutical Dosage Forms
The aim of present work was to develop and validate a simple, fast and reliable isocratic HPLC method for determination of raloxifene hydrochloride in pharmaceutical dosage form. Chromatographic Separation was achieved by using Agilent technologies model G4288A. Gradient HPLC-1120 , Compact low pressure binary Gradient Pump Consisting Of vacuum in built degasser unit non-PDA UV-vis detector equipped with a manual injection system with 50 uL loop and the eluted analytes for drug was traced by UV detection at 287nm. The method was found to be linear over a wide concentration range (0.1-20 µg/mL) with a correlation coefficient (r) of 0.9995. The LOD and LOQ were 21 and 63 ng/mL for RLX. These results indicate that method is sensitive enough for therapeutic assay. The % RSD values for three selected concentrations were found to be 0.14, 0.51 and 0.75% revealed the high system accuracy. The relative standard deviations (RSD) obtained at three concentrations (n = 6) in the range of 8-10 µg/mL was 0.016-0.018 % for the intraday assay and 0.016-0.024% for interday assay revealed good precision. The specificity was demonstrated that drugs were free of interference from potential impurities. % RSD, theoretical plates
and Rmin were not significantly affected when the experimental
parameters (such as flow rate, gradient program) were altered and thus concluded that the method was robust.
Keywords: Raloxifene; HPLC, linearity, robustness
Venu Manukonda1, Shaheen Sultana2*, Amit Singh3, Maria Khan2, Mohammad Yusuf2,
Ibrahim Abdullah Maghrabi2
1RV Northland Institute;2Taif University, Saudi Arabia;3RV Northland Institute
ABSTRACT
1. INTRODUCTION
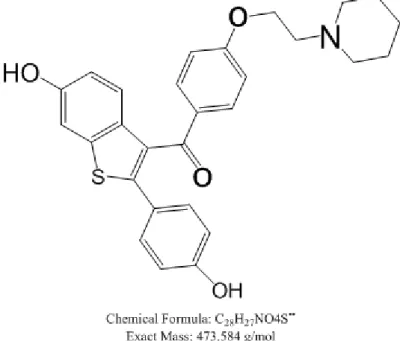
Raloxifene Hydrochloride belongs to the Benzo Thiophene class Of compound used for the treatment and prevention of postmenopausal
disorder inwomen (1). Raloxifene
hydrochloride is Chemically Termed as Methanone [6 – Hydroxy -2 – (4 – hydroxyl Phenyl0benzo(B) Thien – 3 –yl)] – [4 – [ 2 – 1 – Piperidinyl ) ethoxy] Phenyl ]Hydrochloride
Figure 1) . Raloxifene Hydrochloride was approved by Food and Drug Administration (FDA) In 1997 (2).
A High-Performance liquid chromatographic (HPLC) is a Recent Technique in the liqid Chromatography which enables significant reduction in separation time and solvent consumption. Analytical methods described in literature for determination of raloxifene hydrochloride in biological and other matrices mostly involve sepectrophotometery analysis (3,4). UV spectrophotometric methods are less sensitive, accurate and time consuming. Some Sensitive and accurate methods have already have been reported for estimation of rlx such as LC‐ MS‐MS (5,6)
and Capillary electrophoresis (7) but they are expensive and time consuming as lot of sample preparation and processing steps.
HPLC methods also reported for the
determination of RLX either for pharmaceutical dosage forms or biological fluids. All these HPLC methods require use of buffer solutions as mobile phase in isocractic or gradient way (8). The aim of present work was to develop and validate a simple, fast and reliable isocratic HPLC method for determination of raloxifene hydrochloride in pharmaceutical dosage form.
2. Chemicals and Reagents
Pharmaceutical Grade Raloxifene
Hydrochloride certified to be 99.8 % pure
according to manufactured recommend
spectrophotometry method was generous gifted from Ranbaxy research labs, gurgaon, India. HPLC Grade acetonitrile and Water (HPLC)
were purchased from fisher scientific Ltd Mumbai and Rankem RFCL India respectably. The formic acid Ar Grade was provided by Ranbaxy research labs Gurgaon India . Di hydrogen sodium phosphate and sodium hydroxide was purchased from Merck, India. Nylon membrane filter (47 mm, 0.22um porosity) were purchased from Pali corporation, Mumbai, India. The other Chemicals used were of analytical Grade.
3. Instrumenation and analytical Conditions
Chromatographic Separation was achieved by using a Agilent technologies model G4288A. Gradient HPLC-1120 , Compact low pressure binary Gradient Pump Consisting Of vacuum in built degasser unit non-PDA UV-vis detector equipped with a manual injection system with 50 ul loop and the eluted analytes for drug was traced by UV detection at 287nm . The mobile phase consisting of HPLC water (pH 3.2 Adjusted with Formic Acid AR Grade ) and Acetonitrile (HPLC) Grade Degassed for 5min in a bath sonicator. The mobile phase was pumped from the solvent reservoir in the ratio of (40 : 60) was pumped into column at a flow Rate 2.0 ml/min and the run time was 6 min. Prior to injection of the drug solution the column was equilibrated for at least 30 min with the mobile phase following through the system.
4. Preparation of working standard solution of Raloxifene
a. Calibration curve and quality control standards
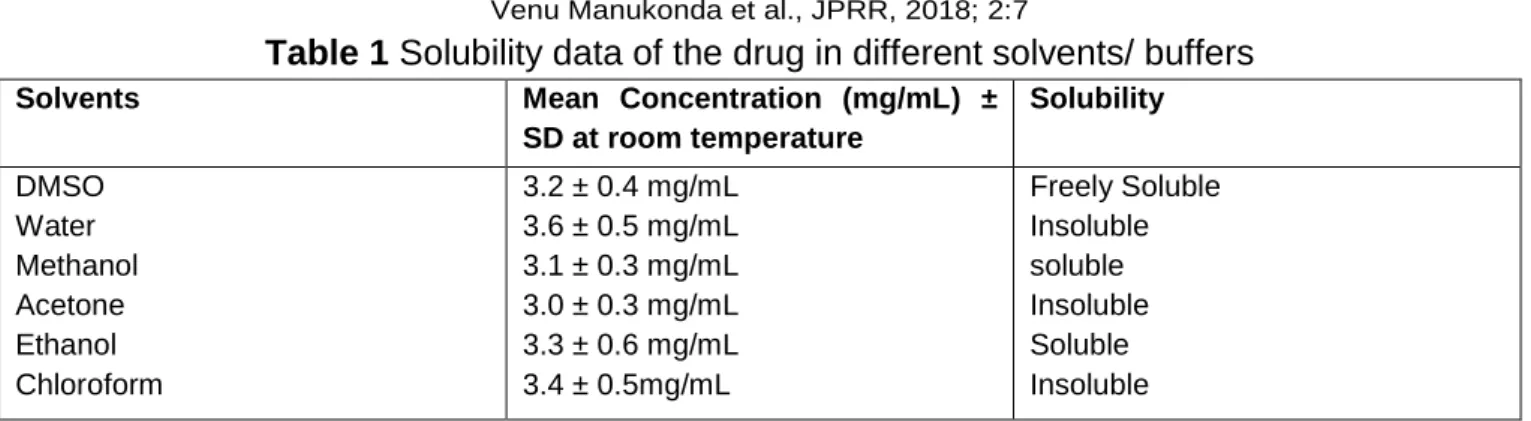
Table 1 Solubility data of the drug in different solvents/ buffers
Solvents Mean Concentration (mg/mL) ±
SDat room temperature
Solubility
DMSO Water Methanol Acetone Ethanol Chloroform
3.2 ± 0.4 mg/mL 3.6 ± 0.5 mg/mL 3.1 ± 0.3 mg/mL 3.0 ± 0.3 mg/mL 3.3 ± 0.6 mg/mL 3.4 ± 0.5mg/mL
Freely Soluble Insoluble soluble Insoluble Soluble Insoluble
Table 2 Characterization of the linear regression analysis of standard RLX
Parameters Results
Linearity
Regression equation Mean slope ± SD** Intercept ± SD Standard error of line Standard error of slope Standard error of estimate Correlation coefficient
0.1 – 20 µg/mL
y= 44246 x + 915.5 44246 ± 123.3 915.5 ± 84.3 0.0064
1.0003 1949.9858 0.9990
* Average from three calibration plots (i.e. n=3) ** Standard deviation
Table 3 Accuracy for determination of RLX
Sample (µg/mL) % RSD (n=3) Results Mean recovery (%)
2 (80 %) 4 (100 %) 6 (120 %)
0.75 0.51 0.14
96.75 % 97.00 % 98.00 %
*Average from three determinations (n=3) RSD, relative standard deviation
Table 4 Summarizes within-day and between-day precision data.
Sample Added Final Intra-day measured Inter-day measured conc. drug drug assay assay
(µg/mL) conc. conc. (µg/mL) (µg/mL)
Mean Conc ±
µg/mL
% Conc. % RSD Mean
conc ± µg/mL.
% Conc. % RSD
5
5
5
3
4
5
8
9
10
8.98 ± 0.04
9.98 ± 0.01
9.99 ± 0.01
99.28 %
99.75 %
99.88 %
0.018
0.016
0.016
8.97 ± 0.05
9.97 ± 0.01
9.97 ± 0.01
99.00 %
99.62 %
99.66 %
0.024
0.016
0.018
calibration curves were constructed by plotting peak area ratios of corresponding analytes to the internal standard against their theoretical concentrations which were fitted by a least squares linear regression to the equation: response ratio (y) = slope (m) × concentration (x) + intercept (c). Unknown concentrations of analytes were determined with reference to the calibration equation (9).
b. Method validation
Method was validated according to ICH Harmonized Tripartite, Validation of Analytical procedures and various parameters such as precision, accuracy, specificity, limit of detection, limit of quantitation, linearity and range, suitability and robustness were calculated (10).
Linearity
Linearity was assessed by making different concentrations of sample solutions (0.1 to 20 µg/mL) and assayed. 50 µl of each solution was injected into the HPLC system and the peak area of the chromatogram obtained was noted. Before the injection, the column was equilibrating for at least 20 min with mobile phase. Each concentration was analyzed in triplicate and curves were constructed using peak area ratio of drug to the internal standard versus nominal concentrations of the analytes. Least square linear regression analysis of the data gave slope, intercept, and correlation coefficient or coefficient of determination.
Sensitivity
Sensitivity of the method has been tested by examining limit of detection (LOD), the lowest concentration of an analyte in a sample that can be detected but not necessarily quantified, and the limit of quantitation (LOQ), the lowest concentration of analyte in a sample that can be determined with acceptable precision and accuracy under the stated operational conditions of the method. The calculation method is based on the standard deviation of the response (Sb) and the slope of the calibration curve (a). The limit of detection was
calculated from calibration graph by the formula: LOD = 3·Sxy/a, and the limit of quantification: LOQ = 10·Sb/a.
Accuracy
Aliquots of 10 µL of the selected assay solutions at three concentration levels (80, 100, 120) were injected into the HPLC system, and triplicate measurements were recorded for each concentration. The nominal contents of the drug in each solution were calculated from the linear regression equations. The results were expressed as percent recoveries of the particular components in the samples as [mean found concentration/theoretical concentration] × 100.
Precision
The precision of the assay was determined by repeatability (intra-day) and intermediate precision (inter-day). The intra-day precision was calculated as the relative standard deviation (RSD) of results from ten standard samples, during the same day, and the inter-day precision was studied by comparing the assays on two different days. Six sample solutions of different concentration (8-10 µg/mL) were prepared and assayed, and the standard deviation (SD) and RSD were calculated.
Specificity
The specificity is the ability to measure accurately and specifically the analyte of interest in the presence of other components that may be expected to be present in the sample matrices. It was demonstrated that analytes were free of interference from degradation products or excipients in pharmaceutical formulations ensuring that peak response in the same retention times is due to examined components only.
Robustness
Table 5 System suitability parameters
Parameters Results
System precision (% RSD) 0.54 Retention time (min.) 4.37±0.61 Peak width (min) 1.41±0.24 Peak width (USP) 0.22 ± 0.04 Asymmetry /Tailing factor 0.44 ± 0.02 Capacity factor 0.20 ± 0.002 Plates/meter (USP) 3503.96 ± 124.21
*Average from three determinations (n=3) SD,
Standard deviation; RSD, relative standard deviation
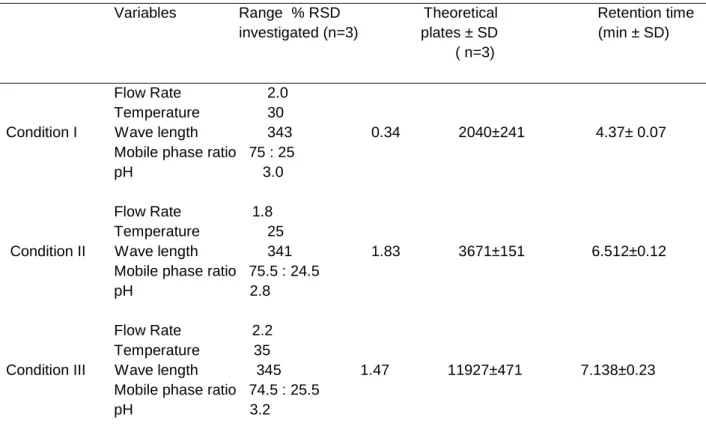
Table 6 Chromatographic conditions and range investigated during robustness testing
Variables Range % RSD Theoretical Retention time investigated (n=3) plates ± SD (min ± SD) ( n=3)
Flow Rate 2.0 Temperature 30
Condition I Wave length 343 0.34 2040±241 4.37± 0.07 Mobile phase ratio 75 : 25
pH 3.0
Flow Rate 1.8 Temperature 25
Condition II Wave length 341 1.83 3671±151 6.512±0.12 Mobile phase ratio 75.5 : 24.5
pH 2.8
Flow Rate 2.2 Temperature 35
Condition III Wave length 345 1.47 11927±471 7.138±0.23 Mobile phase ratio 74.5 : 25.5
pH 3.2
*Average from three determinations (n=3)
evaluated by varying method parameters set for optimum conditions such as flow rate, gradient program, concentration of buffer, and determining the effect (if any) on the results of the method.
Result and discussion Solubility studies
Solubility studies were conducted in different solvents and the results are shown in Table 1. The drug is found to be freely soluble in DMSO and methanol which matches the existing reference.
Linearity
The analytical curve for RLX was constructed by plotting the area under the curve (AUC) of the main peak versus drug concentration. It was found to be linear over a wide concentration range (0.1-20 µg/mL) with a correlation coefficient (r) of 0.9995. The straight line equation obtained from the experimental results was found to be (Equation 1):
y = 44246x + 915.5 (1)
There was no significant difference between the slopes of calibration plots prepared on different days (ANOVA, P > 0.05).
Sensitivity
The LOD and LOQ were 21 and 63 ng/mL for RLX. These results indicate that method is sensitive enough for therapeutic assay.
Accuracy
Accuracy is one of the most important parameters of an analytical methodology and it can be expressed as the percent recovery of known amounts of drug added to a sample. The accuracy of the analytical method was
evaluated in terms of repeatability.
Repeatability (intra-day precision) was assessed by injecting the six replicate injections of 2-6 µg/mL drug concentration (Table 3). The % RSD values for three concentrations were
found to be 0.14, 0.51 and 0.75% . The value of Relative standard deviation (% RSD) revealed the high system accuracy. The mean (n=3) percentage recovery of standard drug at 80%, 100%, and 120% of specific concentration were found to be satisfactorily high.
Precision
The precision refers to the variability of the results in repeated analyses of the sample under identical experimental conditions. The method was validated by evaluating the intra- and inter-day precision. The precision was
calculated from an average of ten
determinations of a homogeneous sample. The relative standard deviations (RSD) obtained at three concentrations (n = 6) in the range of 8-10 µg/mL was 0.016-0.018 % for the intraday assay and 0.016-0.024% for interday assay. High recovery percentage (> 99 %) indicates that the method presents a good precision (Table 4).
Specificity
The specificity was demonstrated showing that drugs were free of interference from potential impurities and degradation products as absence of any peak in the same retention times (Figure 2). Results indicate the high specificity of the method and can be used in a stability assay and routine analysis of the both investigated drugs. The average retention time for RLX was found to be 4.37 min (Table 5).
Robustness
Figure 1: Structure of Raloxifene Hydrochloride (Molecular Formula C28H27NO4S.HCL)
Figure 2. Chromatogram of raloxifene showing sharp peak at 4.353 min.
chromatograms which demonstrated that the RP-HPLC method was robust (Figure 3).
Conclusion
The method described enables the simple and fast assessment of RLX. The validation data demonstrate good precision and accuracy, which prove the reliability of the proposed
method. Hence, this RP-HPLC method can be used routinely for estimation of RLX. This study demonstrates the applicability of the proposed method for the potency determination of RLX in bulk drug and pharmaceutical formulations. The method can be successfully used for routine quality control and stability assays and offers advantages in speed, simplicity, and reliability
References
1. Pavan kumar Bathini, Venkata Ramana Kandula, Prashanth Reddy Gaddameedhi (2009). An improved synthesis of raloxifene hydrochoride: a selective estrogen receptor modulator. Coden HLEEAI, 2014; 4(4): 515-518.
2. Enrico M Messalli, Cono Scaffa. Long-term safety and efficacy of raloxifene in the prevention and treatment of postmenopausal osteoporosis: an update. International Journal of Womens Health, 2009; 1: 11–20.
3. Buridi Kalyanaramu, K. Raghubabu. Determination of Raloxifene Hydrochloride By Oxidative Coupling Reaction In Pharmaceutical Formulations. International Journal of Applied Pharmaceutics, 2011; 3(2): 69.
4. Nagaraju PT, K Venu Gopal, Murali Krishna NV, Bhargavi V, Srinivasulu N. UV - Spectrophotometric Method Development and Validation for Determination of Raloxifene in Pharmaceutical Dosage Form. Research & Reviews: Journal of Pharmaceutical Analysis, 2014; 3(4): 27-31.
5. Jurji Trontelj, Marija Bogataj, Janja Marc, Ales Mrhr. Development and
validation of a LC‐MS‐MS assay for determination of ralo xifene and its metabolites in human plasma. Journal of Chromatography. B, Analytical Technologies in the Biomedical and Life Sciences, 2007; 855(2): 220‐227.
6. Basavaiah Kanakapura, Anil Kumar UR, Tharpa K, Vinay KB. Determination of raloxifene in human urine by LC‐MS‐MS. Chemical Industry & Chemical Engineering Quarterly, 2009; 15(3): 119‐123.
7. Pérez-Ruiz T, Martínez-Lozano C, Sanz A, Bravo E. Development and validation of a quantitative assay for raloxifene by capillary electrophoresis. J Pharm Biomed Anal. 2004 Mar 10;34(5):891-7.
7. D Suneetha, A. Lakshmana Rao. A New Validated Rp-Hplc Method For The Estimation Of Raloxifene In Pure And Tablet Dosage Form. Rasayan Journal of chemistry, 2010; 3(1): 117-121.
8. Mohammad Nasir Uddin, Suman Das, Shakhawat Hasan Khan, Swapon Kumar Shill, Habibur Rahman Bhuiyan, Rezaul Karim. Simultaneous determination of amoxicillin and chloramphenicol and their drug interaction study by the validated UPLC method. Journal Taibah University of Science, 2016; 10: 755–765.