VOLUME 18 ISSUE 3 (2020), Page 190 – 201
SPATIAL PATTERN OF RESIDENTIAL BURGLARY. THE
CASE STUDY: KUCHING, SARAWAK
Norita Jubit1, Tarmiji Masron2, Azizan Marzuki3
1,2 Centre for Spatially Integrated Digital Humanities (CSIDH), Faculty of Social Science and Humanities
UNIVERSITI MALAYSIA SARAWAK
3School of Housing, Building & Planning,
UNIVERSITI SAINS MALAYSIA
Abstract
Residents in Malaysia are mostly concentrated in urban areas. However, people do feel worried about residential burglary despite living in urban areas. Although burglary cases have recorded a decline, the fears of crime are still high among the people in Kuching, Sarawak. The objective of this study is to identify the spatial pattern of residential burglary in Kuching, Sarawak. This study is using Global
Moran’s I method as it can evaluate the spatial autocorrelation of residential
burglary in the global context. The spatial data consists of Kuching district boundary, road data, police station boundary and police sector boundary, while non-spatial data includes residential burglary from 2015-2017, time, addresses of the crime occurrences, latitude and longitude. The result revealed that the strong global spatial patterns were found for residential burglary in Kuching, Sarawak between 2015 and 2017. However, there was no global spatial pattern found for residential burglary in 2016.
INTRODUCTION
One of the most worrying issues around the world is increasing crime rate. At the world level, burglary was reported highest in Oceania which is 84% followed by Europe 72% while America recorded 59%, Africa 55%, and the lowest burglary levels are found in Asia with 40% (UNHABITAT, 2007). A residential area is one of the most targeted areas by offenders for criminal activities such as theft, robbery, burglary day and night. This situation increases the fear of crime among the people especially those living in urban areas. Today, in Malaysia, crime cases in residential areas have created a fear of crime among society (Mohammad Abdul & Aishath, 2008). Based on previous studies related to the Safe City in
Malaysia, most researchers focused on the people’s perceptions about the
effectiveness and expert views on the safe city using SPSS, hence the effectiveness of the safe city was also measured based on crime statistics or trends without emphasizing spatial elements (Ainur dan Jalaludin, 2010; Mohd Fareed and Mohd Yusof, 2013; Rohana, 2013).
Therefore, to understand the phenomenon of crime in spaces, spatial information technology such as the Geographical Information System (GIS) has been adopted in the Safe City programme to identify the spatial pattern of crime (Department of Town and Country Planning, 2019). GIS can also integrate the extensive amount of spatial and non-spatial data (Tarmiji Masron et.al, 2015). According to property crime trends in 2015-2017, statistics show burglary cases in Kuching, contributed 848 cases or 20.2% during that period (Crime Investigation Department of Kuching, 2018). Thus, what is the spatial pattern of residential burglary in Kuching, Sarawak? This study can reveal the spatial pattern of residential burglary in Kuching, Sarawak by using GIS as the system has the ability in handling spatial data in a geographical environment. GIS is considered as one of the approaches for decision-making and problem solving as well as in urban planning (Tarmiji Masron and Ruslan, 2004; Thangavelu et.al, 2013; Patel et.al, 2014).
LITERATURE REVIEW
Kouziokas, (2017) has conducted a criminal investigation by using GIS to identify high crime concentration in urban areas and assess the level of urban security. Hot spot analysis has been used for detecting areas with a high risk of crime. Rasul and Ibrahim, (2016) has identified the pattern of burglary as a measure to reduce the burglary in South Yorkshire by using GIS. The result of
Global Moran’s I show that the distribution of burglary is clustered. Kernel
Near Repeat Matrix to identify high-risk areas of burglary for the period of 1 January 2013 until December 30, 2013. The results showed that the near-repeat
phenomenon’s contributions of hot spots. The burglary hotspot area is constantly changing in space and time. Chen et.al, (2013) examined space-time analysis of burglary in Beijing by using Nearest Neighbor Index (NNI) and Kernel Density Estimation. The results of the study showed the spatial pattern of burglary was influenced by urbanization. The hot spot of burglary was detected in the Eastern region and decreasing to the western part. This is because the Eastern area is close to the central business district of Beijing city.
Mohd Norarshad and Tarmiji Masron, (2016) have identified drug hot spot in the Northeast District in Penang, Malaysia by using Getis Ord Gi*. In 2013, 7 sectors were detected as hot spot areas including the police station of Jelutong, Jalan Pantai, Kampung Baru dan Lebuh Pantai while in 2014, 3 sectors were classified as hot spots such as Lebuh Pantai and Kampung Baru. Drug abuse cases were recorded higher in the densely populated city area. Norita Jubit et.al, (2019) have identified the hot spots of property crime in Kuching, Sarawak by using Getis Ord Gi*. There were two categories of data in this study which include non-spatial data (property crime cases from 2015-2017, address of incidents) and spatial data (map of Kuching, Sarawak, road data, police station boundary, and police station sectors boundary). This study also revealed that hot spots of property crime do exist in certain police station sector boundaries especially concentrated in the central business district and high-density population area. Tarmiji Masron et. al, (2020) found that GIS can also examine the spatial distribution of university students and Covid-19 pandemic.
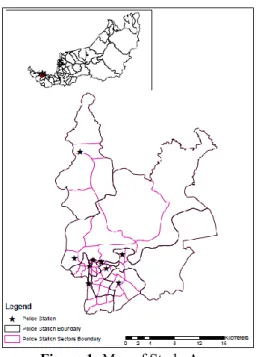
METHODOLOGY AND STUDY AREA
Figure 1: Map of Study Area
ANALYSIS OF SPATIAL PATTERN
The method used to identify the spatial pattern of residential burglary in Kuching
Sarawak is Global Moran’s I. Global Moran’s I is used for this study as it can
evaluate spatial patterns of urban burglary in the global context. Three indicators were used to determine the residential burglary patterns namely Moran Index value, z-score value, and the p-value. Positive spatial autocorrelation occurs when Moran's I is closed to +1. This means the values cluster together and have similar elevation values close to each other, while the unrelated values, will create scattered patterns of negative spatial autocorrelation (Lederer, 2012). For random patterns, there is no resulting pattern that shows no spatial autocorrelation
(Abdulhafedh, 2017). For the Global Moran’s I statistics, the null hypothesis
states that the attribute being analyzed is randomly distributed among the features in the study area (ESRI, 2019).
RESULT AND DISCUSSION
Figure 2: Spatial Distribution of Residential Burglary Cases in 2015-2017 at Kuching, Sarawak
found that Gita had recorded the highest burglary cases within three years (2015-2017).
Figure 3: Result of Global Moran’s I Analysis for Residential Burglary of Kuching, Sarawak in 2015
The result of Global Moran’s I for residential burglary in 2015 shown in Figure
Figure 4: Result of Global Moran’s I Analysis for Residential Burglary of Kuching, Sarawak in 2016
The result of Global Moran’s I for residential burglary in 2016 shown in Figure
Figure 5: Result of Global Moran’s I Analysis for Residential Burglary of Kuching, Sarawak in 2017
The burglary cases in Kuching showed a strong positive spatial autocorrelation
in 2017 as shown in Figure 5. Global Moran’s I analysis showed that the Moran
index was 0.054370 with a z-score of 2.897162 greater than 2.58 with the p-value of 0.003766 indicating a case was clustered. This result showed that the burglary cases in 2017 were concentrated in several sectors. The null hypothesis is rejected as the case of a residential burglary does not occur at random.
DISCUSSION
exists in residential areas (Groff & Vigne, 2001; Sanders et.al, 2016). Crime opportunities refer to individual routines and lifestyle activities that either enhance or reduce the risk of burglary cases (Kuo, 2015). Burglary is one of the property crimes that are often associated with the design of physical environments. (UNHABITAT, 2007). According to Cohen and Felson, (1979) three important elements influence crime, are namely (i) suitable target, (ii) motivated offenders, and (iii) the absence of capable guardians to prevent crime (Ratcliffe, 2002).
There are a few reasons why offenders break into houses. The first is to obtain valuable items such as money, jewelleries and other precious items. Next, crime opportunities are concentrated in time and space (Aantjes, 2012) as well as situations that enable them to enter the house especially if the houses that are located at the corner, with poor or no lighting, located near the road, and no occupants are at higher risk of burglary (Gyamfi, 2005). The statistics report showed residential burglary from 2015-2017 in Kuching most likely occurred between 6 am - 8 am but the burglary decreased during night-time between 9 pm to 12 pm (Crime Investigation Department, Kuching, 2018). This indicates that the cases of residential burglary in Kuching are more likely to occur when residents are out for work. Someone who goes to work leaves home without occupants during the day has a higher risk of becoming a victim of burglary (Luo et.al, 2016; Chon, 2016). Hence, from the findings of this study, the residential burglary in Kuching depends on the crime opportunity such as the physical environment and time that enable offenders to break the house.
CONCLUSION
GIS can contribute to the field of crime and helps police in Kuching, Sarawak to prevent crime more effectively as well as enable local authorities to take action to create a safer environment for the people. From this study, the information of property crime in Kuching can be shared with the police and community in the affected area and it is hoped that more research in various fields can be conducted by using the GIS approach.
ACKNOWLEDGMENTS
REFERENCES
Aantjes, F. (2012). Residential Burglaries A Comparison Between Self-Report Studies of Burglars and Observational Data From Enschede. (Unpublished master dissetation). Enschede, Netherlands: Universiti Twente.
Abdulhafedh, A. (2017). A Novel Hybrid Method for Measuring The Spatial Autocorrelation of Vehicular Crashes: Combining Moran's Index and Getis-Ord Gi* Statistics. Open Journal of Civil Engineering, 7, 208-221.
Ainur Zaireen Zainuddin & Jalaluddin Abdul Malek (2010). Keberkesanan Program Bandar Selamat Persepsi Penduduk Kajian Kes: Bandaraya Shah Alam. Jurnal Teknologi, 53, 13-3.
Chen, P., Yuan, H. & Li, D. (2013). Space-Time Analysis of Burglary in Beijing. Security Journal, 26(1), 1-15.
Chon, D. S. (2016). Residential Burglary Victimization: Household and Country-Level Mixed Modeling. International Review of Victimilogy, 23(1), 1-15.
Cohen, L. E & Felson, M. (1979). Social Change and Crime Rate Trends: Routine Activity Approach. Americal Sociology Review, 44(4), 588-608.
Crime Investigation Department of Kuching. (2018). Property Crime Report Statistics. Kuching: Kuching District Police.
Department of Town and Country Planning. (2019). What is Safe City Monitoring System (SCMS). Retrieved Jun 21 Jun, 2019, from Official Plan of Malaysia: https://
www.townplan. gov.my/index.
php?option=com_content&view=article&id=361&catid=141&Itemid=498&lang =ms
ESRI. (2019). Spatial Autocorrelation Global Moran's I. Retrieved July 7, 2019, from pro.arcgis.com: https://pro.arcgis.com/en/pro-app/tool-reference/spatial-statistics/spatial-autocorrelation.htm
Groff, E. R. & Vigne, G. L. (2001). Mapping An Opportunity Surface or Residential Burglary. Journal of Research in Crime and Deliquency, 38(3), 257-278. Gyamfi, A. J. (2005). Property Offenses in Ghana: Tha Case of Burglary Trends and
Patterns in Accra. International Journal of Comparative and Applied Criminal Justice Fall, 29(2), 150-172.
Kouziokas, G. N. (2017). Applying a GIS-Base System and Crime Hot Spot Analysis in Public Management and Place Marketing and Branding for Sustainable Urban Development and Planning. Proceedings of The 2nd Panhellenic Place Marketing and Place Branding Conference (pp. 1-7). Larissa Greece: University of Thessaly. March, 31-April 2, 2017.
Kuo, S. Y. (2015). Opportunity, Choice and Burglary Victimization in Taiwan.
International Journal of Offender Therapy and Comparative Criminology, 59(8),
873-891.
Lederer, D. (2012). Am I Safe in My Home? Fear of Crime Analyzed with Spatial Statistics Methods a Central European City. Verlag Berlin Heidelberg: Springer. Luo, F., Ren L., Zhao, J. S. (2016). Location Based Fear of Crime: A Case Study in
Houston, Texas. Criminal Justice Review, 41(1), 75-97.
Kuala Lumpur Malaysia. Journal of Architecture, Planning & Construction Management, 1(1), 71-96.
Mohd Fareed & Mohd Yusof Hussain (2013). Keberkesanan Program Bandar Selamat: Persepsi Komuniti di Bandar Kulaijaya, Malaysia. Akademika, 83(1), 25-34. Mohd Norarshad Nordin & Tarmiji Masron (2016). Analisis Ruangan Hot Spot
Penyalahgunaan Dadah di Malaysia: Kajian Kes Daerah Timur Laut, Pulau Pinang. Malaysian Journal of Society and Space, 12(5), 74-82.
Norita, Jubit, Tarmiji Masron, Mohd, Norarshad Nordin & Danggat Chabo. (2019). Aplikasi GIS dalam Mengenal Pasti Kawasan Hot Spot Jenayah Harta Benda di Kuching, Sarawak. Jurnal Geografia, 15(4), 30-49.
Patel, K., Thakkar, P., Patel, L. & Parekh, C. (2014). GIS Based Decission Support System For Crime Mapping, Analysis and Identify Hot Spot in Ahmedabad City.
International Journal of Modern Engineering Research (IJMER), 4(1), 32-35.
Rasul, G. & Ibrahim, G. R. F. (2016). Spatial Pattern of Burglary in South Yorkshire Using Geographic Information System (GIS). International Journal of Astrophysics and Space Science, 2-11.
Ratcliffe, J. (2002). Burglary Reduction and The Myth of Displacement. Australian
Instute of Criminology Trends and Issue in Crime and Criminal Justice,232, 2-6. Rohana Sham, Muhammad Zaly Shah Muhammad Hussein & Hairul Nizam Ismail.
(2013). A Dilemma of Crime and Safety Issues Among Urban Female Dwellers in Malaysia. Proceeding in 2013 ASEAN Conference on Environment-Behaviour
Studies (AcE-Bs 2013). United Kingdom.
Sanders, A. N., Kuhns, J. B. & Blevins, K. R. (2016). Exploring and Understanding Differences Between Delibrate and Impulsive Male and Female Burglars. Crime and Deliquency, 63(12), 1547-1571.
Song, W. & Liu, D. (2013). Exploring Spatial Patterns of Property Crime Risks in Changchun, China. International Journal of Applied Geospatial Research, 4(3), 80-100.
Tarmiji Masron & Ruslan Rainis. (2004). Sistem Sokongan Perancangan PSS: Analisis Aplikasi Bagi Sektor-Sektor Terpilih . Jurnal Teknologi 40(B), 41-66.
Tarmiji Masron, Badaruddin, Mohamed & Azizan, Marzuki. (2015). GIS Base Tourism Decision Support System for Langkawi Island, Kedah, Malaysia. Theoritical and
Empirical Researches in Urban Management, 10(2), 21-25.
Tarmiji Masron, Danggat Chabo, Nur Faziera Yaakub, Ailis Elizabeth Epa, Ahmad Hata Rasit, Mohd Suhaidi Salleh, Shahrizal Hashim, Mohd Hairulnizam Mohd Zamri. (2020). Coronavirus (COVID-19) Post-Control Study of University Students: Case Study of Spatial Distribution of Universiti Malaysia Sarawak (UNIMAS) Students and National COVID-19 Cases. Centre for Spatially Integrated Digital Humanities, Faculty of Social Sciences and Humanities Universiti Malaysia Sarawak, Kota Samarahan, Sarawak.
Thangavelu, A., Sathyaraj, S. R. & Balasubramanian, S. (2013). Assessment of Spatial Distribution of Rural Mapping in India: A GIS Perspective. International Journal
of Advanced Remote Sensing and GIS, 2(1), 71-58.
Wang, Z. & Liu, X. (2017). Analysis of Burglary Hot Spots and Near-Repeat Victimization in a Large Chinese City. International Journal of Geo-Information, 6(5), 2-14.