*Correspon Received: Se
Fu
I Abstract. investment. aims to prop FANP (F ABC mult 80% total found that each item inKeyword
trapezoidal
1. Int
Invento expensiv It repres investm Invento contribu should efficient case, the model w (Nahmia
The ma designin held in i money volume, al., 201 importa to distin items in classifica known a is the A
Th
ding author. Ema ept 29, 2014 ; Rev
uzzy Conti
Industrial & S
. Inventory is con Inventory cost h opose an alternat Fuzzy Analytica ti-criteria classific inventory cost. T by using fuzzy t n “class A” inve
ds: ABC multi-l fuzzy number
troduction
ry is con ve, yet impo sents approx ent (Balakri ry cost has b utors to in be man tly to minim e design of with real li as, 2004: 27
ain factor t ng the inven
inventory is invested, , or stock o 13). In re ance general nguish a limi n several cla ation (Kamp approach to ABC analy
he Asian Journ
ail: meriastuti.gintin vised: June 12, 201
inuous Re
Classifica
System Engin
nsidered as the m has become one o tive inventory mod al Network Proc
cation approach This finding is t trapezoidal cost, entory.
-criteria classifica
nsidered as ortant, to an ximately 50% ishnan et al.
become one nefficiency, naged effe mize the total an appropr ife situation
5).
that should ntory model s not equal i profit po out penaltie eal life, d lly seen as ited number asses known pen et al., 2 o inventory
sis, which
nal of Technol
[email protected] 15, Accepted: July
eview Inv
ation App
Julita and neering Depa
most expensive, y of the major cont del, by using AB cess) and TOPSI identified 12 item then used as the
the inventory tu
ation, FANP-T
s the mo ny companie % of the to ., 2011: 12-2 e of the maj
therefore ectively an
l cost. In th riate invento ns is in ne
be noted l is that item importance otential, sal es (Godwin differences
opportuniti r of invento n as invento 2012). A we classificatio classifies th
logy Managem
y 3, 2015
ventory M
proach: A
d Meriastuti artment, Krid
et important, to tributors to ineff BC multi-criteria IS (Technique of ms of 69 invento
basis to determin urnover ratio can
TOPSIS, continu ost es. tal 2). or it nd his ory ed in ms of les et in ies ory ory ell-ns he in A th – un in de C ap cr on cl m 2. 2. In tw cl be (K fo in ha
ment Vol. 8 No
Model usin
Single Ca
Ginting* da Wacana Ch
any companies. I fficiency, therefore a classification ap of Order Preferen ory items as “out
ne the proposed c be increased, an
uous review inve
nventory ite ABC analysi hree classes:
of average nimportant. n a different
evoted to ca C (Nahmias,
This stu ppropriate riteria classif
n determin lass A item multi-criteria
. Literatu
.1. Multi-Cr n order to cr wo basic que lasses are etween th Kampen et a or the num nventory cla
ad shown
o. 1 (2015):
22-ng ABC M
ase Study
hristian Unive
It represents app it should be ma pproach to minim nces by Similarity tstanding importa
continuous review nd inventory cost
entory model lea
ms based o is divides
A – outstan importance Each class way, with m ategory A, le 2004: 276). udy intend inventory m fication app ning the in ms which is
classificatio
ure Review
riteria Invento reate an inv estions to an
used and he classes al., 2012). Th mber of cl
ssification. P that using
-36
Multi-Crite
y
ersity - Jakart
proximately 50% anaged effectively mize total cost. By ty to the Ideal S ant class” that co w inventory mode can be decreased
ad-time demand
on Pareto p the invento ndingly impo e, and C – r s should be more attenti
ess to B, an
ds to prop model usin proaches and nventory mo
obtained f on result.
ory Classificati entory class nswer are ho
how the are det here is no fi lasses used Previous res g three cla
eria
ta
% of the total . This study By combining Solution), the ontributed to el.This study d by 78% for
distribution, principle. ory into ortant, B relatively handled on being nd less to
pose an g multi-d focuses odel for from the tion ification, ow many borders termined fixed rule d in the
Julita and Ginting, Fuzzy Continuous Review Inventory Model using ABC Multi-Criteria Classification Approach: A Single Case Study
inventory classification is the optimal number and it is familiar to managers. The number of inventory items does not affect the determination or a determination of the number of classes. Rezaei et al. (2010), Torabi et al. (2012), Keskin et al. (2013) classify the raw materials amounting to an average of 50 items into three classes; Kabir et al. (2012) classifies 315 raw materials of construction industry into three classes; and Kartal et al. (2012) classifies 715 raw materials of automotive industry into three classes as well. Therefore, this study classified the inventory items into three classes: A (outstandingly important), B (of average importance), and C (relatively unimportant).
Determination of the borders between the classes affected by the classification criteria and classification techniques (Kampen et al., 2012). The traditional ABC classification has generally been bases on just one criterion, the annual dollar usage. However, using single criteria are irrelevant in real life. Yu (2010) and Keskin et al. (2013) revealed that using the annual dollar usage criterion only might create problems of significant financial loss because there are other important criteria that should be considering such as lead-time, criticality, durability, and so on. Thus, to get the inventory classification criteria, which are relevant to the subject of this research, the study gives authority on managers to choose their own criteria. To assist the selection criteria process, the master list of criteria that have been used in academic researchers are provided.
Multi-criteria inventory classification is a part of Multi-criteria Decision Making (MCDM) problems. Kampen et al. (2012) distinguished this MCDM technique into two types based on the knowledge source: the statistical and judgmental techniques. Statistical techniques knowledge sources are based on data of a number of inventory items characteristics. Yu (2010) and Fernandez et al. (2011) used the statistical
techniques in classify inventory items. They used metaheuristic approach. The advantage of statistical techniques is the classification result spared from subjectivity. However, these techniques have a high level of complexity. The application of these techniques could be cumbersome for inventory managers especially there is no participation of the manager in it (Rezaei et al., 2010; Kampen et al., 2012).
In contrast to statistical techniques, the judgemental techniques involve the opinions of manager especially in the determination of criteria weights. There are some of the judgemental techniques proposed by previous researchers such as Technique of Order Preferences by Similarity to The Ideal Solution (TOPSIS)by Bhattacharya et al. (2007), Fuzzy Analytic Hierarchy Process (FAHP) by Kabir et al. (2012), combination of Fuzzy Delphi and FAHP by Kabir et al. (2013), Simple Additive Weighting (SAW) by Kartal et al. (2013), and Fuzzy Analytic Network Process (FANP) by Kiris (2013).
The Asian Journal of Technology Management, Vol. 8 No. 1 (2015): 22-36
study proposes a combination of FANP and TOPSIS to classify the inventory items.
2.2. Inventory Model
There are two fundamental decisions that should be determined when designing an inventory model. They are when should an order be placed and how much should be ordered (Nahmias, 2004: 193; Balakrishnan et al., 2011: 12-3 - 12-4). The complexity of the resulting inventory model depends upon the assumptions one makes about the various variables of the system. The variables are demand, lead-time, excess demand, inventory costs, and review time (Nahmias, 2004: 193-197).The determination of the characteristics of these variables needs to adjust to the research subject because the proposed model is designing not only to describe the situation of a system but also provides the best answer to the inventory problem.
Demand variable is distinguished into two types: known demand (deterministic model) and uncertain (stochastic model) (Nahmias, 2004:196). According to the condition of the subject of research, this study uses uncertain demand model. It means that the exact number of future demand cannot be predicted at the beginning. The uncertain demand variable is influenced by lead-time variable (Nahmias, 2004:197). In this case, although the future demand cannot be predicted at the beginning, one’s past experience can provide useful information for planning. The random demand on the past can be used to estimate its lead-time demand probability distribution. Previous researchers generally assumed the lead time demand distribution is uniform for all inventory items, such as entirely normal distribution (Silver et al., 2011, Joshi et al., 2011, Zheng et al., 2011; Sadi-Nezhad et al., 2011) or uniform and exponential distribution (Taleizaideh et al., 2013) without statistical testing, whereas the different type of distribution affects the value of decision variables. For this reason, the study proposes to examine the distribution type of
lead-time demand before formulating the inventory model.
Another important characteristic that determines the inventory model formulation is how the system reacts to excess demand (Nahmias, 2004: 197). In accordance with the subject of research, this study used to apply backorder systems in which the system will satisfy the customer’s need in the future.
Determination of inventory models, especially on what variable to be decided is influenced by a review or the review time variable. Review time variables distinguished into two types, continuous review and periodic review (Sipper et al., 1997: 211; Nahmias, 2004: 244). Determining the review time variable should be adjusted to the importance of inventory items on company performance (Nahmias, 2004: 276; Motadel et al., 2012). Previous researchers researchers that considered the importance of inventory item in the review type determination are still limited. Aisyati et al. (2013) for example, who designed the continuous review inventory model for class A and B items. Continuous review inventory model considered suitable for class A and B items that have high costs because this model gives the amount of safety stock that is smaller than the periodic review models. In addition, based on the characteristic of continuous review model where fixed quantity ordering, the supplier are easy to predict the order quantity. For these reasons, in accordance with the objective of this study, we propose to use this continuous review inventory model.
J need to member techniqu Previou inventor and the example (2011), al. (2011 explain member Dutta et in the d research trapezoi better r triangula fuzzy m studies without selection (2011), (2012) u research centroid Jaggi et defuzzif
Figure 1
Julita and Ginting
be determi rship funct ue.
s researcher ry model u
triangular m e, Joshi et
Sadi-Nezha 1), and Jaggi
why th rship funct t al. (2012) e design of E h, Dutta et a
idal memb esults and e ar members membership f also used d
a clear exp n of such
Zheng et al used signed h. Prasath d method i t al. (2012) fication tec
1. Research W
g, Fuzzy Continu
ined. They tion and d
rs who desig usually used membership al. (2011), d et al. (201 i et al. (2012 hey choos tion in th examined th EOQ model al. (2012) fo bership fun economical ship functio function, sev defuzzificatio planation of techniques l. (2011), an distance me et al. (201 in the rese ) tried to chniques: g
Workflow
uous Review Invent
are the fuz defuzzificatio
gned the fuz d a triangul function. F Zheng et 11), Prasath 2) that did n
e triangul heir researc his uncertain l then. In h ound that th
nction giv compared on. As well
veral previo on techniqu f the basis f . Joshi et nd Dutta et
ethod in the 2) using th earch. Final
compare th graded me
tory Model using A
zzy on zzy lar For al. et not lar ch. nty his he ves to as ous ues for al. al. eir he lly, he an in ce m m a ot fr (2 m in te en 3. T st in m an in st th nu sy de ar of ABC Multi-Criter ntegral repre entroid met models. This mean integral more econo ther techni rom Dutta 2012), this membership
ntegral re echnique in nvironment.
. Method
This study i tudy resea nvestigate management
nd find a nventory m tudy empha heory by umbers and ystematic eveloped th re schematic
f this researc
ria Classification A
esentation, thod in th s study prov
l representa omical inve iques. Base a et al. (201
study wi functions epresentatio n stochastic . dology
is an applie arch. This
(in depth in a food su a solution odel for asizes the d
measuring d performs modeling. hrough seve
cally describ ch in Figure
Approach: A Sing
signed dista he design o ved that the ation techniq
ntory cost t d on the 12) and Jag ill use tra
and grade n defuzz c inventory
ed quantitat study t h) the in
upplement c , the app the compan developmen
the varia data analysi This stud ral steps. T bed in the w e 1.
gle Case Study
ance and of EOQ e graded que gives than two findings ggi et al. apezoidal ed mean zification y model tive case ried to nventory company propriate ny. This t of the ables in
is with a dy was The steps
The Asian J The firs criteria criteria structur Group Enterpri criteria, weight each crit techniqu five fuzz (2006) variable Table 1. Lingu impor Just eq Equall Weakly Strong Very st Absolu Source: K Using An The sec priority classify item ba collected determin each item already Traditio used to three cla manager borders Where: C(Q,r) =
k =
Journal of Technol
st step, det and their were collec ed interview
Head of rise. After d
semi-struct of criteria terion with ue was con zy scales de as seen i s are prima
. Fuzzy Ling
uistic s rtance
qual y important y more impo gly more imp trongly mor utely more im Kahraman, E
nalytic Netwo
cond step, d weights o the items. ased on th d by archivi ne the com m in which
obtained f onal ABC cla o classify th asses. In th r of the c between th
= total inven = ordering c
logy Management,
termine the weights. cted by con ws with the f Indocare
determining tured interv
and the de the pair wis nducted. Th efined by K in Table arily used t
guistic Scales scales t ortant portant re important mportant Ertay, Buyuko ork Approach, determine t of inventor Data of ea he selected
ing. TOPSIS mposite prior the criteria from the p assification t he inventor his case, the
ompany de e classes.
ntory cost cost
Vol. 8 No. 1 (20
classificatio Classificatio ducting sem Supply Cha
Citrapasif g the releva views for th
ependence se compariso his study us
ahraman et 1. Linguist to assess th
s of Importa
of Trian scales t (1,1,1) (1/2,1 (1,3/2 (3/2,2 (2,5/2 (5/2,3 ozkan, 2006 , 398. he composi ry items an
ach invento criteria w S was used rity weight
weights we previous ste technique w ry items in supply cha etermined th
015): 22-36
on on mi-ain fic ant he of on ed al. tic he lin pa th se de th T (F fu de m cr ance ngular fuzzy s ) ,3/2) 2,2) 2,5/2) 2,3) 3,7/2) 6, A Fuzzy
ite nd ory was to of ere ep. was nto ain he T fo co A de A ex ho in co re co es ex 26 nguistic ratin airwise com he criteria i election of ecision mak hat do not The Fuzzy
FANP) app uzzy prefere etermine th matrices. Th riteria were d
y Tria scal (1,1, (2/3 (1/2 (2/5 (1/3 (2/7 Optimization
The third s ormulation ontinuous re A items. Prev emand distr Arena Input xpected inv olding cost, n the trap ollected by elated emp ontinuous stimated to xpressed in 62; Sadi-Nez
ngs given by mparisons of in FANP. five scales i ker has rela
affect big e Analytic proach in ence program
e weights o he weights o
determined
angular f les
,1) 3,1,2) 2,2/3,1) 5, 1/2 ,2/3) 3,2/5,1/2) 7,1/3,2/5)
Model for Q
step, design of a fuz eview inven viously, the ribution was t Analyzer entory cost ordering co pezoidal fuz y archiving ployees or review inv otal cost equation ( zhad et al., 2
y decision m f the impor
A selection is intended tively many errors of ju Network which Mi mming was of fuzzy com
of the class in this step.
fuzzy reci
QFD Plannin
n the math zzy or th ntory model
pattern of l s tested by u
software. s such as u ost and pen zzy numbe g and inte managers ventory mo of invento (1) (Nahmia 2011). maker for rtance of n or the
that the y choices udgment. Process ikhailov's used to mparison sification iprocal ng Process hematical e fuzzy for class lead-time using the Data of unit cost, nalty cost er, were erviewing
. In a odel, the
J
λ =
Q =
h =
R =
λτ =
p =
c =
n(R) =
Where, function distribut Because function will be a = o numb
The trap integral equation cost of i
Where F
The opt directly because function (Bahagia procedu
Julita and Ginting
= annual de = optimal o = holding co = reorder po = demand d = penalty co = unit cost = expected
f(x) is t n of th
tion. e we use n for variab as follows:
rdering co ber = k1, k2,
pezoidal fuz representat n (3) are su
inventory in
F (R) is prob
timum value obtained b those e ns that a, 2006: 157 ure suggeste
g, Fuzzy Continu
emand order quantit
ost
oint quantity during lead t
ost
stock out de
the probab he lead-tim
trapezoidal le cost, then
st in trape k3, k4
zzy cost and tion techniq
ubstituted i n equation (1
bability that
e of Q and by equation equations
analytically 7). Therefore ed by Hadle
uous Review Invent
ty
y time
emand per c
bility densi me deman
membersh n the variab
ezoidal fuz
d graded me ques given into the to 1). Taking th
no stock ou
d R cannot b n (4) and (
are impli y intractab
e, the iterati ey and Whit
tory Model using A
cycle is defin
ity nd
hip ble
zzy
B re de c, (R
an in tal he
fir w va
ut occurs in
be (5) cit ble ive tin
(1 pr co (N 15
ABC Multi-Criter
ned in equat
= holdin number = = penalty number = y using epresentation
efuzzificatio , d) in h lev Rezvani, 201
rst derivativ with respect
alues as seen
the lead tim
1963) is used rocedure sh ondition Qi Nahmias, 20
58).
ria Classification A
tion (2):
ng cost in = h1, h2, h3, h
y cost in = p1, p2, p3, p
graded n tec on value of a vel is formul
13).
ve of the i to Q and R n in equation
me, as seen in
d to solve th hould be i = Qi-1 an 004: 262; B
Approach: A Sing
trapezoida h4
trapezoida p4
mean chniques, a fuzzy set A
lated in equ
inventory to R yields the
n (4) and (5)
n equation 6
hese equatio repeated u nd Ri = R
i-Bahagia, 20
gle Case Study
al fuzzy
al fuzzy
integral the A = (a, b, uation (3)
otal cost e optimal
).
6,
ons. This until the
157-The Asian J The fin propose problem Invento inventor and exi compari overstoc ITR va demand the ware total inv Figure 2 In the The crit procurem second the inter example called th other, th the lev process third sta pairwise triangula Table 2. Criteri Price (C Critical Storage Procure
Journal of Technol
nal step is ed model c ms of the c
ry Turnov ry total cos sting mode ison used cking level alues obtain d and averag ehouse per ventory cost
2. The ANP
first stage teria: price,
ment proce stage. The a rdependenc e, based on he cost and he storage c vel of criti The sub-c age. Table 2 e compariso ar fuzzy num
. Local Weig
a
C1) lity (C2) e ability (C3)
ement proce
logy Management,
to evaluate can solve t
ompany. Co ver Ratio st between el will be p d to ev
of the prop ned from
ge inventor year. Comp t was used to
Model for C
the objectiv criticality, s ess are de arrow in thi e among th n the model criticality in capability is
cality and criteria is s 2 shows the n among th mber. For th
ghts and Pai
C (1 (2 ) (1 ess (C4) (2
Vol. 8 No. 1 (20
whether th the invento omparison (ITR) an the propos provided. IT valuate th posed mod the ratio ry quantity parison of th
o evaluate th
Classificatio
ve is define storage abili efined in th
is stage show he criteria. F
l, it could b nfluence ea
influenced b procureme shown in th
matrix of th he criteria in
his matrix, th
r Wise Com
1 ,1,1) 2/7,1/3,2/5)
/3,2/5,1/2) 2/5,1/2,2/3)
015): 22-36
he ory of nd ed TR he del. of in he he pr fin 4. 4. T cr co in de of sh
n Criteria W
ed. ty, he ws For be ch by ent he he n a he qu is cr pa cr lo M w va w (0 co m mparison Ma C2 (5/2,3,7/ ) (1,1,1) ) (1,3/2,2) ) (3/2,2,5/ roposed m nancial aspe
. Results
.1. Inventory There are fou
riteria that ompany. B nterviews to
ependencies f Analytic hown in Fig
Weights
uestion ask the imp riterion with
airwise com riteria also ocal weights Mikhailov's f with Lingo
alues (λ) is a we found tha 0 <λ ≤ 1).
onsistency v means that th
atrix of Crite
C3 /2) (2,5/2, (1/2,2/ (1,1,1) /2) (1,3/2, odel from ect.
s and Discu
y Classification ur criteria an considered By conducti
o find ou s among the
Network ure 2.
ked the decis portance lev
h respect to mparison ma conducted of each ma fuzzy prefe 13.0 soft also measure at the entire For examp values (λ) is he matrix is
eria C4 ,3) (3/2, /3,1) (2/5, (1/2, ,2) (1,1,1 a financial ussion n
nd ten selec d relevant ing semi-st ut the netw
e criteria, th Process (A
sion maker i vel betwee o the decisio atrices betw
in this stu atrix calculat rence progr ftware. Con ed on the m
matrix is co ple, in Tabl
0.61 (0 < λ consistent.
W ,2,5/2) 0 ,1/2,2/3) 0 ,2/3,1) 0
1) 0
λ = 0
l or the
cted sub-to the tructured work of he model ANP) is is "What en each on goal?" een sub-udy. The ted using ramming nsistency atrix and onsistent le 2, the λ≤ 1). It
Julita and Ginting, Fuzzy Continuous Review Inventory Model using ABC Multi-Criteria Classification Approach: A Single Case Study
One such dependence matrix of the pair wise comparisonis is shown in Table 3. It shows the result of criticality criteria as the controlling criterion over other criterions. The semi-structured interview question is
"What criterion is more influential to the criticality criterion: cost or procurement process? How the level of influence of this criterion compared to the other criterion with respect to the criticality?”
Table 3. The Inner Dependence Matrix of The Criteria Based on C2
Criticality (C2) C1 C4 Relative importance weights Price (C1) (1,1,1) (5/2,3,7/2) 0.75
Procurement process (C4) (2/7,1/3,2/5) (1,1,1) 0.25 λ = 0.99
Global weights of criteria are computed by multiplying the dependence matrix of the criteria and the local weights of criteria. Global weights of sub-criteria are calculated
by multiplying the local weights of sub-criteria and the global weights of the related criteria. The global weights are shown in Table 4.
Table 4. Global Weights of The Criteria
Criteria Sub-criteria Local weights Global weights
Price Unit cost (C11) 0.52 0.14
(C1 = 0.27) Holding cost (C12) 0.28 0.08
Ordering cost (C13) 0.20 0.05
Criticality Annual demand (C21) 0.75 0.29
(C2 = 0.39) Availability (C22) 0.25 0.10
Storage ability Expiry date (C31) 0.71 0.11
(C3 = 0.16) Storage ability(C32) 0.29 0.05
Procurement Process Lead time (C41) 0.56 0.10
(C4 = 0.18) Pack size (C42) 0.27 0.05
Minimum order quantity(C43) 0.17 0.03
Global weights of sub-criteria and data for each inventory item based on the sub-criteria were calculated by using TOPSIS to obtain composite priority weight for each inventory item. The inventory items are then classified using traditional ABC classification technique. After careful consideration, the authors of this paper and the management of the company decided that the borders between classes are determined based on
The Asian Journal of Technology Management, Vol. 8 No. 1 (2015): 22-36
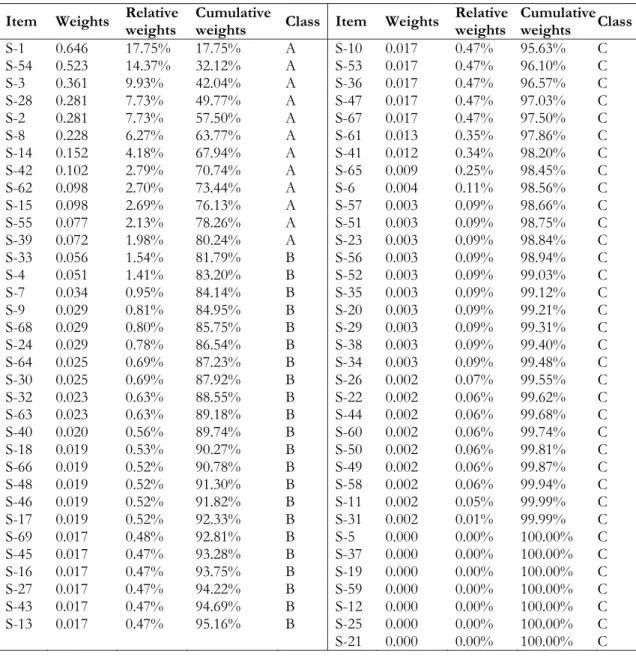
Table 5. Multi-Criteria Classification Result
Item Weights Relative weights Cumulative weights Class Item Weights Relative weights Cumulative weights Class
S-1 0.646 17.75% 17.75% A S-10 0.017 0.47% 95.63% C S-54 0.523 14.37% 32.12% A S-53 0.017 0.47% 96.10% C S-3 0.361 9.93% 42.04% A S-36 0.017 0.47% 96.57% C S-28 0.281 7.73% 49.77% A S-47 0.017 0.47% 97.03% C S-2 0.281 7.73% 57.50% A S-67 0.017 0.47% 97.50% C S-8 0.228 6.27% 63.77% A S-61 0.013 0.35% 97.86% C S-14 0.152 4.18% 67.94% A S-41 0.012 0.34% 98.20% C S-42 0.102 2.79% 70.74% A S-65 0.009 0.25% 98.45% C S-62 0.098 2.70% 73.44% A S-6 0.004 0.11% 98.56% C S-15 0.098 2.69% 76.13% A S-57 0.003 0.09% 98.66% C S-55 0.077 2.13% 78.26% A S-51 0.003 0.09% 98.75% C S-39 0.072 1.98% 80.24% A S-23 0.003 0.09% 98.84% C S-33 0.056 1.54% 81.79% B S-56 0.003 0.09% 98.94% C S-4 0.051 1.41% 83.20% B S-52 0.003 0.09% 99.03% C S-7 0.034 0.95% 84.14% B S-35 0.003 0.09% 99.12% C S-9 0.029 0.81% 84.95% B S-20 0.003 0.09% 99.21% C S-68 0.029 0.80% 85.75% B S-29 0.003 0.09% 99.31% C S-24 0.029 0.78% 86.54% B S-38 0.003 0.09% 99.40% C S-64 0.025 0.69% 87.23% B S-34 0.003 0.09% 99.48% C S-30 0.025 0.69% 87.92% B S-26 0.002 0.07% 99.55% C S-32 0.023 0.63% 88.55% B S-22 0.002 0.06% 99.62% C S-63 0.023 0.63% 89.18% B S-44 0.002 0.06% 99.68% C S-40 0.020 0.56% 89.74% B S-60 0.002 0.06% 99.74% C S-18 0.019 0.53% 90.27% B S-50 0.002 0.06% 99.81% C S-66 0.019 0.52% 90.78% B S-49 0.002 0.06% 99.87% C S-48 0.019 0.52% 91.30% B S-58 0.002 0.06% 99.94% C S-46 0.019 0.52% 91.82% B S-11 0.002 0.05% 99.99% C S-17 0.019 0.52% 92.33% B S-31 0.002 0.01% 99.99% C S-69 0.017 0.48% 92.81% B S-5 0.000 0.00% 100.00% C S-45 0.017 0.47% 93.28% B S-37 0.000 0.00% 100.00% C S-16 0.017 0.47% 93.75% B S-19 0.000 0.00% 100.00% C S-27 0.017 0.47% 94.22% B S-59 0.000 0.00% 100.00% C S-43 0.017 0.47% 94.69% B S-12 0.000 0.00% 100.00% C S-13 0.017 0.47% 95.16% B S-25 0.000 0.00% 100.00% C S-21 0.000 0.00% 100.00% C
4.2. The Proposed Inventory Model
Based on the inventory classification in Table 5, the 12 Class A items will be designed for their inventory model. Using Arena Input Analyzer software yields various types of lead time demand distribution of the items: normal distribution for item S-54, S-8, S-14, S-15 and S-39; uniform distribution for item S-1, S-42, S-62 and 55; lognormal distribution for item S-3 and S-28; and exponential distribution for item S-2.
J
Since th time dem the form stock ou reorder Therefo procedu code fo uniform distribut was use decision
Figure 3
By usin optimal
Julita and Ginting
he finding o mand distrib mulations to
ut demand point (R ore, we d
ures in Vis or each di m, lognorm
tion model. d to determ n variable: op
3. The main
ng the decis order qua
g, Fuzzy Continu
of the four t bution for c o determine per cycle (n R) will b designed fo sual Basic
stribution t mal, and
Each functi mine the inv ptimal order
interface wi
sion suppor ntity (Q), r
uous Review Invent
types of lea class A item
the expect n(R)) and th be differen our functio programmin type: norm
exponent ion procedu ventory mod
r quantity (Q
indow of de
rt system, th reorder poi
tory Model using A
ad-ms,
ed he nt. on ng mal, tial ure del Q),
re in
T su gi su in fil fu ch di at
ecision suppo
he
int (Rm
ABC Multi-Criter
eorder poin nventory cos
The main i upport syste iven in Figu upport syste nventory item
ll in the tex uzzy invent hange the
istribution a t the “sheet2
ort system
R), and total model resum
ria Classification A
nt (R), and st (C(Q,r)).
interface w em in Micro
ure 3. To em, the use m which wi xt boxes of tory cost. T
value of and pack siz
2” in the Mi
l inventory c ed in Table
Approach: A Sing
the estimat
window of osoft Excel run these d er should s ill be calcula annual dem The user c the param e. It can be icrosoft Exc
cost of the p 6.
gle Case Study
ted total
decision l-VBA is decisions select an ating and mand and can also meter of accessed cel-VBA.
The Asian Journal of Technology Management, Vol. 8 No. 1 (2015): 22-36
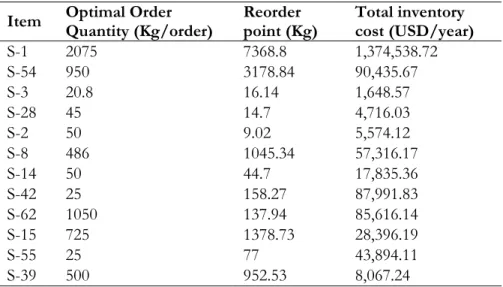
Table 6. The Decision Variables of The Proposed Model
Item Optimal Order Quantity (Kg/order) Reorder point (Kg) Total inventory cost (USD/year)
S-1 2075 7368.8 1,374,538.72
S-54 950 3178.84 90,435.67
S-3 20.8 16.14 1,648.57
S-28 45 14.7 4,716.03
S-2 50 9.02 5,574.12
S-8 486 1045.34 57,316.17
S-14 50 44.7 17,835.36
S-42 25 158.27 87,991.83
S-62 1050 137.94 85,616.14
S-15 725 1378.73 28,396.19
S-55 25 77 43,894.11
S-39 500 952.53 8,067.24
Comparison of Inventory Turnover Ratio
(ITR) and inventory total cost between the existing and proposed model is shown in Table 7.
Table 7. Comparison Between The Existing and Proposed Model
Ite m
Inventory Turnover Ratio
(ITR) Inventory Total Cost (USD/Year) Percentage of savings (%)
Existing
model Proposed model Existing model Proposed model
S-1 3,88 4,28 1.375.141 1.374.539 0,04
S-54 19,87 22,83 92.574 90.436 2,36
S-3 0,53 6,73 5.923 1.649 259,29
S-28 6,78 7,11 17.894 4.716 279,43
S-2 0,70 5,05 9.364 5.574 67,99
S-8 6,97 11,82 67.784 57.316 18,26
S-14 0,79 1,34 47.721 17.835 167,57
S-42 2,92 7,05 123.800 87.992 40,69
S-62 6,08 8,17 108.870 85.616 27,16
S-15 3,49 7,74 28.529 28.396 0,47
S-55 2,39 6,74 73.570 43.894 67,61
S-39 5,05 8,57 8.198 8.067 1,62
Total 1.959.3681 1.806.030 77,71
5. Discussion
The fuzzy continuous review inventory model using multi-criteria ABC classification approaches is presented in this study to the answer the research question. In classifying the 69 inventory items, ten relevant sub-criteria to the subject of research had been selected. Using the FANP techniques, this
Julita and Ginting, Fuzzy Continuous Review Inventory Model using ABC Multi-Criteria Classification Approach: A Single Case Study
The ABC classification based on ten sub-criteria in this research was constructed three inventory classes. The result of this research (as shown in Table 5) by using Pareto principle shows that among 69 items, 12 items (17% of all items) are identified as class A or outstandingly important group, 22 items as class B (32% of all items) as class B or average important group, and the remaining 35 items as class C or relatively unimportant group as a basis for a control scheme. In terms of the number of items per class, this research shows that inventory items that have the highest priority weight will go into class A while inventory items that have the lowest weight will go into the class C and it contains 51% of all items.
These results provide a recommendation for a manager or the manager to start implementing the classification system on their company, so attentions to each inventory item given proportionally. Fuzzy continuous review inventory model has also presented in this research. Before design the model, it was found that from 12 class A items, four items have lead time demand distribution that shaped uniform, five items have normal distribution, two items have lognormal distribution, and an item has exponential distribution. The various types of lead-time demand distributions make this research relevant to the real life situations.
This research also proved that the previous researchers that generally used "assumptions" in determining the type of distribution is a less relevant method to the real life situations. For example, Godwin et al. (2013) who designed a continuous review inventory model in a company in Nigeria assumes all of the inventory items had uniform lead-time demand distribution, or Sadi-Nezhad et al. (2011) who designed the periodic and continuous review inventory model on transformer manufacturing in Iran assume that the lead-time demand distribution is entirely normal. The assumption of lead-time demand distribution is becoming irrelevant because
the differences in the distribution type will affect the mathematical formulation of the expected number of shortage and the value of decision variables.
In developing a practice model for the manager, a decision support system using Microsoft Excel-VBAis presented as the main result of fuzzy continuous review inventory model in this research (as shown in Figure 3). By using this decision support system, the manager can make rapid and accurate decisions. The value of decision variables: optimal order quantity (Q) reorder points (R), inventory total cost have been determined (as shown in Table 6). This research found that reorder point value of each inventory item has a higher value than expected lead-time demand. This means that safety stocks were prepared in this proposed model.
Comparison of Inventory Turnover Ratio (ITR) and inventory total cost between the existing and proposed model have been provided (as shown in Table 7). ITR comparison shows that the proposed model has a higher ratio than the existing model for each Class A item. According to Rao et al. (2009) and Bahagia (2006: 42), incremental of ITR showed an improvement on inventory management in reducing the overstocking level because of the increase in inventory turnover per cycle. Inventory total cost comparison shows that the proposed model has a lower total cost than the existing model for each Class A item. This result also shows that the proposed continuous review inventory model gives average savings of 77.7% compared to an existing model that was used by the company.
The Asian Journal of Technology Management, Vol. 8 No. 1 (2015): 22-36
than continuous review model or it can be said that the percentage of saving is negative. In their analysis, Aisyati et al. (2013) explained that the continuous review model might be failing to result in or result from better inventory model since the demand of the items is too lumpy or it has pattern of Poisson lead-time demand distribution. Aisyati et al. (2013) also recommended that this Poisson demand could be managed by periodic review inventory model. This finding is caused by the classification technique. Aisyati et al. (2013) used traditional ABC classification in their research. It means that the class A items are high-value inventory based on the dollar usage only. Consequently, although the demand of a high-cost item is too lumpy, it will be classified as class A. Therefore, the findings of this research, the positive percentage of saving of each class an items prove that the design of the inventory model using ABC multi-criteria classification approach would be more effective in saving the inventory cost than using traditional ABC classification.
6. Conclusion and Future Research
6.1. Conclusion
Based on the study, it can be concluded that Combination of Fuzzy Analytic Network Process (FANP) and Technique of Order Preferences by Similarity to the Ideal Solution (TOPSIS) in ABC multi-criteria classification techniques identified 12 items of 69 inventory items as class A (outstandingly important class. They contribute to 80% total inventory cost. Furthermore, the appropriate inventory model for class A items is fuzzy continuous review inventory model using trapezoidal fuzzy numbers and the statistical testing of lead time demand distribution. This proposed inventory model increase the inventory turn ratio and reduce the inventory total cost with average savings of 78% for each inventory item. These findings show that the proposed model is feasible to be implemented in the company.
6.2. Future Research
Future research can look at designing the appropriate inventory control model for more than one company or more than one class item. An inventory control model that also consider several factors such the decay factor, partial delivery from suppliers, and warehouse capacity constraint can also be designed in future research. Future research can also look to design an inventory-model or the inventory-model decision support system using demand-forecasting approach.
6.3. Contribution
This researched expected to contribute to the development of inventory management in real situations. The combination of FANP, TOPSIS, and traditional ABC classification technique found as an effective combination technique to classify the inventory items, especially a relatively large amount of inventory. a previous or the previous study, the graded mean integral representation defuzzification technique and trapezoidal membership function were just applied the indeterministic or an indeterministic model. Therefore, applying this defuzzification technique and membership function is the contribution of this research in stochastic inventory model environment. This research shows that the lead-time demand distribution is not always normally distributed and it needs to be testing before design the mathematical formulation of inventory model. Finally, the research that proposes a fuzzy continuous review inventory model with various types of lead-time demand distribution can also contribute to the mathematical formulation of inventory control models.
Julita and Ginting, Fuzzy Continuous Review Inventory Model using ABC Multi-Criteria Classification Approach: A Single Case Study
provided an inventory model decision support system for the company so managers can make rapid and accurate decisions.
References
Aisyati, A., Jauhadi, W.A., and Rosyidi, C. N. (2013). Determination Inventory Level for Aircraft Spare Parts Using Continuous Review Model. International Journal of Business Research and Management, 4(1), 1-12.
Bahagia, S. N. (2006). Sistem Inventori. Bandung: Penerbit ITB.
Balakrishnan, N., Render, B and Stair, R.M. (2011). Managerial Decision Modeling with Spreadsheets. 3rd ed. USA: Pearson. Bhattacharya, A,, Sarkar, B., and Mukherjee,
S. K. (2007). Distance-based consensus method for ABC analysis." International Journal of Production Research 45(15), 3405-3420. Dutta, D., and Kumar, P. (2012). Fuzzy
Inventory Model without Shortage Using Trapezoidal Fuzzy Number with Sensitivity Analysis." IOSR Journal of Mathematics 4(3), 32-37.
Fernandez, I., D. Gonzalez, A. Gomez, P. Priore, J. Puente, and J. Parreno. (2011). Comparative analysis of artificial intelligence techniques for goods classification." In Proceedings of the 2011 International Conference on Artificial Intelligence, ICAI: 1-7.
Godwin, H. C., and Onwurah, U. O. (2013). Inventory Management: Pivotal in Effective and Efficient Organizations. A Case Study." Journal of Emerging Trends in Engineering & Applied Sciences 4(1), 115-120.
Jaggi, C. K., Pareek, S., and Sharma, A. (2012). Fuzzy Inventory Model for Deteriorating Items with Time-varying Demand and Shortages. American Journal of Operational Research 2(6), 81-92.
Joshi, M., and Soni, H. (2011). (Q, R) inventory model with service level constraint and variable lead time in
fuzzy-stochastic Environment. International Journal of Industrial Engineering Computations 2(4), 901-912. Kabir, G and Hasin, M. A .A. (2012):
Multiple criteria inventory classification using fuzzy analytic hierarchy process.” International Journal of Industrial Engineering Computations 3 (2), 123-132.
Kabir, G and Sumi, R.S. (2013). Integrating Fuzzy Delphi with Fuzzy Analytic Hierarchy Process for Multiple Criteria Inventory Classification. Journal of Engineering, Project & Production Management 3 (1), 22-34.
Kahraman, C., Ertay, T., and Büyüközkan, G. (2006). A fuzzy optimization model for QFD planning process using analytic network approach. European Journal of Operational Research 171(2), 390-411.
Kampen, Tim J. van, Renzo Akkerman, and Dirk Pieter van Donk. (2012). SKU classification: a literature review and conceptual framework." International Journal of Operations & Production Management 32, no. 7 p.850-876.
Kartal, H. B. , and Cebi, F. (2013). Support Vector Machines for Multi-Attribute ABC Analysis." International Journal of Machine Learning and Computing 3(1) (February),154-157.
Keskin, G. A., and Ozkan, C. (2013). Multiple Criteria ABC Analysis with FCM Clustering." Journal of Industrial Engineering 2013 ,1-7.
Kiris, S. (2013). Multi-Criteria Inventory Classification by Using a Fuzzy Analytic Network Process (ANP) Approach. Informatica 24 (2), 199-217. Motadel, M. R., Eshlagy, A. T., and
Ghasemi, S. (2012). The Presentation of a Mathematical Model to Assess and Control the Inventory Control System through ABC Analysis Approach." International Journal of Information Security 1(1), 1-13.
The Asian Journal of Technology Management, Vol. 8 No. 1 (2015): 22-36
Multi-Item Inventory Control. Industrial Engineering & Management System 12 (3), 172-180.
Nahmias, S. (2004). Production and Operations Analysis, 5th ed. New York, NY: McGraw-Hill.
Rao, M. C., and Rao, K. P. (2009). Inventory turnover ratio as a supply chain performance measure. Serbian Journal of Management 4(1), 41-50.
Rezaei, Jafar and Shad Dowlathahi. (December 2010). A rule-based multi-criteria approach to inventory classification. International Journal of Production Research 48(23), 7107-7126. Rezvani, S. (2013). A new method for
ranking in areas of two generalized trapezoidal fuzzy numbers. International Journal of Fuzzy Logic Systems (IJFLS) 3 (1), 17-24.
Sadi-Nezhad, S., Nahavandi, S and Nazemi, J. (2011). Periodic and continuous inventory models in the presence of fuzzy costs. International Journal of Industrial Engineering Computations 2(1), 179-192.
Silver, Edward A., and Diane P. Bischak. (2011). The exact fill rate in a periodic review base stock system under normally distributed demand. Omega 39(3), 346-349.
Sipper, D., and Bulfin, R. L. (1997). Production: Planning, Control, and Integration. New York, NY: McGraw-Hill.
Taleizadeh, Ata Allah, Seyed Taghi Akhavan Niaki, Mir-Bahador Aryanezhad, and Nima Shafii. (2013). A hybrid method of fuzzy simulation and genetic algorithm to optimize constrained inventory control systems with stochastic replenishments and fuzzy demand. Information Sciences 220, 425-441.
Torabi, S. A., Hatefi, S. M. and Pay, B.S. (2012). ABC inventory classification in the presence of both quantitative and qualitative criteria. Computers & Industrial Engineering 63 (2), 530-537. Yu, Min-Chu. (2011). Multi-criteria ABC
analysis using artificial-intelligence-based classification techniques. Expert System with Applications 38 (4), 3416-3421.