SAJCH MARCH 2010 VOL. 4 NO. 1 11
ARTICLE
U O Uchendu, FMCPaed, MWACP (Paed)
Department of Paediatrics, University of Nigeria Teaching Hospital Enugu, Nigeria Medical Research Council Laboratories (UK), The Gambia
A R C Nwokocha, FMCPaed
A N Ikefuna, FMCPaed
I J Emodi, FMCPaed, FWACP(Paed)
Department of Paediatrics, University of Nigeria Teaching Hospital Enugu, Nigeria
C N Onwasigwe, FWACP(PH)
Department of Community Medicine, University of Nigeria Teaching Hospital Enugu, Nigeria
Corresponding author: U Uchendu ([email protected])
Evaluation of sexual maturity among
adolescent male sickle cell anaemia
patients: The usefulness of testicular volume
estimation
S
A
J
ou
rna
l of Child H
ea
lth
S
A
J
ou
rna
l of Child H
ea
lth
S
A
J
ou
rna
l of Child H
ea
lth
Background. The use of Tanner stages (i.e. sexual maturity rating (SMR)) in evaluating sexual maturity has gained widespread
acceptance. Tanner staging assesses pubic hair growth and increase in genital size, the latter factor being best reflected by increase in testicle size. Testicular volume increases are thought to be the most sensitive clinical indication of onset and progress of puberty. It has been suggested that the initial stage of sexual development may be missed if testicular volume is not assessed. We explored the usefulness of testicular volume (TV) for assessing sexual maturity among adolescent male sickle cell anaemia (SCA) patients.
Methods. We conducted a cross-sectional case-control study evaluating sexual maturation of male patients with sickle cell
anaemia and those with the HbAA genotype. Tanner staging and testicular volume assessment were both used as models for evaluating stages of sexual maturation among SCA patients and their normal counterparts matched for age and socio-economic status.
Results. SCA patients showed delayed onset and completion of sexual maturation. TV of subjects was smaller than those of
controls but, when related to stages of sexual maturity, there was no statistically significant difference between the groups. The correlation coefficients between various stages of sexual maturity and TV suggest strong associations.
Conclusion. The increase in testicular volume was found to be a good predictor of onset and progression of sexual maturity in
both SCA subjects and their healthy controls.
The evolution of human life from conception to adulthood is marked by complex and profound changes, one of which is the transformation into a reproductively mature adult through the stage of adolescence.1 Adolescence is a period of rapid biological and psychosocial development, not only dependent on hormonal determinants but also strongly on environmental
influence.2 The physical changes of adolescence progress
sequentially until a sexually mature adult results.
Assessment of sexual maturation is essential in the clinical evaluation of adolescents, allowing evaluation of their developmental stage. Chronological age is not a reliable parameter for biological, psychological, and social characterisation of individuals.2,3 Pubertal staging allows doctors to assess the maturation of adolescents; to correlate several pubertal phenomena such as age at menarche, growth spurts and final height; and to advise and manage patients appropriately.2,3
Sexual maturity involves development of secondary sexual characteristics with well-defined features in the genitalia and pubic hair. The events of sexual maturation, first described by Tanner4 and later by Marshall and Tanner,5 have gained widespread acceptance.6-9 Also known as sexual maturity rating (SMR) or Tanner staging, 5 levels of sexual maturity (SMR 1 - 5) are identifiable, with stages of classification based on the quantity and configuration of pubic hair (PH) as well as the maturation of the genitalia (G).
indication of the onset and progress of puberty.10,12-14 It has been argued that the initial stage of sexual development may be missed if testicular volume is not assessed.12
We evaluated the usefulness of testicular volume estimation as an indicator of the onset and progression of sexual maturity among male sickle cell anaemia (SCA) patients who were matched against controls with haemoglobin AA genotype. We believe that this is the first study that has evaluated the sexual maturation of SCA patients in Nigeria, with inclusion of testicular size assessment.
Patients and methods
This study was carried out between April and September 2006, in Enugu, south eastern Nigeria. Subjects for the study were recruited from the Sickle Cell Clinic (SCC) and the Children Outpatient (CHOP) Clinic of the Department of Paediatrics, University of Nigeria Teaching Hospital (UNTH) Enugu. Ethical approval was obtained from the hospital’s ethics committee and informed written consent from patients and/ or their parents. SCA patients in the study were aged 6 - 18 years. Patients with other chronic illness(es) that affect growth and sexual development, and those whose ages could not be ascertained, were excluded. The control patients were children with normal HbAA genotype attending CHOP for illnesses that did not affect growth and sexual maturation. Both groups of patients (subjects and controls) were matched for age and socio-economic status. Socio-economic status was assigned by the method of Olusanya et al.15
The minimum sample size for the SCA subjects was determined
first for an infinite population, using an appropriate formula,16
which gave a figure of 71. An attrition factor of 40% was applied to allow for late withdrawal of consent, bringing the sample size up to 100.
Male SCA patients aged 6 - 18 years were stratified by age to ensure an unskewed selection, and to make allowance for units that will contain the mean ages of attainment of the various Tanner stages as found in a previous study6 on sexual maturation among boys in the area of the study. Subjects were enrolled consecutively on clinic days. One hundred and one controls were selected to match the age and social class distribution of the principal subjects.
Both study groups were examined and stages of sexual maturation determined by the method of Marshall and Tanner, using standard photographs as a guide.5 Several methods can be used for assessing testicular volume, including the use of the Prader orchidometer, which includes 12 ellipsoid testicular forms made of wood or plastic and attached to a string. The forms range from 1 to 25 ml.17 It is also possible to measure the
two axes of the testis with a transparent ruler or, for greater accuracy, a caliper (similar to that used for measuring skin-fold) and then calculate the volume mathematically.3,18 In this study, we determined testicular size by the formula method. The skin of the testis was stretched without compressing it, and the greatest length and width were measured with a transparent metric ruler.6,18,19 The testis is an ellipsoid, and volume is calculated using the formula3,18 V=∏/6 x L x W2 or V=0.523 x L x W2; where
L = length or longitudinal diameter of the testis W = width or cross-sectional diameter of the testis ∏ = geometric constant (equivalent to 3.14)
The measurement of testicular volume by ultrasonography employs the same principle of measuring both the longitudinal and cross-sectional diameters, and has been reported as the most precise method.20 Some workers have demonstrated that all methods offer comparable reliability.3
Volumes of both left and right testes were calculated and an average taken. Data were analysed using the Statistical Package for Social Sciences (SPSS version 11.5). Measures of statistical location were calculated for continuous data and percentages/proportions for discrete data. Proportions were tested using chi-square test while means were compared by
t-tests. The level of significance was taken as p<0.05.
Results
One hundred male SCA patients and 101 non-SCA patients (controls) matched for age and socio-economic class were recruited. The age range of both study groups was 6.0 - 18.0 years, with a mean of 12.2±3.5) years for the subjects and 12.0±3.5 years for the control group.
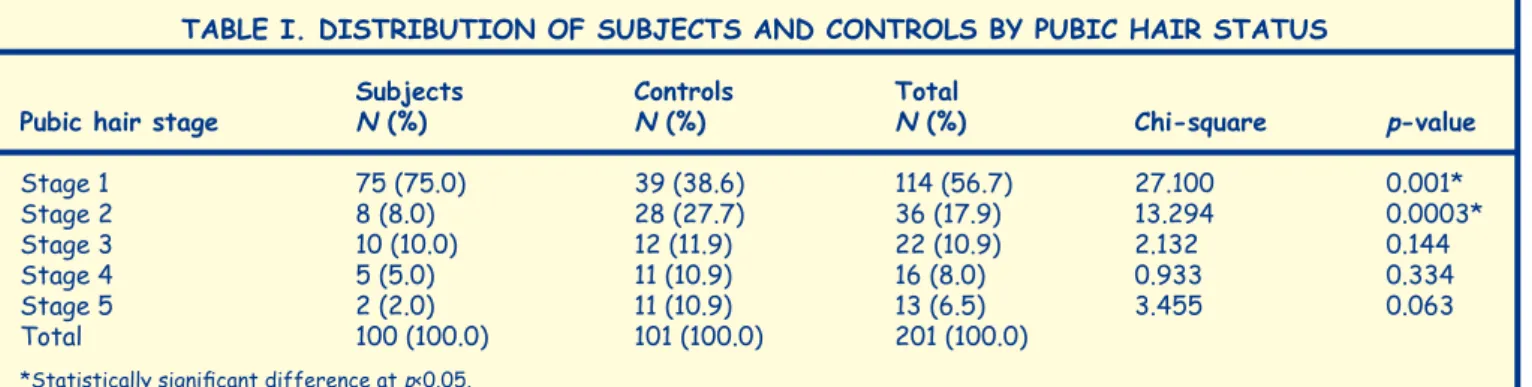
Most subjects were in the early stages of PH development, with a few in the later stages. The reverse was the case for the controls. Therefore, 75 (75%) subjects were at PH1, versus 39
(38.9%) controls (p=0.0003). There were also significantly more
controls at PH4 and 5 than subjects (22 (21.8%) v. 7 (7.0%)) (p<0.0010 (Table I).
The pattern is similar for genital development, with more SCA subjects in earlier stages of development than controls (57.0% and 33.7% respectively at G1) (Table II).
SCA patients showed delayed genital and PH stages of development in comparison with the controls. Onset of puberty was 12.0±2.0 v. 12.6±2.3 years (p=0.00001) for G2, and
14.7±1.5 v. 15.5±1.5 years (p=0.0002) for PH2 for cases and
controls respectively (Table III).
The mean ages of the control group at the final stage of puberty (G5, PH5) were lower when compared with those of
TABLE I. DISTRIBUTION OF SUBJECTS AND CONTROLS BY PUBIC HAIR STATUS
Subjects Controls Total
Pubic hair stage N (%) N (%) N (%) Chi-square p-value
Stage 1 75 (75.0) 39 (38.6) 114 (56.7) 27.100 0.001*
Stage 2 8 (8.0) 28 (27.7) 36 (17.9) 13.294 0.0003*
Stage 3 10 (10.0) 12 (11.9) 22 (10.9) 2.132 0.144
Stage 4 5 (5.0) 11 (10.9) 16 (8.0) 0.933 0.334
Stage 5 2 (2.0) 11 (10.9) 13 (6.5) 3.455 0.063
Total 100 (100.0) 101 (100.0) 201 (100.0)
the subjects (16.0±1.6 v. 18.0±0.0 years) for G5 and 16.3±1.6 v. 18.0±0.0 years for PH5, respectively.
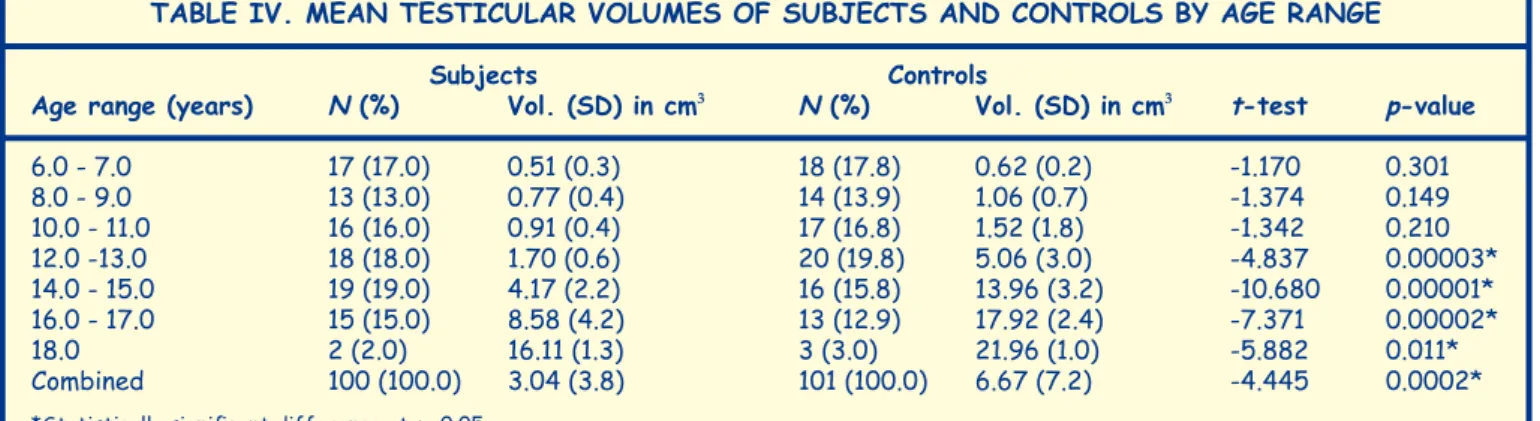
The mean testicular volume for controls was significantly
higher than that for SCA subjects (6.67±7.2 cm3 v. 3.04±3.8 cm3)
(p=0.0002). Patients in the control group attained a testicular volume >3cm3 within the age range 12.0 - 13.0 years, which was earlier than observed among the SCA patients whose
average testicular volume in that age range was 1.70 cm3.
It is noteworthy that, from age 12 years onwards, the mean testicular volumes of controls were significantly higher than those of SCA subjects (Table IV).
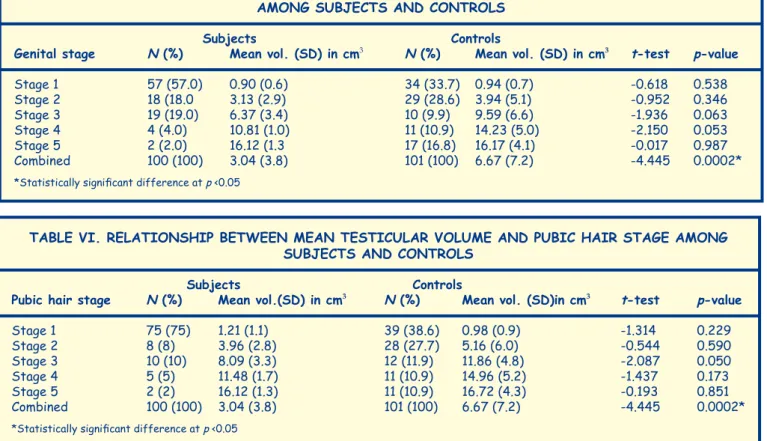
The mean testicular volumes of subjects and controls were matched with the various genital and PH stages of development to evaluate the usefulness of testicular volume assessment in determining maturity status of patients. The average testicular
volume at G2 for subjects and controls was 3.1±2.9 cm3 and 3.9±5.1 cm3 respectively. The testicular volumes of the control population remained higher than those of the subjects at every successive level of genital maturation, but the differences were not statistically significant (Table V).
Further analysis for the strength of association between genital stages and testicular volumes of the study groups showed
a strong association, with correlation coefficient r=+0.845, p
<0.001 for the SCA group and r=+0.820, p<0.001 for the control group.
A similar pattern was observed in the relationship between the stages of PH maturity and the testicular volumes of subjects and controls (Table VI). There was also no statistically significant difference between the subject and control groups. Again, there was a very strong association between PH stages
TABLE IV. MEAN TESTICULAR VOLUMES OF SUBJECTS AND CONTROLS BY AGE RANGE
Subjects Controls
Age range (years) N (%) Vol. (SD) in cm3 N (%) Vol. (SD) in cm3 t-test p-value
6.0 - 7.0 17 (17.0) 0.51 (0.3) 18 (17.8) 0.62 (0.2) -1.170 0.301
8.0 - 9.0 13 (13.0) 0.77 (0.4) 14 (13.9) 1.06 (0.7) -1.374 0.149
10.0 - 11.0 16 (16.0) 0.91 (0.4) 17 (16.8) 1.52 (1.8) -1.342 0.210
12.0 -13.0 18 (18.0) 1.70 (0.6) 20 (19.8) 5.06 (3.0) -4.837 0.00003*
14.0 - 15.0 19 (19.0) 4.17 (2.2) 16 (15.8) 13.96 (3.2) -10.680 0.00001*
16.0 - 17.0 15 (15.0) 8.58 (4.2) 13 (12.9) 17.92 (2.4) -7.371 0.00002*
18.0 2 (2.0) 16.11 (1.3) 3 (3.0) 21.96 (1.0) -5.882 0.011*
Combined 100 (100.0) 3.04 (3.8) 101 (100.0) 6.67 (7.2) -4.445 0.0002*
*Statistically significant difference at p <0.05
TABLE II. DISTRIBUTION OF SUBJECTS AND CONTROLS BY GENITAL MATURITY STAGE
Subjects Controls Total
Genital stage N (%) N (%) N (%) Chi-square p-value
Stage 1 57 (57.0) 34 (33.7) 91 (45.3) 11.045 0.001*
Stage 2 18 (18.0) 29 (28.7) 47 (23.4) 3.219 0.073
Stage 3 19 (19.0) 10 (9.9) 29 (14.4) 0.803 0.370
Stage 4 4 (4.0) 11 (10.9) 15 (7.5) 2.380 0.123
Stage 5 2 (2.0) 17 (16.8) 19 (9.4) 5.818 0.016*
Total 100 (100.0) 101 (100.0) 201 (100.0)
*Statistically significant difference at p <0.05
TABLE III. MEAN AGE OF SUBJECTS AND CONTROLS IN EACH STAGE OF PUBERTY IN CHRONOLOGICAL ORDER
Tanner Stage N (%) Mean age in years (SD)
Subjects Controls Subjects Controls t-test p-value
G1 57 (57.0) 34 (33.7) 9.7 (2.4) 8.3 (1.8) 3.19 0.002*
PH1 75 (75.0) 39 (38.6) 10.9 (2.9) 8.5 (1.8) 4.49 0.0001*
G2 18 (18.0) 29 (28.7) 14.7 (1.5) 12.0 (2.0) 4.79 0.0001*
PH2 8 (8.0) 28 (27.7) 15.5 (1.5) 12.6 (2.3) 3.36 0.002*
G3 19 (19.0) 10 (9.9) 15.6 (1.1) 13.5 (3.0) 2.13 0.059
PH3 10 (10.0) 12 (11.9) 15.9 (0.7) 14.3 (1.6) 3.11 0.007*
G4 4 (4.0) 11 (10.9) 17.4 (0.3) 15.1 (1.6) 2.82 0.014*
PH4 5 (5.0) 11 (10.9) 17.5 (0.4) 15.5 (1.6) 3.98 0.002*
G5 2 (2.0) 17 (16.8) 18.0 (0.0) 15.9 (1.6) 1.82 0.087
PH5 2 (2.0) 11 (10.9) 18.0 (0.0) 16.3 (1.6) 1.47 0.169
*Statistically significant difference at p <0.05
and testicular volumes, with correlation coefficients, r=0.903,
p<0.001 for subjects, and r=0.809, p<0.001 for controls.
Discussion
The onset of sexual maturation stages 2 (PH2 and G2)5,10 was delayed among our SCA patients compared with their age-matched normal controls, a finding in keeping with earlier reports from both within7,21,22 and outside,23-26 Nigeria. The mean age at onset of puberty (14.7+1.5 years for G2) among male SCA patients observed in our study is similar to that reported by Ozigbo and Nkanginieme7 for adolescents in Port Harcourt, Rivers State (14.6+1.4 years). The onset of PH2 (15.5+1.5 years) that we found is also comparable with the figure of 14.7+1.3 years documented in the Port Harcourt series,7 but is much lower than that of Oyedeji,22 who reported the earliest age of PH development in males to be 20 years from a study22 which might have been biased because of the small numbers. (only 6 males aged ≥13 years). SCA patients also demonstrated a significant delay in completion of sexual maturation, compared with their normal controls. Whereas SCA patients attained both final genital and PH maturity status at 18.0+0.0 years, their control counterparts did so at
15.9+1.6 years and 16.3+1.6 years respectively. These finding
are similar to figures reported by Ozigbo and Nkanginieme7.
There is a wide difference between the mean age of onset of sexual maturation in this study compared with that in a study25 that documented a subnormal PH growth pattern in male SCA patients with a mean age of up to 26.6 years. Selection bias has been suggested as a possible explanation because of the authors’ interest in hypogonadism and likelihood of seeing more severely affected patients.7
We also assessed the relationship between testicular volume and sexual maturation. Testicular volume of both SCA subjects and controls demonstrated at least a threefold increase at G2 and PH2 over the pre-pubertal sizes. In all cases, the mean testicular volume was >3 ml. Earlier workers4,10,13 had reported that increase in testicular volume to >3 ml is the best marker for onset of puberty, and that the initial phase may be missed if testicular volume is not assessed.12 The mean testicular volumes of SCA patients were lower than those of the controls throughout all age groups, but this was only statistically significant within the same age range (12.0 - 13.0 years) when the controls also attained Tanner stage 2. On the other hand, the subjects had a testicular volume of 4.17 ml in the age range 14.0 - 15.0 years when they also entered G2. It is therefore possible to say that a testicular volume above 3.0 ml is a good indicator of onset of puberty for both subjects and controls. This statement is strengthened by the fact that there was a very strong association between the various stages of genital and PH development, and the average testicular volumes of both subjects and controls, with very high correlation coefficients. When average testicular volume is related to the various Tanner stages of sexual maturation for both subjects and controls, it was shown that the volumes of the former group were slightly smaller than those of the latter. However, this difference was not statistically significant at every stage of TABLE VI. RELATIONSHIP BETWEEN MEAN TESTICULAR VOLUME AND PUBIC HAIR STAGE AMONG
SUBJECTS AND CONTROLS
Subjects Controls
Pubic hair stage N (%) Mean vol.(SD) in cm3 N (%) Mean vol. (SD)in cm3 t-test p-value
Stage 1 75 (75) 1.21 (1.1) 39 (38.6) 0.98 (0.9) -1.314 0.229
Stage 2 8 (8) 3.96 (2.8) 28 (27.7) 5.16 (6.0) -0.544 0.590
Stage 3 10 (10) 8.09 (3.3) 12 (11.9) 11.86 (4.8) -2.087 0.050
Stage 4 5 (5) 11.48 (1.7) 11 (10.9) 14.96 (5.2) -1.437 0.173
Stage 5 2 (2) 16.12 (1.3) 11 (10.9) 16.72 (4.3) -0.193 0.851
Combined 100 (100) 3.04 (3.8) 101 (100) 6.67 (7.2) -4.445 0.0002*
*Statistically significant difference at p <0.05
TABLE V. RELATIONSHIP BETWEEN MEAN TESTICULAR VOLUME AND GENITAL MATURITY STATUS AMONG SUBJECTS AND CONTROLS
Subjects Controls
Genital stage N (%) Mean vol. (SD) in cm3 N (%) Mean vol. (SD) in cm3 t-test p-value
Stage 1 57 (57.0) 0.90 (0.6) 34 (33.7) 0.94 (0.7) -0.618 0.538
Stage 2 18 (18.0 3.13 (2.9) 29 (28.6) 3.94 (5.1) -0.952 0.346
Stage 3 19 (19.0) 6.37 (3.4) 10 (9.9) 9.59 (6.6) -1.936 0.063
Stage 4 4 (4.0) 10.81 (1.0) 11 (10.9) 14.23 (5.0) -2.150 0.053
Stage 5 2 (2.0) 16.12 (1.3 17 (16.8) 16.17 (4.1) -0.017 0.987
Combined 100 (100) 3.04 (3.8) 101 (100) 6.67 (7.2) -4.445 0.0002*
*Statistically significant difference at p <0.05
S
A
J
ou
rna
l of Child H
ea
lth
S
A
J
ou
rna
l of Child H
ea
lth
ou
rna
l of Child H
ea
Testicular volume is a reliable
and simple clinical evaluation
of sexual maturation in
adolescent males.
SAJCH MARCH 2010 VOL. 4 NO. 1 15
both genital and PH development, implying that by using the calculated testicular volume, one may be able to predict the same Tanner stage for both an SCA patient and a control patient with HbAA genotype. Therefore, the difference in testicular volumes between SCA patients and their controls of the same age is annulled when the volumes are compared with those at the same stage of puberty.
Our study has confirmed the findings of delayed sexual maturation among SCA patients reported from other parts of Nigeria and beyond. More importantly, however, it has also shown that testicular volume assessment is useful for providing information on adolescent sexual maturation, including in SCA patients. Whereas Tanner staging of PH and genital size may be subjective and vary among different assessors, testicular volume is a reliable and simple clinical evaluation of sexual maturation in all adolescent males.
Conflict of interest
The authors declare no conflict of interest. Partial funding was received from the University of Nigeria Teaching Hospital as part-sponsorship for the conduct of this research, which was presented as a dissertation for the postgraduate fellowship programme by UOU. No funding was received from any external agencies for this research work.
References
1. Butterworth’s Medical Dictionary. MacDonald Critchley (ed). London: Butterworth & Co., 1990: 1408.
2. Nwokocha ARC. Adolescence and associated problems. In: Azubuike JC, Nkanginieme KEO, eds. Paediatrics and Child Health in a Tropical Region. Owerri, Nigeria: African Educational Services, 1999: 97-109.
3. Chipkevitch E. Clinical assessment of sexual maturation in adolescents. J Pediatr (Rio J) 2001; 77 (Suppl. 2): S135-S142.
4. Tanner JM. Growth at Adolescence, with a General Consideration of Hereditary and Environmental Factors upon Growth and Maturation from Birth to Maturity. Oxford: Blackwell Scientific Publications, 1962: 197-206.
5. Marshal WA, Tanner JM. Variations in pattern of pubertal changes in boys. Arch Dis Child 1970; 45: 13-23.
6. Adediran A. Sexual maturation of Igbo boys in Enugu. FMC Paed dissertation. National Postgraduate Medical College of Nigeria, Lagos,
2002: 42-47.
7. Ozigbo CJ, Nkanginieme KEO. Body mass index and sexual maturation
in adolescent patients with sickle cell anaemia. Nig J Paediatr 2003; 30: 39-44.
8. Ezeome ER, Obanye RO, Onyeagocha AC, Achebe LN, Chigbo J, Onuigbo WI. Normal pattern of pubertal changes in Nigerian boys. W Afr Med J 1997; 16: 6-11.
9. Sun SS, Schubert CM, Chumlea WC, et al. National estimates of the timing of sexual maturation and racial differences among US children. Pediatrics 2002; 110: 911-919.
10. Anne-Simone P, Grete T, Anders J, Niels ES, Jorma T, Bourguignon JP. The timing of normal puberty and the age limits of sexual precocity:
variations around the world, secular trends, and changes after migration. Endocrinol Rev 2003; 24: 668-693.
11. Swerdloff RS. Physiological control of puberty. Med Clin North Am 1978;
62: 351-360.
12. Papadimitrou A. Timing of sexual maturation (letter). Pediatrics 2004;
113: 177-178.
13. Biro FM. Pubertal staging in boys. J Pediatr 1995; 127: 100-102.
14. Savage DCL, Evans J. Puberty and adolescence. In: Forfar JO, Arneil GC, eds. Textbook of Paediatrics. London: Churchill Livingstone, 1990:
371-393.
15. Olusanya O, Okpere E, Ezimokhai M. The importance of social class involuntary fertility control in a developing country. W Afr Med J 1985; 4: 205-212.
16. Araoye MO. Research Methodology with Statistics for Health and Social Sciences. Ilorin: Nathadex Publishers, 2004: 115-120.
17. Prader A. Testicular size: Assessment and clinical importance. Triangle
1966; 7: 240-243.
18. Cantu JM, Scaglia HC, Medina M. Inherited congenital normo-functional
testicular hyperplasia and mental deficiency. Hum Genet 1976; 33: 23.
19. William AD, Ronald AF, Patricia HP, Wayne DB. Testicular volumes of adolescents. J Pediatr 1982; 101: 1010-1012
20. Behre HM, Nashan D, Nieschlag E. Objective measurement of testicular volume by ultrasonography: evaluation of the technique and comparison with orchidometer estimates. Int J Androl 1989; 12: 395-403.
21. Emodi I. Physical and sexual development in children with sickle cell anaemia. FMCPaed dissertation, National Postgraduate Medical College of Nigeria, Lagos, 1989: 30-56.
22. Oyedeji GA. Delayed sexual maturation in sickle cell anaemia patients: observation in one practice. Ann Trop Paediatr 1995; 197-201.
23. Serjeant GR. Sickle Cell Disease. Oxford: Oxford University Press, 1992: 358-360.
24. Singhal A, Thomas P, Cook R, Wierenga K, Serjeant G. Delayed adolescent growth in homozygous sickle cell disease. Arch Dis Child 1994; 1: 404-408.
25. Abasi AA, Prasad AS, Ortega J, Congco E, Oberleas D. Gonadal function abnormalities in sickle cell anaemia. Studies in adult male patients. Ann Int Med 1976; 85: 601-605.