WAVELET TRANSFORM BASED FAULT DETECTION AND
CLASSIFICATION IN TRANSMISSION LINE
Sriya Chakraborty*
Shalini Singh*
Anu Bhalla*
Pallavi Saxena*
Ramesh Padarla*
ABSTRACT
This paper presents a Wavelet Transform based approach to detect and classify different
shunt faults that may occur in transmission lines. The algorithm is based mainly on
calculating the RMS values of the wavelet coefficients of current signals at both the ends of
the transmission line over a moving window length of half cycle.The current signals are
analyzed with ‘db4’ wavelet to obtain detail coefficients and compared with threshold values
to detect and classify the faults. To illustrate effectiveness of proposed technique extensive
simulation studies using PSCAD/EMTDC and MATLAB have been carried out for different
types of faults considering wide variations in fault resistances, inception angle and loading
levels. Fault data generated by PSCAD/EMTDC have been used for fault detection and
classification by a MATLAB program. Thus, the proposed technique is well suited for
implementation in digital distance protection schemes.
Keywords: Wavelet transforms, Transmission Line Protection, Threshold value,
PSCAD/EMTDC.
*Department of Electrical Engineering, College of Engineering Roorkee, Roorkee,
I. INTRODUCTION
Electromagnetic transients in power systems result from a variety of disturbances on
transmission lines, such as faults, are extremely important. It is very important to detect and
classify faults for efficient and reliable operation. There are various techniques for fault
classification. Some of the techniques are: (i) Fuzzy logic-based [1-3] (ii) Artificial Neural
Network based [4]and (iii) Wavelet Transforms based [5-8]. Although, the Fuzzy and
neural-network-based approaches have been quite successful in determining the correct fault type,
the main disadvantages of Fuzzy and ANN are; requires a considerable amount of training
effort for good performance. The wavelet transform based approaches have been quite
successful in fault detection and classification due to its ability to express faulted signal both
in frequency and time domain.
Chul-Hwan Kim, Hyun kim, et al in [5]proposed a method to detect high impedance arcing
faults in high voltage transmission lines using wavelet transforms. Joe-Air Jiang, et al [6]
have used Haar Wavelet for fault detection and faulted phase selection in transmission lines.
Shaikh Abdul Gafoor and Ramana Rao [7] used WT multi resolution approach for detection,
classification and localization of faults in the transmission line was accomplished within a
half a cycle using detail coefficients of currents at both the ends.
In this paper, Wavelet Transforms based Fault detection and classification technique has been
proposed. This method identifies all ten types of faults (e.g., a-g, b-g, c-g, a-b, b-c, c-a, a-b-g,
b-c-g, c-a-g, a-b-c/a-b-c-g) on the transmission line. Fault data is generated using
EMTDC/PSCAD [9] software. Fault data generated by EMTDC have been used for fault
classification by a MATLAB [10] programme.
II. WAVELET TRANSFORM
The wavelet transform (WT) is the versatile tool with very rich mathematical content and
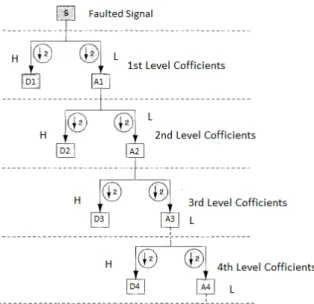
great potential for applications. The wavelet transform decomposes transients into a series of
wavelet components i.e. approximation and detail components. The resulting decomposed
signals can then be analyzed in both time and frequency domains. Hence, the wavelet
Fig. 1. Wavelet Decomposition method
An approximation contains the general trend of the original signal while a detail embodies
the high frequency contents of the original signal. Approximation and details are obtained
through a succession of convolution processes. The details and approximations of the original
signal are obtained by passing it through low-pass filters which remove high frequency
components and high-pass filters which pick out high frequency components in the signal
being analyzed as shown in the Fig. 1.
III.
FAULT
DETECTION
AND
CLASSIFICATION
STRATEGY
A. PSCAD Simulation Model
The technique has been developed on the basis of simulation studies carried out on the
transmission line model shown in Fig. 2 Using PSCAD/EMTDC software. The parameters
of the test model are given in Appendix [11].
B. Fault involving ground
The RMS values of sum of absolute value of reconstructed detail coefficients of both
receiving and sending end currents of each phase is calculated.
0 50 100 150 200 250 300 350 400
0 0.002 0.004 0.006 0.008 0.01 0.012 samples RM S v al ue AG fault Threshold
Fig. 3. Variation of RMS value of D in phase-a
0 50 100 150 200 250 300 350 400
0 0.5 1 1.5 2 2.5
3x 10
-5 samples rm s v al ue
RMS value of B-phase coefficients of AG fault
Fig. 4. Variation of RMS value of D in phase-b
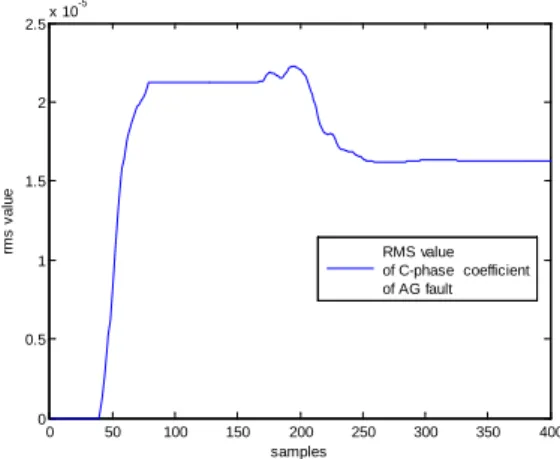
0 50 100 150 200 250 300 350 400
0 0.5 1 1.5 2 2.5x 10
-5 samples rm s v al ue RMS value of C-phase coefficient of AG fault
Fig.3, 4 and 5 shows the variation of RMS value of reconstructed detail coefficients (D) of a,
b and c phases for a-g fault. It is observed that the RMS value of faulty phase is large as
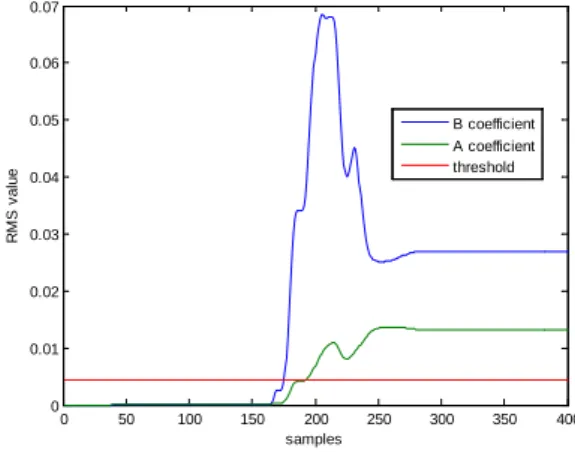
compared to those of healthy phases. Fig. 6 shows RMS value variation in phases a & b for
ab-g fault.
0 50 100 150 200 250 300 350 400
0 0.01 0.02 0.03 0.04 0.05 0.06 0.07
samples
R
M
S
v
al
ue
B coefficient A coefficient threshold
Fig. 6. Variation of RMS value of D in phases- a & b
C. Algorithm for Detection and Classification
D. Fault not involving ground
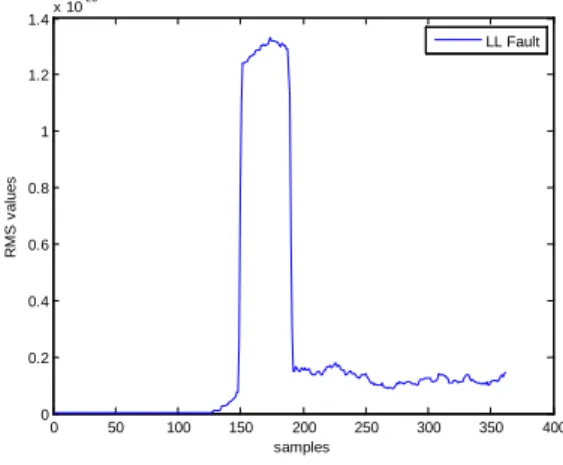
To achieve discrimination between the faults l-l and ll-g, I1 = (Ia + Ib + Ic) is calculated.
0 50 100 150 200 250 300 350 400
0 0.2 0.4 0.6 0.8 1 1.2 1.4x 10
-26 samples R M S v al ues LL Fault
Fig. 8. Variation of RMS value of I1 for ll Fault
0 50 100 150 200 250 300 350 400
0 2 4 6 8 10 12 samples R M S v al ue LLG Fault
Fig . 9. Variation of RMS value of I1 for ll-g Fault
Fig. 8 and 9 shows variation of RMS value of I1 for l-l and ll-g fault. It has been observed that
RMS value of current I1 for ll-g fault is greater than l-l fault.
IV. CONCLUSION
To test the effectiveness of the proposed fault detection and classification scheme, a large
number of fault simulation studies have been carried in test system shown in Fig. 2 using the
PSCAD/EMTDC software. The Bergeron line model based transmission line has been
represented in PSCAD/EMTDC. Wide variations in fault resistance, power angle and fault
and 0.8L, where L is the length of the line. All these locations have proved the accuracy of
the proposed technique.
V. APPENDIX
Source Data at both Sending and Receiving Ends:
Positive-sequence impedance = 1.31+ j15.0 Ω;
Zero-sequence impedance = 2.33 + j26.6 Ω;
Frequency = 50 Hz;
Transmission Line Data:
Length = 300 km;
Voltage = 400kV;
Positive-sequence impedance = 8.25 + j94.5 Ω;
Zero-sequence impedance = 82.5 + j308 Ω;
Positive-sequence capacitance = 13nF/km;
Zero-sequence capacitance = 8.5 nF/km;
REFERENCES
[1] Ferrero, S. Sangiovanni, and E. Zapitelli, “A fuzzy set approach to fault type
identification in digital relaying”, IEEE Trans. Power Delivery, vol. 10, pp. 169–175, Jan.
1995.
[2] H.Wang and W.W. L. Keerthipala, “Fuzzy neuro approach to fault classification for
transmission line protection”, IEEE Trans. Power Delivery, vol. 13, pp. 1093–1104, Oct.
1998.
[3] Mahanty, R.N. and Dutta Gupta, P.B.”A fuzzy logic based fault classification
approach using current samples only”, Int. J. Elect. Power Syst. Res.,vol. 77, pp. 501-507,
2007.
[4] R. K. Aggrawal, Q. Y. Xuan, R. W. Dunn, and A. Bennett, “A novel fault
classification technique for double-circuit line based on a combined
unsupervised/supervised neural network”, IEEE Trans. Power Delivery, vol. 14, pp.
1250–125, Oct. 1999.
[5] Chul-Hwan Kim, Hyun Kim, Young-Hun Ko, Sung-Hyun Byun, Raj K. Aggarwal,
Transmission Lines Using the Wavelet Transform", IEEE Trans. on Power Delivery,
vol.17 No.4, pp. 921-929, Oct. 2002.
[6] Joe-Air Jiang, Ping-Lin Fan, Ching-Shan Chen, Chi-Shan Yu, Jin-Yi Sheu, "A Fault
Detection and Faulted Phase Selection Approach for Transmission Lines with Haar
Wavelet Transform", Transmission and Distribution Conference and Exposition 2003,
IEEE PES, 7-12, vol. 1, pp.285-289, Sep. 2003.
[7] Shaik Abdul Gafoor, P.V. Ramana Rao, “wavelet based fault detection, classification
and location in transmission lines”, First International power Energy Conference PECon,
Malaysia, Nov. 2006.
[8] K. M. Silva, B. A. Souza and N. S. D. Brito, “Fault Detection and Classification in
Transmission Lines Based on Wavelet Transform and ANN”, IEEE Trans. Power
Delivery, vol. 21, No. 4, October 2006.
[9] PSCAD/EMTDC Version 3.08, Manitoba HVDC Research Center, Winnipeg, MB,
Canada.
[10] MATLAB User’s Guide, The Math Works Inc., Natick, MA.
[11] Biswarup Das and J. Vital Reddy, “Fuzzy-logic based fault classification scheme for