Formation of a mixed ordered termination on the surface of LaAlO
3(001)
A. J. H. van der Torren, S. J. van der Molen, and J. Aarts
Huygens - Kamerlingh Onnes Laboratorium, Leiden University, Niels Bohrweg 2, 2300 RA Leiden, The Netherlands (Received 8 February 2015; revised manuscript received 26 May 2015; published 22 June 2015)
We have investigated the surface termination of LaAlO3(001) at elevated temperatures by low-energy electron
microscopy. The terminating layer can be LaO or AlO2. The LaO surface shows a
√
5×√5 R26 reconstruction which can be used as a signature for the LaO termination, while the AlO2termination is unreconstructed. We find
that heating of as-delivered substrates in vacuum or heating substrates which were previously annealed in air or oxygen can lead to a reconstructed surface as observed in diffraction. However, the real-space image shows that the reconstructed areas only cover about one-third of the surface and that the termination is actually an ordered mixture of the reconstructed LaO and the unreconstructed AlO2 terminations. This conclusion is supported
by data from atomic force microscopy. We also demonstrate how the disordered mixture of both terminations changes to large LaO islands in the middle of the AlO2terraces upon heating.
DOI:10.1103/PhysRevB.91.245426 PACS number(s): 68.35.B−,68.37.Nq,68.37.Ps
I. INTRODUCTION
Much effort is currently directed to investigating the prop-erties of interfaces between perovskite oxides, in particular those of theABO3type, with particular emphasis on the
two-dimensional electron gas (2-DEG) which is formed between the insulators SrTiO3(STO) and LaAlO3(LAO) [1]. Of prime
importance here is control over and knowledge of the atomic termination layer of the surface on which the interface is prepared. For instance, in order to form the 2-DEG, it is well known that the STO surface has to be terminated with a TiO2 layer. Recipes exist for the fabrication of different
termination layers on the various substrates which are used in oxide research. Of recent interest are endeavors to fabricate mixed ordered terminations, which allow for the possibility to perform selective area growth.
In this study, we focus on the surface of LaAlO3(001),
which can beA-site terminated with a layer of LaO orB-site terminated with a layer of AlO2. In the literature, contradictory
reports can be found on the issue of fabricating singly terminated surfaces. Kimet al.[2] use an 1100◦C annealing step in oxygen and find a predominantly AlO2 termination,
while Gunnarssonet al. [3] come to the conclusion that the surface is doubly terminated when only annealed in oxygen. They report that etching the surface with HCl, followed by annealing in oxygen at the relatively low temperature of 800◦C leads to AlO2termination [3]. Early work using ion scattering
experiments [4] and photoemission [5] suggested that starting from aB-site termination, a completeA-site termination can also be obtained even at 250◦C, but careful measurements of the temperature dependence of the surface structure using synchrotron x-ray radiation found no evidence for such a conversion. Rather, it was shown that the structural relaxation which occurs in the top layers at elevated temperatures is enough to mimic an A-site termination in scattering exper-iments [6]. This may also explain why an LaO-terminated surface was reported after annealing at 700◦C in UHV using He atom scattering [7], while similar annealing was found to yield an AlO2surface with 10 nm LaO islands in experiments
involving scanning tunneling microscopy [8].
Extensive surface x-ray measurements were performed by Lanieret al.on surfaces which were prepared by annealing an
LaAlO3substrate between 1100◦C and 1500◦C in air [9]. Such
surfaces show a clear√5×√5 R26 (RT5) reconstruction, and it was concluded that it is the LaO layer which reconstructs, yielding a surface with one La vacancy per surface unit cell and stoichiometry (VLa4O5) (with V the vacancy). In this
study, the question of the amount of LaO coverage was not addressed. We are not aware of a study of the occurrence of reconstructions on the AlO2-terminated surface, and as a
working hypothesis we assume that it does not reconstruct. Here we use low-energy electron microscopy (LEEM) to study the behavior of the LaAlO3surface at high temperatures,
an issue which is both relevant for surface preparation and for growth. With the LEEM technique, we are able to discern different terminations in two ways. One is through the diffraction pattern when different reconstructions occur on the two terminations. By using apertures in the outgoing beams, LEEM also allows us to make a real-space image of the occurrence of different reconstructions with high lateral resolution. The other way is to measure the intensity of the diffraction spots (I), in particular of the specular beam, as a function of the electron energy (V).
In this way, we find for LaAlO3[001] that surfaces can
be prepared with a single termination of AlO2, but that
high-temperature treatments, presumably yielding a recon-structed LaO surface, actually lead to spatially separated areas with and without reconstruction and with differentI V
characteristics. Complementing the LEEM data with room-temperature atomic force microscopy (AFM), we conclude that the annealing process leads to a mixed but ordered termination of both LaO and AlO2, with the LaO termination
occurring predominantly in the middle of terraces on the otherwise atomically flat surface.
II. EXPERIMENT
and the sample, a decelerating field is applied, which is used to accurately tune the landing energy of the electrons on the sample in the range from 0 to 100 eV. The zero landing energy is influenced by the difference between sample and gun voltage supply, the work function of the gun filament and the work function of the sample. Determining the correct value for the zero of energy can, in principle, be done with an inaccuracy of less than 0.1 eV, but in this work we did not pay special attention to the optimization, leading to sample-to-sample variations of the order of 1 eV. At the sample, the electrons are diffracted and accelerated again towards the objective lens. After passing the objective lens, they are deflected into the projection column and pass through a second magnetic prism deflecting the beam to an electrostatic mirror, a procedure which corrects for chromatic aberration [10]. Coming back from the mirror, the electrons reenter the projection column and form a real-space or reciprocal-space image on the channel plate detector.
With this system, various imaging modes can be used. In the first place, low-energy electron diffraction (LEED) can be used to study the structure of the surface. Lateral variations in the structure can be imaged by placing an aperture in the diffraction plane around one of the diffraction spots. By changing the projector lenses to produce a real-space image, we can then study which areas of the sample contribute to that diffraction condition. This is called dark-field imaging. For the so-called bright-field mode, the aperture is placed around the zeroth-order LEED spot. Here we can still have contrast be-tween structures with different reflection intensities (given by the structure factor) at a given electron energy. By measuring the intensity of the diffracted beam as a function of electron energy at the sample, i.e., the so-calledI V curve, a specific signature of the surface can be obtained [14–16]. Since theI V
curve of a surface is determined by the precise positions of the atoms, contrast between reconstructed and nonreconstructed areas can also be found at certain energies in the bright-field mode. To determine which areas in the bright field belong to which reconstruction, the dark-field images are used.
Experiments in the LEEM are performed in a vacuum of 10−9 mbar, and the sample can be continuously heated up
to 1300◦C. Images are acquired with an acquisition time of 250 ms (four images per second) by a 1280×1024 pixel CCD camera behind a channel plate detector. Switching within less than a second between different magnifications and image modes results in fast real-time imaging of changes in the surface morphology.
Atomic force microscopy was routinely used to characterize the surface topography. A special experiment was performed on two samples to compare the information of LEEM and AFM on the same area. For this, trenches were etched in the surface using electron beam lithography and Ar-ion etching. These trenches served as markers both in the light microscope attached to the AFM and in the photoemission mode of the LEEM, both of which have a field of view of a few hundred micrometers.
Commercial substrates, polished on one side, were obtained from crystal GmbH in three different batches. For experiments where samples were annealed in air, the substrates were first loaded into a furnace and heated up to 1150◦C. After anneal-ing, they were loaded into the LEEM. Other samples were
directly loaded into the LEEM and annealed in vacuum. The temperature in the LEEM was measured by a pyrometer assuming an emissivity of 0.9. During imaging, samples were kept at at least 400◦C to avoid charging of the insulating substrates.
III. RESULTS
An issue which surfaced in the research described here, but which may well be more general, was that the as-received samples did not all behave in exactly the same manner. In the first set of experiments, a diffraction pattern pointing to a surface reconstruction could be directly obtained by annealing in vacuum at high temperatures, but several attempts to make an AlO2-terminated surface by annealing in oxygen failed.
With a different batch of substrates, this (B-site) termination could be prepared, but obtaining the (A-site) reconstructed surface is only possible for a part of the surface. This will be detailed below.
A. Reconstructed surfaces
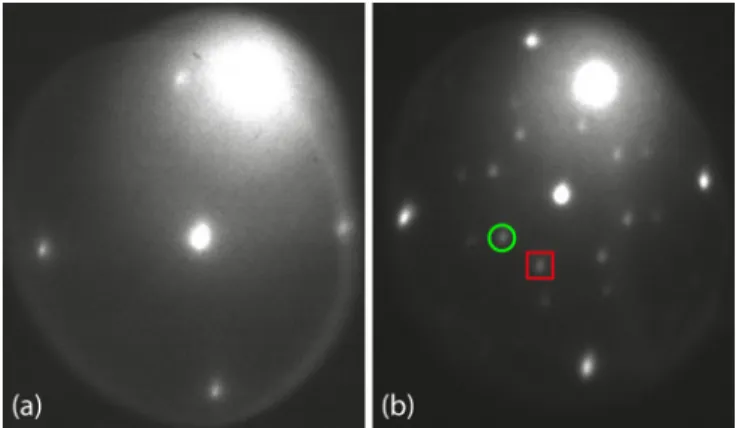
In Fig. 1(a), we show the diffraction pattern of an as-received sample, taken at 875◦C, which shows an unrecon-structed surface. The sample was then annealed in situ for about seven hours at a temperature of 1100◦C and cooled to 910◦C. This resulted in the diffraction pattern given in Fig.1(b). It has four extra spots deriving from a rotated square surface net indicative of the RT5 reconstruction. Moreover, as indicated in the figure, the extra spots are doubled due to the fact that there are two equivalent rotations of the reconstruction, and both types are formed as domains on the surface. Figure2 shows the I V curve of the (0,0) spot for the surface before and after annealing. They are quite similar, although the curve after annealing shows a more pronounced maximum at 18 V and an additional peak at 22 V.
With the two equivalent fractional order patterns in the LEED pattern, the dark-field mode can be used to image the spatial extent of the two reconstructed domains separately. This is shown in Fig.3(a), where the two RT5 domains are color
FIG. 2. (Color online) LEED-I V curves taken from the (0,0) spots of the LEED patterns shown in Fig.1, before and after annealing the sample.
coded in red and green. Interestingly, the reconstruction does not fully cover the surface. Rather it forms in stripelike patterns with a more or less random variation of the two rotations, covering no more than about one-third of the surface. The larger fraction of the surface is therefore not reconstructed. The reconstruction can also be imaged in bright field by choosing the appropriate energy, as shown in Fig.3(b)taken at 17.6 eV. The two types of rotation are now not distinguishable, but otherwise the image faithfully reproduces the areas where the reconstruction is present (bright) or absent (dark). By taking bright-field images at different electron energies, it is also possible to generateI V curves at all positions on the surface. Figure4 shows suchI V curves of the (0,0) beam, taken on either a reconstructed (bright) or unreconstructed (dark) area. They are quite different. The unreconstructed area shows peaks around 5, 9, 12, and 18 V, plus a small maximum around 25 V. The one from a reconstructed area shows peaks around 10 and 18 V and generally shows a higher intensity, which leads to the contrast seen in Fig.3(b)taken at 17.6 V. Comparing these data to theI V curves in Fig.2 emphasizes thatI V curves taken on surfaces with different structures are of limited value. In particular, the curve after annealing represents some weighted average of the two curves in Fig.3, but cannot be used as the characteristic of either one of the surface terminations.
Although difficult to see, in Fig. 3(b)there are also thin black lines visible in the bright-field image, which are related
FIG. 3. (Color online) (a) Multi-dark-field image and (b) bright-field image of LaAlO3 after annealing above 1070◦C. The images
were taken at 15 and 17.6 eV, respectively, at a temperature of 890◦C. The dark-field image consists of the two images of the distinct RT5 domains, overlaid in green and red.
FIG. 4. (Color online) I V curves taken from a selected area of the zero-order beam and taken from the reconstructed (bright) and unreconstructed (dark) areas on the surface. A circle containing 1264 pixels (equivalent to a diameter of about 100 nm) within a bright-field image is averaged for every energy. Figure3(b)is one of the bright-field images out of this energy series.
to and localized at step edges on the substrate. They can be seen to bend over roughly 90◦in the field of view, with the stripelike domains following the direction of the steps. The relation be-tween steps and domains was investigated further. For this, we used a sample with Ar-ion etched markers as described in the previous section. Figure5(a)shows a bright-field image taken at 15.2 eV, an energy at which the step contrast is enhanced. Two steps are visible, indicated by red arrows, and it is seen that the reconstructed area lies in the middle of the terrace, which is defined by the two steps. Figure5(b)shows an AFM image madeon the same area. The steps are sharp and clearly visible, but also the reconstructed area is visible in the AFM image, which therefore appears to be of different height. The cross section from the AFM image, given in Fig.5(d), shows that the steps around the reconstruction are about 0.35 nm high, corresponding to a full LaAlO3unit cell. The steps bordering
the reconstruction are smaller, only about 0.1 nm, and the reconstructed areas lie deeper than the terrace on which they re-side. The smaller steps can also be observed in the bright-field
FIG. 5. (Color online) (a) Bright-field image of LaAlO3 at
FIG. 6. (Color online) (a) Bright-field image at 9.2 eV and (b) dark-field images at 14 eV of an LaAlO3 sample annealed in air;
(c) AFM image of the same area. According to the AFM image, the reconstructed areas clearly lie lower than the surrounding terraces. (d) Height profile along the cross section drawn in (c). Both half unit-cell steps and full unit-cell steps are present. The half unit-cell steps correspond to the reconstructed areas, while the full unit-cell steps are between two unreconstructed terraces.
image at the appropriate energy. Figure5(c)shows an image taken at 26.8 eV. This energy is chosen such that there is no contrast from the reconstruction, but there is (phase) contrast to observe the steps. The middle red arrow shows the right-hand step in the earlier image, but four extra steps have appeared (outer blue arrows) which border the reconstructed areas.
Most experiments in the literature reporting the occurrence of the RT5 reconstruction and/or a mixed termination were performed by extensive annealing of the LaAlO3 sample in
air or oxygen, rather than in UHV as described above. We therefore performed annealing experiments in air on samples from the third batch. One sample was annealed for ten hours in a tube furnace at 1150◦C. Figure6(a)shows the resulting LEEM and AFM images, which are very comparable to the UHV annealed samples. The atomically flat patches in the AFM image are now somewhat larger, which makes the determination of the height variations easier. As before, it is seen that the reconstructed area lies deeper than the surrounding terrace, but the stripes now tend to lie closer to the steps rather than in the middle of the terraces. The steps between the reconstructed and unreconstructed areas are clearly of half unit-cell height. This was less clear in Fig.5, which could be caused by incomplete LaO termination. Looking closely at Fig.5(a)again reveals numerous small dark spots within the bright area. Possibly the LaO termination is not fully developed and small AlO2islands still remain. Averaging
such AlO2areas with the LaO areas might result in an AFM
height profile with less than half unit-cell steps.
B. The singly terminated surface
To further understand the difference between the recon-structed and unreconrecon-structed areas, we prepared a sample with a single terminated surface. As described in Sec. I, how to prepare a single AlO2termination is not completely obvious.
FIG. 7. (Color online) (a) AFM image of a singly AlO2
-terminated sample; (b) height profile taken along the white line drawn in (a). Only full unit-cell steps can be seen, confirming that the sample is singly terminated. Inset: A bright-field image of this surface, taken at 850◦C and 15.2 eV. The width of the image is 1μm.
Samples from two batches were annealed in various ways, i.e., in oxygen at atmospheric pressure as well as in air and vacuum. Some were etched in HCl, as reported in Ref. [3], while others were directly annealed, as reported by Ref. [17]. None of them led to the desired unit-cell-step and terrace structure as reported, e.g., in Refs. [3,17]. In a third batch, we succeeded using a two-step process. The sample was first annealed at 800◦C in UHV, followed by exposure to air after cooling down to room temperature. A subsequent anneal at 1000◦C in UHV resulted in an unreconstructed surface. An AFM image of this surface is presented in Fig.7(a). Single steps with a height of 0.4 nm are visible [see Fig.7(b)], and equally important, no half-size steps were found as in Fig.5(d). A bright-field image, taken at 850◦C and 15.2 eV, showed terraces of the same size as in AFM (see inset, Fig.7). All data indicate that the surface is singly terminated, and presumably by AlO2.
A LEED-I V curve taken on this surface is shown in Fig.8. Comparison of thisI V curve with the one given in Fig.4of a dark (unreconstructed) area on the reconstructed sample shows them to be virtually identical. From this, we conclude that the
FIG. 9. Bright-field images of a LaAlO3surface. The images are
taken during annealing at 935, 1090, 1155, and 1170◦C, respectively. The landing energy of the electrons is around 16.5 eV.
unreconstructed part of such a singly terminated surface is also AlO2terminated.
C. On the formation of the mixed ordered termination Being able to prepare and image the partial RT5 reconstruc-tion and LaO terminareconstruc-tion by UHV annealing as discussed in Sec. III Aoffers a unique opportunity to follow the process which leads to the mixed ordered termination. The first signs of the RT5 LEED pattern appear at a temperature of 930◦C, the lowest temperature where we can probe the mixed ordered termination. Figure 9shows four bright-field images during the annealing process, taken at 935, 1090, 1155, and 1170◦C at an energy around 16.5 V. The first image shows a grainy structure which starts to form small stripes and spots in the second image. When increasing the temperature, the small spots form larger continuous areas. In the last image, the small dots have mostly disappeared and the bright areas form wide and continuous stripes. Looking back at the first image, it suggests that there the reconstructed areas are very small, leading to relatively little coherent scattering. By repeating the experiment with different time scales, we find no real differences. Going to 1200◦C in a few seconds or in an hour does not change the result. Also keeping the sample close to 1200◦C for seven hours did not change the morphology which formed initially.
IV. DISCUSSION
Taking the data together, the first point to make is that we found variety in the way that samples from different batches behaved. Nevertheless, several clear conclusions can be drawn. A singly terminated AlO2surface can be prepared, although the
procedure may vary. Without being complete, in the literature, a high-temperature (1000◦C) anneal in flowing oxygen was used [2], a somewhat lower (800◦C) flowing oxygen anneal preceded by a cleaning step in HCl was used [3], or a 900◦C anneal at very low oxygen pressure (10−6mbar) was used [17].
This already shows that the recipe is not unique. We did not find single termination by these methods, but succeeded through a two-step process, i.e., an 800◦C anneal in UHV, followed by exposure to air and a 1000◦C anneal in UHV. This suggests that the process for preparing single termination depends on the history of the sample, possibly even including the polishing process. A successful procedure leads, in our case, to an atomically flat surface with only unit-cell steps of 0.4 nm height. This AlO2-terminated surface is unreconstructed and
has a well-defined and unique LEED-I V signature.
Using the occurrence of the RT5 reconstruction as a signature for LaO termination, we come to the conclusion that
a singly terminated LaO surface cannot be prepared. Preparing a reconstructed surface either by annealing in UHV or in air, we find from imaging by LEEM (both in bright field and in dark field) that the reconstructed areas form in stripelike domains. From the step contrast, it is seen that the stripes tend to be found in the middle of terraces, and the reconstructed LaO stripes have a LEED-I V signature which is different from the AlO2 surface. Moreover, the unreconstructed part of the
terraces do show the AlO2signature. From the AFM data, we
find that the reconstructed areas lielowerthan the surrounding terraces, with a height difference of about half a unit cell. Our results indicate that the reconstruction starts forming at 930◦C when the RT5 LEED spots become visible and small islands of reconstructed surface are seen to form. This is roughly consistent with the results of Schmidtet al.[8], who find a mixture of small LaO islands and AlO2islands spread over the
surface after annealing at 670◦C. The presence of small islands might also be the explanation of the presence of steps less than half a unit cell in Fig. 5. In Fig. 5(a), the bright area still has small black speckles, indicating the LaO islands are not fully grown together and small AlO2islands are present within
the LaO area. These differences are not resolved by the AFM and are averaged in the picture, resulting in the small steps. Finally, we note the fact that the LaO-based areas lie deeper than the AlO2 surface. This suggests a scenario in which the
starting surface has a mixed termination with AlO2islands on
top. Increasing the temperature mobilizes the islands which seek step edges to form closed AlO2layers not fully covering
the surface. At the same time, the lower-lying exposed LaO areas lose lanthanum and form the RT5 reconstruction. A fully singly terminated AlO2 surface, on the other hand, is stable
even at high temperatures.
V. SUMMARY
We investigated the surface of LaAlO3[001] single
crys-tals by low-energy electron microscopy and atomic force microscopy. Annealing from 930◦C to 1150◦C in UHV as well as in air, we found a mixed ordered surface termination of unreconstructed AlO2 and reconstructed (
√
5×√5 R26) LaO, with the fraction of reconstructed LaO being about one-third. We could follow the formation of the mixed ordered termination with temperature from a mixture of small islands of either kind to stripes of LaO in the middle of terraces of AlO2, with the stripes lying lower than the
surrounding terraces. By preparing a surface with a single AlO2termination, we also demonstrated the difference inI V
characteristics for the unreconstructed AlO2 termination and
the reconstructed LaO termination.
ACKNOWLEDGMENTS
[1] O. Ohtomo and H. Hwang,Nature (London)427,423(2004). [2] Dong-Wook Kim, Dae-Ho Kim, Bo-Soo Kang, T. W. Noh,
D. R. Lee, and K.-B. Lee,Appl. Phys. Lett.74,2176(1999). [3] R. Gunnarsson, A. S. Kalabukhov, and D. Winkler,Surf. Sci.
603,151(2009).
[4] J. Yao, P. B. Merrill, S. S. Perry, D. Marton, and J. W. Rabalais, J. Chem. Phys.108,1645(1998).
[5] P. A. W. van der Heide and J. W. Rabalais,Chem. Phys. Lett. 297,350(1998).
[6] R. J. Francis, S. C. Moss, and A. J. Jacobson,Phys. Rev. B64, 235425(2001).
[7] H. Kawanowa, H. Ozawa, M. Ohtsuki, Y. Gotoh, and R. Souda, Surf. Sci.506,87(2002).
[8] D. A. Schmidt, Taisuke Ohta, Q. Yu, and M. A. Olmstead,J. Appl. Phys.99,113521(2006).
[9] C. H. Lanier, J. M. Rondinelli, B. Deng, R. Kilaas, K. R. Poeppelmeier, and L. D. Marks,Phys. Rev. Lett.98,086102 (2007).
[10] R. M. Tromp, J. B. Hannon, A. W. Ellis, W. Wan, A. Berghaus, and O. Schaff,Ultramicroscopy110,852(2010).
[11] S. M. Schramm, J. Kautz, A. Berghaus, O. Schaff, R. M. Tromp, and S. J. van der Molen,IBM J. Res. Dev.55,1(2011). [12] S. M. Schramm, A. B. Pang, M. S. Altman, and R. M. Tromp,
Ultramicroscopy115,88(2012).
[13] R. M. Tromp, J. B. Hannon, W. Wan, A. Berghaus, and O. Schaff, Ultramicroscopy127,25(2013).
[14] J. B. Hannon, J. Sun, K. Pohl, and G. L. Kellogg,Phys. Rev. Lett.96,246103(2006).
[15] A. K. Schmid, W. Schwieg, C. S. Rastomjee, B. Rausenberger, W. Engel, E. Zeitler, and A. M. Bradshaw,Surf. Sci.331–333
Part A,225(1995).
[16] J. I. Flege and E. E. Krasovskii, Phys. Status Solidi 8, 463 (2014).