Acta Cryst.(2001). E57, o947±o949 DOI: 10.1107/S1600536801014891 Davies and Bond C9H7N
o947
organic papers
Acta Crystallographica Section E Structure Reports
Online
ISSN 1600-5368
Quinoline
John E. Davies and Andrew D. Bond*
Department of Chemistry, University of Cambridge, Lensfield Road, Cambridge CB2 1EW, England
Correspondence e-mail: [email protected]
Key indicators Single-crystal X-ray study
T= 150 K
Mean(C±C) = 0.002 AÊ
Rfactor = 0.045
wRfactor = 0.124
Data-to-parameter ratio = 13.3
For details of how these key indicators were automatically derived from the article, see http://journals.iucr.org/e.
#2001 International Union of Crystallography Printed in Great Britain ± all rights reserved
The crystal structure of quinoline, C9H7N, has been
deter-mined at 150 (2) K. In space groupP21/c, the asymmetric unit
comprises two independent molecules. Molecules are linked
viaCÐH N interactions into two orthogonal sets of chains which are linkedviaan extensive network of edge-to-face CÐ H interactions.
Comment
Although the structure of naphthalene was one of the ®rst determined by X-ray crystallography (Bragg, 1922), this is the ®rst report of the structure of quinoline. This long delay may be attributed to the dif®culty of obtaining a suitable single crystal of quinoline. This work forms part of a study devoted to improving the techniques for determining the crystal structures of substances which are liquids at room tempera-ture [see, for example, Bondet al.(2001)].
Quinoline, (I), crystallizes in the space groupP21/cwith the
asymmetric unit comprising two independent molecules (denotedAandB, Fig. 1). Molecules of typeAare linkedvia
CÐH N interactions into chains running parallel to the c
direction [H6A N1Ai = 2.89 (2) AÊ, C6AÐH6A N1Ai =
141.1 (1); symmetry code: (i) x, 1
2ÿy, 12+z]. Molecules of
typeBare also linkedviaCÐH N interactions into chains running parallel to thebdirection [H3B N1Bii= 2.68 (2) AÊ,
C3BÐH3B N1Bii = 171.1 (1); symmetry code: (ii) 2ÿx, 1
2+y,32ÿz]. Thus, there exist in (I) two orthogonal sets of CÐ
H N hydrogen-bonded chains. Between these chains, an extensive network of edge-to-face CÐH interactions exists (Desiraju & Steiner, 1999). This network may be visualized most conveniently by considering that each edge of a molecule of (I) exposed in a typeBchain is `capped' by a molecule of typeA, and that these capped chains interlock to form two-dimensional layers parallel to (101) (Fig. 2). The layers may then be considered to stack in an ABCABC
arrangement perpendicular to (101) with the CÐH N interactions between typeAmolecules linking the layers (Fig. 3).
Experimental
The sample (98%) was obtained from the Aldrich Company and used without further puri®cation. The crystal was grown with dif®culty in a 0.3 mm glass capillary tube, obtained from the PANTAK company
organic papers
o948
Davies and Bond C9H7N Acta Cryst.(2001). E57, o947±o949(PANTAK Company, Unit 30, The Robert Corl Industrial Estate, Britten Road, Reading, England), at 245 K (a temperature only slightly less than the melting point of the solid in the capillary tube). With the axis of the capillary parallel to the'axis and horizontal on the instrument, the crystal was eventually grown by moving a plug of solid material up and down the tube (the movement being controlled
with the standard Z (height) adjustment of the goniometer head). The goniometer head was a Nonius model 1516.916 X±Y±Z (Nonius BV, Delft, The Netherlands); this head is particularly well suited to the experiment described in this paper since it has an especially wide Z translation (8 mm). This method is effectively zone re®nement, similar to the industrial methods used to grow large single crystals of silicon for the electronics industry. The ®ne temperature control necessary for the successful growth of the crystal was provided by an Oxford Cryosystems Cryostream (Oxford Cryosystems, Lower Road, Long Hanborough, Oxford, England).
Crystal data C9H7N
Mr= 129.16
Monoclinic,P21/c
a= 9.9226 (5) AÊ
b= 10.8473 (7) AÊ
c= 13.3665 (7) AÊ
= 106.578 (3)
V= 1378.88 (13) AÊ3
Z= 8
Dx= 1.244 Mg mÿ3
MoKradiation Cell parameters from 6740
re¯ections
= 1.0±27.5 = 0.07 mmÿ1
T= 150 (2) K Cylinder, colourless 0.26 mm (radius) Data collection
Nonius KappaCCD diffractometer Thin-slice!and'scans 4851 measured re¯ections 3055 independent re¯ections 2337 re¯ections withI> 2(I)
Rint= 0.018 max= 27.4
h=ÿ12!12
k=ÿ12!14
l=ÿ17!17 Re®nement
Re®nement onF2
R[F2> 2(F2)] = 0.045
wR(F2) = 0.124
S= 1.04 3055 re¯ections 230 parameters
All H-atom parameters re®ned
w= 1/[2(F
o2) + (0.0556P)2
+ 0.2728P]
whereP= (Fo2+ 2Fc2)/3
(/)max= 0.002
max= 0.18 e AÊÿ3
min=ÿ0.18 e AÊÿ3
The positions of all H atoms were allowed to re®ne independently. Pairs of chemically equivalent H atoms in the two independent molecules were assigned common, isotropic displacement parameters (7 variables in total).
Data collection:COLLECT(Nonius, 1998); cell re®nement:HKL SCALEPACK(Otwinowski & Minor, 1997); data reduction: HKL DENZO (Otwinowski & Minor, 1997) and SCALEPACK; program(s) used to solve structure: SHELXS97 (Sheldrick, 1997);
Figure 3
Projection of (I) on to (010) showing layers stacked in anABCABC arrangement. CÐH N interactions between typeAmolecules link the layers and are shown as dotted lines (CAMERON; Watkinet al., 1996).
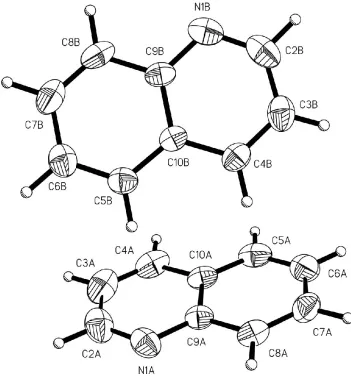
Figure 1
The asymmetric unit in (I) showing displacement ellipsoids at the 50% probability level (XP; Sheldrick, 1993). The two independent molecules adopt a geometry indicative of an edge-to-face CÐH interaction.
Figure 2
program(s) used to re®ne structure:SHELXL97 (Sheldrick, 1997); software used to prepare material for publication:SHELXL97.
We thank the EPSRC for ®nancial assistance towards the purchase of the Nonius CCD diffractometer.
References
Bond, A. D., Davies, J. E., Grif®ths, J. & Rawson, J. R. (2001).Acta Cryst.E57, o231±o233.
Bragg, W. H. (1922).Proc. Phys. Soc.(London),35, 167.
Desiraju, G. R. & Steiner, T. (1999).The Weak Hydrogen Bond In Structural Chemistry and Biology. New York: Oxford University Press.
Nonius (1998).COLLECT. Nonius BV, Delft, The Netherlands.
Otwinowski, Z. & Minor, W. (1997). HKL DENZO and SCALEPACK. University of Texas, Southwestern Medical Center at Dallas, USA. Sheldrick, G. M. (1993).XP. University of GoÈttingen, Germany.
Sheldrick, G. M. (1997). SHELXL97 and SHELXS97. University of GoÈttingen, Germany.
Watkin, D. J., Prout, C. K. & Pearce, L. J. (1996).CAMERON. Chemical Crystallography Laboratory, University of Oxford, England.
Acta Cryst.(2001). E57, o947±o949 Davies and Bond C9H7N
o949
supporting information
sup-1
Acta Cryst. (2001). E57, o947–o949
supporting information
Acta Cryst. (2001). E57, o947–o949 [doi:10.1107/S1600536801014891]
Quinoline
John E. Davies and Andrew D. Bond
S1. Comment
Although the structure of naphthalene was one of the first determined by X-ray crystallography (Bragg, 1922), this is the
first report of the structure of quinoline. This long delay may be attributed to the difficulty of obtaining a suitable
single-crystal of quinoline. This work forms part of a study devoted to improving the techniques for determining the single-crystal
structures of substances which are liquids at room temperature [see, for example, Bond et al. (2001)].
Quinoline, (I), crystallizes in the space group P21/c with the asymmetric unit comprising two independent molecules
(denoted A and B, Fig. 1). Molecules of type A are linked via C—H···N interactions into chains running parallel to the c
direction [H6A···N1Ai = 2.89 (2) Å, C6A—H6A···N1Ai = 141.1 (1)°; symmetry code: (i) x, 0.5 - y, 0.5 + z]. Molecules of
type B are also linked via C—H···N interactions into chains running parallel to the b direction [H3B···N1Bii = 2.68 (2) Å,
C3B—H3B···N1Bii = 171.1 (1)°; symmetry code: (ii) 2 - x, 0.5 + y, 1.5 - z]. Thus, there exists in (I) two orthogonal sets
of C—H···N hydrogen-bonded chains. Between these chains, an extensive network of edge-to-face C—H···π interactions
exists (Desiraju & Steiner, 1999). This network may be visualized most conveniently by considering that each edge of a
molecule of (I) exposed in a type B chain is `capped′ by a molecule of type A, and that these capped chains interlock to
form two-dimensional layers parallel to (101) (Fig. 2). The layers may then be considered to stack in an ABCABC
arrangement perpendicular to (101) with the C—H···N interactions between type A molecules linking the layers (Fig. 3).
S2. Experimental
The sample (98%) was obtained from the Aldrich Company and used without further purification. The crystal was grown
with difficulty in a 0.3 mm glass capillary tube, obtained from the PANTAK company (PANTAK Company, Unit 30, The
Robert Corl Industrial Estate, Britten Road, Reading, England), at 245 K (a temperature only slightly less than the
melting point of the solid in the capillary tube). With the axis of the capillary parallel to the phi axis and horizontal on the
instrument, the crystal was eventually grown by moving a plug of solid material up and down the tube (the movement
being controlled with the standard Z (height) adjustment of the goniometer head). The goniometer head was a Nonius
model 1516.916 X—Y—Z (Nonius BV, Delft, The Netherlands); this head is particularly well suited to the experiment
described in this paper since it has an especially wide Z translation (8 mm). This method is effectively zone refinement,
similar to the industrial methods used to grow large single crystals of silicon for the electronics industry. The fine
temperature control necessary for the successful growth of the crystal was provided by an Oxford Cryosystems
Cryostream (Oxford Cryosystems, Lower Road, Long Hanborough, Oxford, England).
S3. Refinement
The positions of all H atoms were allowed to refine independently. Pairs of chemically equivalent H atoms in the two
supporting information
sup-2
[image:5.610.128.479.70.451.2]Acta Cryst. (2001). E57, o947–o949
Figure 1
The asymmetric unit in (I) showing displacement ellipsoids at the 50% probability level (XP; Sheldrick, 1993). The two
supporting information
sup-3
[image:6.610.132.482.73.343.2]Acta Cryst. (2001). E57, o947–o949
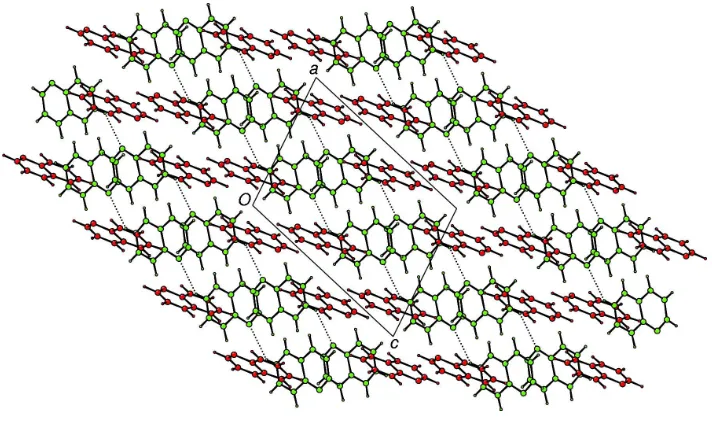
Figure 2
Projection of (I) onto (101) showing type B molecules (coloured red) linked by C—H···N interactions into chains capped
at each exposed edge by type A molecules (coloured green). Adjacent chains interlock to form two-dimensional sheets.
Edge-to-face C—H···π interactions are shown as dotted lines only between the molecules at the edge of each chain
(interactions between chains are not drawn for the purposes of clarity) (CAMERON; Watkin et al., 1996).
Figure 3
Projection of (I) onto (010) showing layers stacked in an ABCABC arrangement. C—H···N interactions between type A
[image:6.610.128.484.425.636.2]supporting information
sup-4
Acta Cryst. (2001). E57, o947–o949
Quinoline
Crystal data
C9H7N Mr = 129.16
Monoclinic, P21/c a = 9.9226 (5) Å b = 10.8473 (7) Å c = 13.3665 (7) Å β = 106.578 (3)° V = 1378.88 (13) Å3 Z = 8
F(000) = 544
Dx = 1.244 Mg m−3
Melting point = 257–258 K Mo Kα radiation, λ = 0.7107 Å Cell parameters from 6740 reflections θ = 1.0–27.5°
µ = 0.07 mm−1 T = 150 K
Cylinder, colourless 0.26 mm (radius)
Data collection
Nonius KappaCCD diffractometer
Radiation source: fine-focus sealed tube Thin–slice ω and φ scans
4851 measured reflections 3055 independent reflections
2337 reflections with I > 2σ(I) Rint = 0.018
θmax = 27.4°, θmin = 3.6° h = −12→12
k = −12→14 l = −17→17
Refinement
Refinement on F2 Least-squares matrix: full R[F2 > 2σ(F2)] = 0.045 wR(F2) = 0.124 S = 1.04 3055 reflections 230 parameters 0 restraints
Primary atom site location: structure-invariant direct methods
Secondary atom site location: difference Fourier map
Hydrogen site location: difference Fourier map All H-atom parameters refined
w = 1/[σ2(Fo2) + (0.0556P)2 + 0.2728P] where P = (Fo2 + 2Fc2)/3
(Δ/σ)max = 0.002 Δρmax = 0.18 e Å−3 Δρmin = −0.18 e Å−3
Special details
Experimental. Grown in a 0.30 mm glass capillary tube at 245 K
Geometry. All e.s.d.'s (except the e.s.d. in the dihedral angle between two l.s. planes) are estimated using the full covariance matrix. The cell e.s.d.'s are taken into account individually in the estimation of e.s.d.'s in distances, angles and torsion angles; correlations between e.s.d.'s in cell parameters are only used when they are defined by crystal symmetry. An approximate (isotropic) treatment of cell e.s.d.'s is used for estimating e.s.d.'s involving l.s. planes.
Refinement. Refinement of F2 against ALL reflections. The weighted R-factor wR and goodness of fit S are based on F2, conventional R-factors R are based on F, with F set to zero for negative F2. The threshold expression of F2 > σ(F2) is used only for calculating R-factors(gt) etc. and is not relevant to the choice of reflections for refinement. R-factors based on F2 are statistically about twice as large as those based on F, and R- factors based on ALL data will be even larger.
Fractional atomic coordinates and isotropic or equivalent isotropic displacement parameters (Å2)
x y z Uiso*/Ueq
N1A 0.65225 (13) 0.07533 (12) 0.23904 (9) 0.0452 (3)
C2A 0.54448 (17) −0.00110 (16) 0.21851 (13) 0.0549 (4)
H2A 0.531 (2) −0.0560 (18) 0.1551 (15) 0.071 (4)*
C3A 0.45114 (17) −0.01252 (16) 0.27924 (15) 0.0582 (5)
supporting information
sup-5
Acta Cryst. (2001). E57, o947–o949
C4A 0.47055 (15) 0.05872 (15) 0.36503 (14) 0.0499 (4)
H4A 0.4112 (18) 0.0555 (15) 0.4118 (12) 0.052 (3)*
C5A 0.61552 (18) 0.21815 (14) 0.48250 (12) 0.0466 (4)
H5A 0.5547 (17) 0.2137 (15) 0.5255 (13) 0.053 (3)*
C6A 0.7300 (2) 0.29307 (14) 0.50649 (13) 0.0521 (4)
H6A 0.7558 (19) 0.3422 (17) 0.5694 (14) 0.063 (4)*
C7A 0.81915 (18) 0.29743 (13) 0.44123 (13) 0.0492 (4)
H7A 0.9067 (19) 0.3531 (17) 0.4611 (13) 0.063 (4)*
C8A 0.79123 (15) 0.22698 (13) 0.35304 (12) 0.0415 (3)
H8A 0.8508 (18) 0.2290 (15) 0.3062 (13) 0.057 (3)*
C9A 0.67380 (13) 0.14730 (12) 0.32681 (10) 0.0346 (3)
C10A 0.58453 (14) 0.14235 (12) 0.39252 (10) 0.0373 (3)
N1B 0.89070 (14) −0.18868 (13) 0.73237 (9) 0.0483 (3)
C2B 0.93813 (17) −0.07581 (17) 0.75730 (12) 0.0531 (4)
H2B 0.974 (2) −0.0584 (17) 0.8338 (15) 0.071 (4)*
C3B 0.93974 (15) 0.01761 (15) 0.68472 (12) 0.0473 (4)
H3B 0.9746 (19) 0.0981 (18) 0.7078 (13) 0.064 (4)*
C4B 0.89030 (14) −0.00839 (12) 0.58122 (11) 0.0372 (3)
H4B 0.8869 (17) 0.0548 (15) 0.5285 (12) 0.052 (3)*
C5B 0.78315 (14) −0.16227 (13) 0.44397 (10) 0.0380 (3)
H5B 0.7828 (17) −0.1016 (15) 0.3884 (12) 0.053 (3)*
C6B 0.72953 (16) −0.27704 (14) 0.41768 (12) 0.0471 (4)
H6B 0.6889 (18) −0.3002 (16) 0.3406 (14) 0.063 (4)*
C7B 0.72999 (17) −0.36330 (14) 0.49616 (14) 0.0511 (4)
H7B 0.6901 (18) −0.4468 (18) 0.4770 (13) 0.063 (4)*
C8B 0.78385 (15) −0.33428 (13) 0.59868 (13) 0.0456 (4)
H8B 0.7839 (18) −0.3935 (16) 0.6560 (13) 0.057 (3)*
C9B 0.83913 (13) −0.21504 (12) 0.62842 (10) 0.0343 (3)
C10B 0.83788 (12) −0.12738 (11) 0.54945 (9) 0.0305 (3)
Atomic displacement parameters (Å2)
U11 U22 U33 U12 U13 U23
supporting information
sup-6
Acta Cryst. (2001). E57, o947–o949
C6B 0.0476 (8) 0.0463 (8) 0.0462 (9) 0.0012 (7) 0.0117 (7) −0.0083 (7) C7B 0.0464 (8) 0.0328 (7) 0.0700 (11) −0.0008 (7) 0.0098 (7) −0.0016 (7) C8B 0.0399 (8) 0.0355 (7) 0.0614 (9) 0.0015 (6) 0.0144 (7) 0.0172 (7) C9B 0.0297 (6) 0.0369 (7) 0.0380 (7) 0.0069 (5) 0.0123 (5) 0.0093 (5) C10B 0.0277 (6) 0.0297 (6) 0.0365 (6) 0.0049 (5) 0.0132 (5) 0.0037 (5)
Geometric parameters (Å, º)
N1A—C2A 1.319 (2) N1B—C2B 1.320 (2)
N1A—C9A 1.3742 (17) N1B—C9B 1.3670 (18)
C2A—C3A 1.400 (3) C2B—C3B 1.406 (2)
C2A—H2A 1.01 (2) C2B—H2B 1.00 (2)
C3A—C4A 1.350 (3) C3B—C4B 1.359 (2)
C3A—H3A 0.98 (2) C3B—H3B 0.96 (2)
C4A—C10A 1.414 (2) C4B—C10B 1.4109 (18)
C4A—H4A 0.97 (2) C4B—H4B 0.98 (2)
C5A—C6A 1.358 (2) C5B—C6B 1.360 (2)
C5A—C10A 1.416 (2) C5B—C10B 1.4103 (18)
C5A—H5A 0.95 (2) C5B—H5B 0.99 (2)
C6A—C7A 1.410 (2) C6B—C7B 1.405 (2)
C6A—H6A 0.97 (2) C6B—H6B 1.02 (2)
C7A—C8A 1.365 (2) C7B—C8B 1.358 (2)
C7A—H7A 1.03 (2) C7B—H7B 0.99 (2)
C8A—C9A 1.412 (2) C8B—C9B 1.417 (2)
C8A—H8A 0.98 (2) C8B—H8B 1.00 (2)
C9A—C10A 1.4152 (18) C9B—C10B 1.4181 (17)
C2A—N1A—C9A 117.02 (13) C2B—N1B—C9B 116.98 (13)
N1A—C2A—C3A 124.48 (16) N1B—C2B—C3B 124.60 (14)
N1A—C2A—H2A 116.6 (11) N1B—C2B—H2B 115.5 (11)
C3A—C2A—H2A 118.9 (11) C3B—C2B—H2B 119.9 (11)
C4A—C3A—C2A 118.95 (16) C4B—C3B—C2B 118.74 (14)
C4A—C3A—H3A 121.7 (10) C4B—C3B—H3B 120.7 (10)
C2A—C3A—H3A 119.4 (10) C2B—C3B—H3B 120.6 (10)
C3A—C4A—C10A 119.83 (15) C3B—C4B—C10B 119.43 (13)
C3A—C4A—H4A 124.0 (10) C3B—C4B—H4B 121.1 (9)
C10A—C4A—H4A 116.2 (10) C10B—C4B—H4B 119.4 (9)
C6A—C5A—C10A 120.80 (14) C6B—C5B—C10B 120.97 (13)
C6A—C5A—H5A 121.5 (10) C6B—C5B—H5B 119.7 (9)
C10A—C5A—H5A 117.7 (10) C10B—C5B—H5B 119.3 (9)
C5A—C6A—C7A 120.28 (15) C5B—C6B—C7B 119.94 (14)
C5A—C6A—H6A 122.1 (11) C5B—C6B—H6B 119.8 (10)
C7A—C6A—H6A 117.6 (11) C7B—C6B—H6B 120.3 (10)
C8A—C7A—C6A 120.47 (15) C8B—C7B—C6B 121.04 (14)
C8A—C7A—H7A 120.0 (10) C8B—C7B—H7B 119.0 (10)
C6A—C7A—H7A 119.5 (10) C6B—C7B—H7B 119.9 (10)
C7A—C8A—C9A 120.44 (14) C7B—C8B—C9B 120.26 (13)
supporting information
sup-7
Acta Cryst. (2001). E57, o947–o949
C9A—C8A—H8A 117.6 (10) C9B—C8B—H8B 117.2 (10)
N1A—C9A—C8A 118.42 (12) N1B—C9B—C8B 118.61 (12)
N1A—C9A—C10A 122.40 (12) N1B—C9B—C10B 122.52 (12)
C8A—C9A—C10A 119.17 (13) C8B—C9B—C10B 118.87 (12)
C4A—C10A—C9A 117.32 (13) C5B—C10B—C4B 123.38 (12)
C4A—C10A—C5A 123.83 (13) C5B—C10B—C9B 118.90 (12)
C9A—C10A—C5A 118.83 (13) C4B—C10B—C9B 117.72 (12)
Hydrogen-bond geometry (Å, º)
D—H···A D—H H···A D···A D—H···A
C3B—H3B···N1Bi 0.96 (2) 2.68 (2) 3.626 (2) 171.1 (1)
C6A—H6A···N1Aii 0.97 (2) 2.89 (2) 3.696 (2) 141.1 (1)
![Crystal structure of [3 amino 2 (phenyldiazenyl)pyridine]chlorido(η6 p cymene)ruthenium(II) chloride](data:image/gif;base64,R0lGODlhAQABAIAAAP///wAAACH5BAEAAAAALAAAAAABAAEAAAICRAEAOw==)