Vol. 02 No.02 http://pacificinternationaljournal.com/
Comparison study of two different varieties of pea (Pisumsativum) crop under
different quality of water
Muhammad Tariq Sarwar1,2, Muhammad Adrees*,1, Zhan Han hui2, Shi Weijiang2, Ahsan Maqbool2 *Corresponding Author: [email protected]
Author’s Affiliation:
1. Department of Environmental Sciences & Engineering, Government College University Faisalabad Pakistan. 38000 2. School of Environmental Sciences and Spatial Informatics, China University of Mining and Technology, Xuzhou, P.R
China. 221116
ARTICLE INFO Article history:
Submission date: 11 Jan 2019; 1st Revision 27 Jan 2019; 2nd Revision: 11 Feb 2019; Accepted: 09 April 2019; Pages: 57-68
ABSTRACT
Agricultural practices are highly dependent on irrigation while the sustainability of agriculture is directly related to the quality of irrigation water. Industrial wastewater effluents used for agricultural practices due to decrease of water supplies in agroecosystems but unpromising effects on plants physical and chemical properties have been reported. Experiment was carried out to study the effect of textile industry effluent via measuring its different physicochemical properties along with trace heavy metals and also in order to assess its quality to be used being an alternate source of irrigation. The experiment was comprised of three treatments
(T1= Canal water, T2= Treated water, T3 = Untreated water).
The effects of irrigation water quality on two pea (Pisumsativum) crop varieties (Mateur and Pea09) yield were
also significant. T3 produced the highest yield on Pea09
variety followed by T2 and T1 which produced the lowest
yield as compared to Mateur variety, respectively. As the
evaluated results, it can be used to develop future scenarios for optimization of the industrial treated wastewater for agriculture.
Keywords: Irrigation, Agriculture, Wastewater effluents, Pea crop
1
. Introduction
Pakistan is an agricultural country having arid semiarid climatic conditions (Abbas et al. 2014) and facing water scarcity problem at present scenario. For intensive cropping system, canal water is not enough to achieve the maximum potential of soil and crops. Groundwater is also an important source of water for agricultural use but this water is contaminated and is unfit for irrigation (Huma et al. 2012). Farmers are purposely
using industrial and municipal wastewater for irrigation due to the scarcity of water, especially for raising vegetables and fodders (MURTAZA et al. 2010). Faisalabad and Lahore cities are considered to become the main industrial cities of Punjab, Pakistan. Unchecked disposal of industrial and municipal effluents has deteriorated the quality of underground water of major cities
of Pakistan including Lahore and
Vol. 02 No.02 http://pacificinternationaljournal.com/ industrial and municipal effluents exhibit
high COD, BOD, TDS, toxic metals, toxic chemicals, and pathogenic microorganisms. Treated community wastewater exemplifies a substantial latent source of domestic water for certain valuable reuse. In industrialized countries, almost 73% of the residents are assisted by the collection of wastewater and treatment services. However, only 35% of the developing countries the population is aided by the collection of wastewater (USEPA 2004). From the environmental aspect it is interesting that by using treated effluents for agriculture purposes, the agricultural field can be considered as a tertiary treatment step, while non-controlled environmental pollution is prohibited if well managed (Leverenz and Asano 2011).With increasing overall population, the gap between the supply and demand for water is reaching such shocking levels that in some areas of the world it is affectation a risk to human survival. Scientists around the world are working on alternates of conserving water or conjunctive use water (Dirk 2018; Safavi and Rezaei 2015; Saleem 2009). It is a favorable time, to refocus on the ways to recycle water through the reuse of wastewater, for irrigation and other purposes (Chaoua et al. 2018; Drechsel and Evans 2010; Libutti et al. 2018).
Wastewater is being irrigated 0.3 million hectares of agricultural land. The safe removal and use of wastewater enhance crop
production and reduce environmental
pollution (Saleem 2009).The potential for
irrigation to raise both agricultural
productivity and the living standards of the rural poor has been recognized. This potential is even more pronounced in arid areas, such as the Near East Region, where only 30 percent of the cultivated area is irrigated but it produces about 75 percent of the total agricultural production. Where-as more than 50 percent of the food
requirements are imported and the rate of increase in demand for food exceeds the rate of increase in agricultural production (Zaidi n.d.).Wastewater can be used for the agriculture irrigation in towns. Flowing of wastewater in canals used to irrigate minor land area where fodder, grass or some other product that could be used in slight amounts for the diet of living organisms and may pose a serious health risk (Ensink, Simmons, and Hoek n.d.; Khalid et al. 2018). Microbial community patterns substantially differed between water treatments, and bacterial population is influenced by different qualities of treated wastewater used for irrigation (Gatta et al. 2015)
Therefore, it is necessary to investigate the fate and transport of metals pollution in crop plants irrigated with treated and untreated industrial effluents. Further, the findings of this study would help us in achieving sustainable land use practices, to overcome the bidirectional issue of water scarcity
which ultimately; affecting plants
productivity.
2. Materials and Methods
2.1. Experimental design
The experimental research work was carried out in the open atmospheric natural conditions into the botanical garden of Government College University Faisalabad. Seeds of the two selected cultivars of pea (Peas09 and Mateur) were collected from the Vegetables Research Institute located in
Ayub Agricultural Research Institute,
Faisalabad for this experimental research work. Soil for the experimental study was arranged from the nursery. The soil was
homogenized, air-dried under room
Vol. 02 No.02 http://pacificinternationaljournal.com/ sowing. The pots were shifted to an
experimental area for effluents treatment Fig.1.
Figure 1 Field Experiment at growing stage of pea crop
The complete layout of the experiment is given in Table 1.
Table 1: Layout of Experiment
Treatment 1 Treatment 2 Treatment 3
V1R 1
V2R 3
V1R 2
V2R 1
V1R 3
V2R 1
V1R 2
V2R 1
V1R 3
V2R 2
V1R 1
V2R 3
V1R 3
V2R 2
V1R 1
V2R 3
V1R 2
V2R 2 V1= Peas 09, V2 = Mateur, R(1-3) = Replications, T1 = Canal water, T2 = Treated water, T3 = Untreated water
The experiment conducted under the open air conditions was a completely randomized design (CRD) with three treatments and three replicates for each of the selected genotypes of a pea.
2.2. Applied Treatments
During the first week of experiment, three treatments with three different qualities of water were conducted (canal, treated and untreated wastewater) started after the sufficient vegetative growth (leaf, stem and roots) of selected cultivars of pea crop. Each pot in the experimental design receives 250 ml of water accordingly to three treatments, designed as Treatment 1 (canal), Treatment 2 (treated wastewater) and Treatment 3 (untreated wastewater), respectively. The treatment of canal, treated and untreated
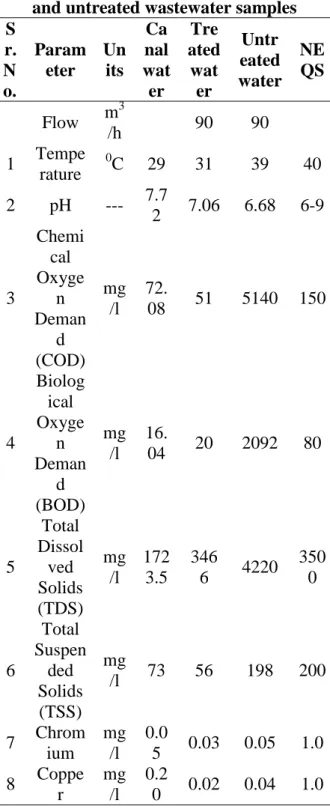
wastewater applied to experiment regularly as per crop requirement and accordingly to prevailing weather patterns. Wastewater quality parameter of treated and untreated samples is shown in Table 2.
Table 2: Studied parameters of treated and untreated wastewater samples S
r. N o.
Param eter
Un its
Ca nal wat
er Tre ated
wat er
Untr eated water
NE QS
Flow m
3
/h 90 90
1 Tempe
rature
0
C 29 31 39 40
2 pH --- 7.7
2 7.06 6.68 6-9
3
Chemi cal Oxyge
n Deman
d (COD)
mg /l
72.
08 51 5140 150
4
Biolog ical Oxyge
n Deman
d (BOD)
mg /l
16.
04 20 2092 80
5
Total Dissol ved Solids (TDS)
mg /l
172 3.5
346
6 4220
350 0
6
Total Suspen
ded Solids (TSS)
mg
/l 73 56 198 200
7 Chrom
ium mg
/l 0.0
5 0.03 0.05 1.0
8 Coppe
r
mg /l
0.2
Vol. 02 No.02 http://pacificinternationaljournal.com/ 2.3. Experimental Observations
During the experiment days to germinate,
plant height, flower development, chlorophyll concentration, stomatal conductance and photosynthesis rate were measured on a regular interval as follow. 2.3.1. Plant height
Initial growth measurements (plant height and leaf number) were taken before the start of treatment. Numbers of leaves for selected
cultivar Peas 09 and Mateur of the
experimental crop were calculated.
Measurements for plant height were carried out on weekly basis at day 14, 22, 30, 37, 44, 51, 58, 65, 72, 79, 86 and 93 of the experiment, respectively.
2.3.2. Chlorophyll concentration
The leaf chlorophyll concentrations were
measured during the experiment. Fresh leaf samples (0.1 g) were taken and directly immersed into 3 ml acetone (80%) and incubated for 24 hours at 4°C. After
incubation, the optical density was
determined at 480 nm, 645 nm, and 663 nm
wavelength by using a UV-visible
spectrophotometer (V1.7, WPA,
Cambridge). Chlorophyll a, chlorophyll b,
and total chlorophyll were calculated by
using the formula of(Arnon 1949).
Carotenoid content of leaves was evaluated by using the formula (Kirk and Allen 1965). The number of pigments was represented in mg/g of fresh weight.
Chlorophyll a = 12. 7 (A 663) - [2.
69 (A 645) (V / W)]
Chlorophyll b = 22. 9 (A 645) - [4.
68 (A 663) (V / W)]
Total Chlorophyll (a + b) = 20. 2 (A 645) + [8.02 (A 663) (V / W)]
Carotenoids = 4. 16 (A 480) - [0. 89 (A 663) (V / W)]
Where, A = Absorbance at specific wavelengths, V = final volume of chlorophyll extract, W = fresh weight of tissue extracted
2.3.3. Stomatal conductance
The youngestfully expanded healthy leaves (third leaves from top) were used for the
measurement of stomatal conductance using
Delta T AP4 porometer, Delta-T Devices
Ltd, Cambridge, UK. Stomatal conductance
measurement was taken at different weather conditions during the day, including cloudy and sunny days.
2.3.4. Metals content
Grind the pea’s grains and 0.5 g sample is weighted on the electronic balance. These weighted samples place in the digestion flask. After adding tri-acid into samples then put on the digestion chamber for 1 hour. The color of the sample is removed, filter these samples and make volume up to 50 ml. Then
test on the Atomic absorption
spectrophotometer to analyze the heavy metals copper and chromium(Micco et al. 1987).
2.3.5. Crude protein contents
Firstly crush the oven dried pea’s sample and took 1.0 g sample is weighted on the
electronic balance. Mixture (1.0 g CuSO4 +
10 g K2SO4 + 0.1 g SC), 10 ml H2SO4 and
samples are added in digestion cube. Then these digestion cubes put on the digestion block for 3 hours. When 1-2 ml solution left at the end then added distilled water to make 100 ml solution by volume. Then distillation process is completed and 50 ml solution received from flask. Titrate against N/10
H2SO4 and note the reading.
2.3.6. Photosynthesis rate
The youngest fully expanded healthy leaves
were usedfor the measurement of
photosynthesis rate using IRGA.
Photosynthesis rate measurements were taken at different weather conditions during the day, including cloudy and sunny days. 2.4. Statistical Analysis
Vol. 02 No.02 http://pacificinternationaljournal.com/ ANOVA in the GLM arithmetical package
using R 3.0.2 (Ligges 2009). 3. Results and Discussion
The plant sample was collected from the selected sites and following parameters were
observed as discussed below; germination of
pea seeds, plants height, chlorophyll a, chlorophyll b, carotenoids, chlorophyll a/b ratio, total chlorophyll and carotenoids/total chlorophyll ratio, grain yield, straw yield, and stomatal conductance.
Figure 2 Germination of pea
In Figure2, represents Pea
germination at outdoor conditions of the
selected site (Botanical garden of
Government College University Faisalabad). Germination of seeds of the selected variety
Mateur (V2) has a better germination rate as
compared to variety Pea09 (V1).
Figure 3 Plant height of Pea 09 (V1)
In Figure 3 and 4, Plant height of two varieties of a pea under three different treatments shows significant results. Plant shows maximum height by applying untreated water (T3) followed by treated water (T2) and canal water (T1). Pea plant achieved maximum plant height (35cm) under T3 irrigation followed by T2 (33cm) and T1 (29.5cm). Plants height (P and F)
values of ANOVA effect on Pea
(Pisumsativum) Table 3.
Table 3: ANOVA P and F values of plant height
Plant height of V1&V2
P F
Treatment
(T) 0.083 2.61
Varieties
(V) 0.001 12.10
Interaction 0.306 1.21
The significant difference is found among the treatments as well as varieties due to the enrichment of organic matters and plant nutrients in treated and untreated industrial effluents which required by growing of plants and also climatic conditions affect the varying of plants length, leaf surface, and vegetation area. Leaves of the plant having the major
impingement which reduces pollution
through biological activities, reduce dust concentration of air by filtration and absorption(Xiao et al. 2018).
0 0.5 1 1.5 2 2.5 3 3.5 4
Day
1
Day
2
Day
3
Day
4
Day
5
Day
6
Day
7
Em
b
ry
o
Gr
o
wt
h
(c
m
)
Days
V1
V2
0 10 20 30 40
1 3 5 7 9
p
lan
t
h
e
ig
h
t
(c
m
)
Vol. 02 No.02 http://pacificinternationaljournal.com/
Figure 4 Plant height of Mateur (V2) Leaves capacity as receptors also depends upon cuticular and epidermal features of leaves, phyllotaxy, surface geometry, leaf pubescence, type of canopy etc (Naik and Somashekar 2006). In this study, the Peas plant was maintained at same climatic and edaphic conditions and then observed the difference in plant growth may attribute to three different water treatments. The plant height of Peas decreased on treatment T1 due to the significant level of organic matters (Agrawal et al. 2003). It is reported that the concentration of organic matters, essential for plant height is more in industrial effluent rather than canal water that affected on height, shoot weight, growth, and its development stage (Wilson and Murray 1990).
Figure 5 Effect of treatments on chlorophyll a concentration
Figure 6 Effect of treatments on chlorophyll b concentration
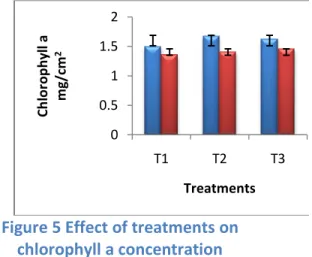
In Figure 5 and 6, chlorophyll a and
chlorophyll b were clearly shown maximum in variety (V1) as compared to variety (V2) in all three treatments (treated, untreated and canal water). The result exposed that chlorophyll contents were reduced in variety
(V2). The chlorophyll a and chlorophyll b
contents were observed in a floristic society comprising of the peas varieties. However, the chlorophyll a concentration was comparatively reduced on T1 as compared to T2 and T3. The outcomes of untreated effluent from industries were scattered in the
environment and then affect the
groundwater as well as the crops which were nearest to the industries. This reaction was noted mostly in some crop varieties. The pea species being acclimated for a longer period at the affected areas, this response shows the low chlorophyll concentration in the tissues. 0
10 20 30 40
1 3 5 7 9
Pl
an
t
h
e
ig
h
t
(c
m
)
Weeks after germination
T1
T2
T3
0 0.5 1 1.5 2
T1 T2 T3
Ch
lo
ro
p
h
yl
l a
m
g/
cm
2
Treatments
0 0.2 0.4 0.6 0.8 1
T1 T2 T3
Ch
lo
ro
p
h
yl
l b
m
g/
cm
2
Treatments
V1
Vol. 02 No.02 http://pacificinternationaljournal.com/
Figure 7 Effect of treatments on total chlorophyll concentration
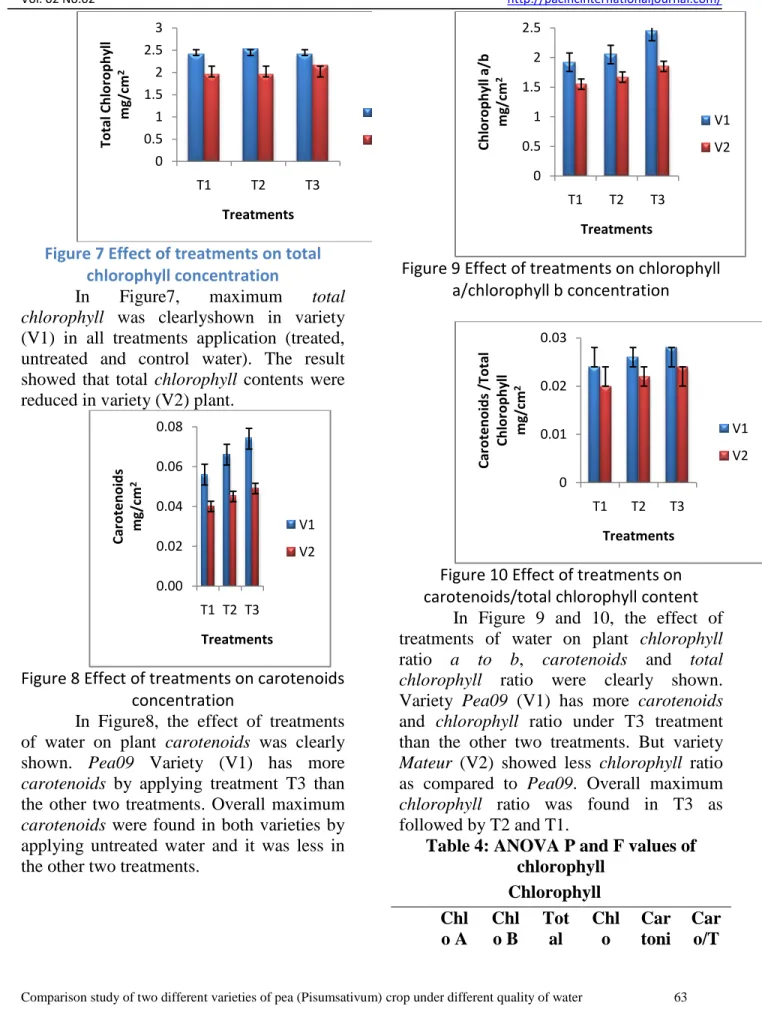
In Figure7, maximum total
chlorophyll was clearlyshown in variety (V1) in all treatments application (treated, untreated and control water). The result
showed that total chlorophyll contents were
reduced in variety (V2) plant.
Figure 8 Effect of treatments on carotenoids concentration
In Figure8, the effect of treatments
of water on plant carotenoids was clearly
shown. Pea09 Variety (V1) has more
carotenoids by applying treatment T3 than the other two treatments. Overall maximum
carotenoids were found in both varieties by applying untreated water and it was less in the other two treatments.
Figure 9 Effect of treatments on chlorophyll a/chlorophyll b concentration
Figure 10 Effect of treatments on carotenoids/total chlorophyll content
In Figure 9 and 10, the effect of
treatments of water on plant chlorophyll
ratio a to b, carotenoids and total
chlorophyll ratio were clearly shown.
Variety Pea09 (V1) has more carotenoids
and chlorophyll ratio under T3 treatment than the other two treatments. But variety
Mateur (V2) showed less chlorophyll ratio
as compared to Pea09. Overall maximum
chlorophyll ratio was found in T3 as followed by T2 and T1.
Table 4: ANOVA P and F values of chlorophyll
Chlorophyll Chl
o A Chl o B
Tot al
Chl o
Car toni
Car o/T 0
0.5 1 1.5 2 2.5 3
T1 T2 T3
To
tal
Ch
lo
ro
p
h
yl
l
m
g/
cm
2
Treatments
V1
V2
0.00 0.02 0.04 0.06 0.08
T1 T2 T3
Car
o
te
n
o
id
s
m
g/
cm
2
Treatments
V1
V2
0 0.5 1 1.5 2 2.5
T1 T2 T3
Ch
lo
ro
p
h
yl
l a/
b
m
g/
cm
2
Treatments
V1
V2
0 0.01 0.02 0.03
T1 T2 T3
Car
o
te
n
o
id
s
/To
tal
Ch
lo
ro
p
h
yl
l
m
g/c
m
2
Treatments
V1
Vol. 02 No.02 http://pacificinternationaljournal.com/ Chl
o
A/B des otal Chl P F P F P F P F P F P F Tr ea tm en t (T ) 0 . 9 9 7 0 . 0 0 1 0 . 7 7 1 0 . 2 7 0 . 9 7 0 0 . 0 3 0 . 3 3 8 1 . 1 9 0 . 9 3 0 0 . 0 7 0 . 4 1 8 0 . 9 4 V ar iet ies (V ) 0 . 4 4 1 0 . 6 4 0 . 2 8 0 1 . 2 8 0 . 3 3 6 1 . 0 1 0 . 9 4 0 0 . 0 1 0 . 0 4 7 4 . 9 0 0 . 5 4 4 . 5 5 In te ra cti on 0 . 6 7 0 0 . 4 1 0 . 3 7 4 1 . 0 7 0 . 5 1 1 0 . 7 1 0 . 2 6 1 1 . 5 1 0 . 7 1 3 0 . 3 5 0 . 2 6 4 1 . 4 9
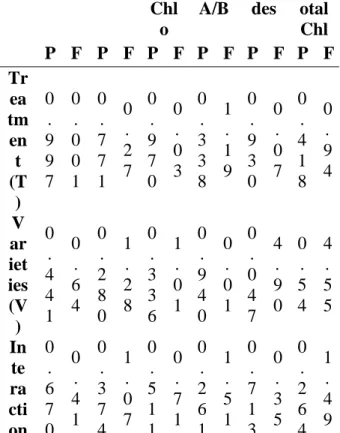
All chlorophyll (P and F) values of ANOVA
effect on Pea (Pisumsativum) Table 4. The
significant difference is found among the treatments and also some difference is found between the varieties.
Chlorophyll content is necessary for photosynthetic activity and air pollution is the main indicator to reduce the chlorophyll contents (GILBERT 1968). The water
pollutants decreased chlorophyll synthesis
and increase the degradation of chlorophyll
(Meher et al. 2018; SANDELIUS et al.
1995). It has been reported that the
chlorophyll content should be a helpful indicator for the assessment of injury induced by untreated wastewater pollutants such as (Roberts, Unsworth, and Ormrod
1983). During this study in which
chlorophyll a, chlorophyll b, carotenoids, chlorophyll a/b ratio, total chlorophyll and
carotenoids/total chlorophyll were also estimated on three different treatments on
two varieties of pea crop. The carotenoids,
chlorophyll a/b ratio, total chlorophyll and
carotenoids/total chlorophyll concentration was found to be higher in treatment T3 at selected site as compared to treatment T2 and treatment T1 in both varieties. When the heavy metal settles down on the shoots and leaves, then it blocks the stomata to prevent normal gaseous exchange and apply
significant bearing on photosynthesis
(CREED, LEES, and DUCKETT 1973). Water pollutants apply additional stress on plants that can reduce plant growth and by other stresses, the productivity decreased as well (Winner 1994). These findings are in accordance with other studies (Winner
1994). The photosynthesis and respiration
process move continuously when plants and
crops inhale the CO2 and O2 through
stomata. If the layer of particles closes the stomata for a longer period of time then these processes stopped and the plant may suffer mortality.
Figure 11 Effect of treatments on grains and straw yield
In Figure11, treatments of water
show significant results about grain and
straw yield, treatment T3 showed more yield production on two varieties then T1 and T2.
Variety Pea09 (V1) shows better results as
compared to variety Mateur (V2) and
showed maximum yield production with 0 2 4 6 8 10 12
T1 T2 T3
Vol. 02 No.02 http://pacificinternationaljournal.com/ treatment T3 rather than treatments T1 and
T2.
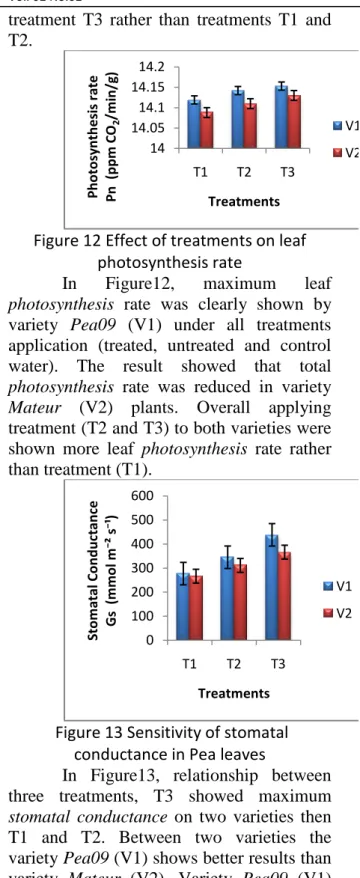
Figure 12 Effect of treatments on leaf photosynthesis rate
In Figure12, maximum leaf
photosynthesis rate was clearly shown by
variety Pea09 (V1) under all treatments
application (treated, untreated and control water). The result showed that total
photosynthesis rate was reduced in variety
Mateur (V2) plants. Overall applying treatment (T2 and T3) to both varieties were
shown more leaf photosynthesis rate rather
than treatment (T1).
Figure 13 Sensitivity of stomatal conductance in Pea leaves
In Figure13, relationship between three treatments, T3 showed maximum
stomatal conductance on two varieties then T1 and T2. Between two varieties the
variety Pea09 (V1) shows better results than
variety Mateur (V2). Variety Pea09 (V1)
showed maximum stomatal conductance
with treatment T3 as compared to the treatments T1 and T2.
Table 5: ANOVA P and F values of stomatal conductance and photosynthesis
rate Stomatal conductance
Photosynthesi s rate
P F P F
Treatmen t (T)
0.000 1
43.6 5
0.000
1 23.48
Varieties
(V) 0.006
11.3 4
0.000 1
154.3 3 Interactio
n 0.130 2.43 3.17 0.79
Stomatal conductance and photosynthesis
rate (P and F) values of ANOVA effect on
Pea (Pisumsativum) Table 5. A significant
difference of stomatal conductance and
photosynthesis rate were found among the varieties as well as treatments.
4. Conclusion
The study exposed that wastewater coming from industrial (treated or untreated) source extensively enhanced plant growth due to nutrients, organic matter and moderate level of pollutants. Both varieties behaved similarly showing high growth increment in term of height under untreated water irrigation followed by treated industrial effluents and canal water. Particularly,
variety Pea09 as compared to variety
Mateur exhibited marked differences in their height under different sources of irrigation. These findings suggested that higher uptake of organic matter and nutrient was observed in plants mostly under untreated industrial
waste followed by treated industrial
effluents. Canal water contribution to organic matter and nutrients uptake for two varieties was comparatively low. Overall growth rate of pea varieties on untreated industrial effluents was considerable but there is possibility have some health risks from production of crops instead of canal 14
14.05 14.1 14.15 14.2
T1 T2 T3
Ph
o
to
sy
n
th
e
si
s
rate
Pn
(
p
p
m
CO
2
/m
in
/g
)
Treatments
V1
V2
0 100 200 300 400 500 600
T1 T2 T3
Sto
m
atal
Co
n
d
u
ctan
ce
Gs
(
m
m
o
l m
⁻²
s⁻¹)
Treatments
V1
Vol. 02 No.02 http://pacificinternationaljournal.com/
water which affects human health.
Influential, treated industrial wastewater is found as a good and reliable alternative source of fresh and canal water for agriculture purposes.
5. Acknowledgement
Author’s want to acknowledge this work was funded by the National Natural science Foundation of China (Grant No. 51574238) and also acknowledge that NIBGE (National Institute for Biotechnology and Genetic Engineering) Faisalabad for their support in analysis.
6. References
Abbas, Farhat et al. 2014. “Changes in Precipitation Extremes over Arid to Semiarid and Subhumid Punjab,
Pakistan.” Theoretical and Applied
Climatology 116(3–4): 671–80. http://link.springer.com/10.1007/s0070 4-013-0988-8.
Agrawal, M et al. 2003. “Effect of Air Pollution on Peri-Urban Agriculture: A
Case Study.” Environmental Pollution
126(3): 323–29.
http://linkinghub.elsevier.com/retrieve/ pii/S0269749103002458.
Arnon, D. I. 1949. “COPPER ENZYMES IN ISOLATED CHLOROPLASTS. POLYPHENOLOXIDASE IN BETA
VULGARIS.” PLANT PHYSIOLOGY
24(1): 1–15.
http://www.plantphysiol.org/cgi/doi/10. 1104/pp.24.1.1.
Chaoua, Sana, Samia Boussaa, Abdelhay El Gharmali, and Ali Boumezzough. 2018. “Impact of Irrigation with
Wastewater on Accumulation of Heavy Metals in Soil and Crops in the Region
of Marrakech in Morocco.” Journal of
the Saudi Society of Agricultural Sciences.
CREED, E. R., D. R. LEES, and J. G. DUCKETT. 1973. “Biological Method of Estimating Smoke and Sulphur
Dioxide Pollution.” Nature 244(5414):
278–80.
http://www.nature.com/doifinder/10.10 38/244278a0.
Dirk, Medema. 2018. “Environment:
Alternative Water Sources – Greywater
Reuse.” Ukiah Daily Journal.
Drechsel, Pay, and Alexandra E V Evans. 2010. 24 Irrigation and Drainage
Systems Wastewater Use in Irrigated
Agriculture.
Ensink, J. H. J., R. W. Simmons, and W. van der Hoek. “Wastewater Use in
Pakistan: The Cases of Haroonabad and
Faisalabad.” In Wastewater Use in
Irrigated Agriculture: Confronting the Livelihood and Environmental
Realities, Wallingford: CABI, 91–99. http://www.cabi.org/cabebooks/ebook/ 20043115037.
Gatta, Giuseppe et al. 2015. “Treated Agro-Industrial Wastewater Irrigation of Tomato Crop: Effects on
Qualitative/Quantitative Characteristics of Production and Microbiological
Properties of the Soil.” Agricultural
Water Management 149: 33–43. GILBERT, O. L. 1968. “BRYOPHYTES
AS INDICATORS OF AIR POLLUTION IN THE TYNE
VALLEY.” New Phytologist 67(1): 15–
30.
http://doi.wiley.com/10.1111/j.1469-8137.1968.tb05450.x.
Huma, Zille, Shahida Naveed, Abdur
Rashid, and Asad Ullah. 2012. “Effects of Domestic and Industrial Waste Water on Germination and Seedling Growth of Some Plants.” 1(1): 27–30. Khalid, Sana et al. 2018. “A Review of
Environmental Contamination and Health Risk Assessment of Wastewater Use for Crop Irrigation with a Focus on Low and High-Income Countries.”
Vol. 02 No.02 http://pacificinternationaljournal.com/
Research and Public Health 15(5): 1– 36.
Kirk, J.T.O., and R.L. Allen. 1965.
“Dependence of Chloroplast Pigment Synthesis on Protein Synthesis: Effect
of Actidione.” Biochemical and
Biophysical Research Communications
21(6): 523–30.
http://linkinghub.elsevier.com/retrieve/ pii/0006291X65905164.
Leverenz, H.L., and T. Asano. 2011. “Wastewater Reclamation and Reuse
System.” In Treatise on Water Science,
Elsevier, 63–71.
http://linkinghub.elsevier.com/retrieve/ pii/B9780444531995000762.
Libutti, Angela et al. 2018. “Agro-Industrial Wastewater Reuse for Irrigation of a Vegetable Crop Succession under Mediterranean Conditions.”
Agricultural Water Management 196: 1–14.
Ligges, Uwe. 2009. “Crawley MJ (2007)
The R Book.” Statistical Papers 50(2):
445–46.
http://link.springer.com/10.1007/s0036 2-008-0118-3.
Meher, P. Shivakrishna, K. Ashok Reddy, and D. Manohar Rao. 2018. “Effect of PEG-6000 Imposed Drought Stress on RNA Content, Relative Water Content (RWC), and Chlorophyll Content in
Peanut Leaves and Roots.” Saudi
Journal of Biological Sciences 25(2): 285–89.
Micco, Claudia et al. 1987. “Evaluation of Lead, Cadmium, Chromium, Copper and Zinc by Atomic Absorption
Spectroscopy in Durum Wheat Milling Products in Relation to the Percentage
of Extraction.” Food Additives and
Contaminants 4(4): 429–35.
http://www.tandfonline.com/doi/abs/10 .1080/02652038709373651.
MURTAZA, G. et al. 2010. “Disposal and
Use of Sewage on Agricultural Lands
in Pakistan: A Review.” Pedosphere
20(1): 23–34.
http://linkinghub.elsevier.com/retrieve/ pii/S1002016009602794.
Naik, D Paramesha, and R K Somashekar. 2006. “Impact of Stone Quarrying on Soil Quali- Ty - A Case Study in Bangalore Dist ., India.” 21(2). Roberts, T. M., M. H. Unsworth, and D. P.
Ormrod. 1983. “Effects of Gaseous Air Pollution in Agriculture and
Horticulture.” The Journal of Applied
Ecology 20(2): 704.
https://www.jstor.org/stable/2403560?o rigin=crossref.
Safavi, H R, and F Rezaei. 2015. “FUZZY NEURAL NETWORK AND
GENETIC ALGORITHM.” 39: 365– 77.
Saleem, Muhammad. 2009. “Wastewater Reuse Potential in Pakistan: Guidelines for Environment and Public Health
Protection.” International Journal of
Environmental Engineering 1(3): 306. http://www.inderscience.com/link.php? id=27807.
SANDELIUS, ANNA STINA et al. 1995. “Exposure of Spring Wheat ( Triticum Aestivum ) to Ozone in Open-Top Chambers. Effects on Acyl Lipid Composition and Chlorophyll Content
of Flag Leaves.” New Phytologist
131(2): 231–39.
http://doi.wiley.com/10.1111/j.1469-8137.1995.tb05724.x.
USEPA. 2004. Guidelines for Water Reuse.
Vol. 02 No.02 http://pacificinternationaljournal.com/ mlQuery=.
Wilson, Susan A., and Frank Murray. 1990. “SO2-Induced Growth Reductions and Sulphur Accumulation in Wheat.”
Environmental Pollution 66(2): 179– 91.
http://linkinghub.elsevier.com/retrieve/ pii/0269749190901202.
Winner, William E. 1994. “Mechanistic Analysis of Plant Responses To Air
Pollution.” Ecological Applications
4(4): 651–61.
http://doi.wiley.com/10.2307/1941998. Xiao, Xin et al. 2018. “Will Wheat Be
Damaged by Heavy Metals on Exposure to Coal Fly Ash?”
Atmospheric Pollution Research 9(5): 814–21.
Zaidi, M. K. “Wastewater Reuse.” In , 445– 50.