OPTIMIZATION OF LYE PEELING OF BREADFRUIT
(Artocarpus comminis Frost) USING RESPONSE SURFACE
METHODOLOGY
1*H.A.BAKARE, 2O.F OSUNDAHUNSI 3J.O. OLUSANYA AND 3M.O. ADEGUNWA
1School of Vocational Education, Michael Otedola College of Primary Education, Noforija, Epe. Lagos, Nigeria
2Department of Food Science and Technology, Federal University of Technology, Akure Nigeria.
3Department of Home and Hotel Management, Tai Solarin University of Education, Ijagun, Ijebu-Ode Nigeria
*Corresponding author: [email protected]
1981). Total yearly production in Nigerian is about 10 million metric tones having poten-tial to exceed 100 million metric tones with improved agricultural practice (Adewusi et
al., 1995) .The economic Utilization of
breadfruit has been limited by its poor stor-age properties (about 3-4 days). However, it has been suggested (Morton, 1987; Thomp-son et al., 1974) that conversion to flour would provide a more stable storage form as well as enhance the versatility of the fruit. Current usage of breadfruit is attaining
ABSTRACT
Breadfruit (Artocarpus communis Frost) is an important food crop in many tropical developing coun-tries. Conventional peeling, done manually using knives is wasteful and unsuitable for industrial scale operation. Optimum condition for the peeling of breadfruit by immersion in hot lye (NaOH) solution was determined using Response Surface methodology (RSM) for pre-determined three levels of Peeling Efficiency Index (PEI). Some breadfruit was peeled manually and some with hot lye solution. The effects of lye–concentration (0.5-2.0%), immersion temperature (70-90°C) and immersion time (2.5-10min.) on PEI (removal of 6-11% of peel) with subsequent soft and abrasive washing of the peeled crop obtained from 14 experimental points and three replication were analyzed with design expert and statistical analysis system software. Complete lye–peeling (removal of 6% of the fruit ) was achieved at 1.6%, 80°C and 5min respectively which were within the critical optimization range (R2=52%,
CV=75.9%) generated by the RSM.
Keyword: Breadfruit, Peeling, RSM
INTRODUCTION
Breadfruit (Artocarpus comminis Frost) is a carbohydrate food resource and staple diet many tropical developing countries of the world. The tree fruits primarily between May and August producing 50 to 200 fruit in a year. The mature fruit is round or ovoid, 15-20cm in diameter and weighing 2-10kg on average (Graham et al., 1981). The fruit is produced mainly by Malaysia, the South pacific Island, the Caribbean’s and West Africa (Morton, 1987; Loos et al.,
Sciences, Engineer-ing and Technology © UNAAB 2009
greater industrial importance particularly in food application such as bakery product, flour confectionaries and related product (Olatunji and Akinrele, 1978) while its starch is of potential value as adhesives in packaging and also in textile and pharma-ceutical industries (Whistler et al., 1984). The industrial production of breadfruit flour requires new technology to increase production output with minimum process-ing time to avoid undesirable variation in colour quality arising from undue exposure to sunlight and enzymatic activities. At pre-sent, the peeling of breadfruit is done by hand, often by women and children using knives, a process which is tedious, wasteful and time consuming especially for large– scale operation. Hot lye–peeling, a process which combines the effectiveness of both chemical (Talburt and Smith, 1967) has been successfully applied to agricultural produce such as pepper (Floros and Chinnnan,1987), potato (Greig and Man-chester, 1958) and cassava (Sreenarayanan et
al., 1995).
In the present study, the feasibility of peel-ing breadfruit by immerspeel-ing in a lye (NaOH) solution was investigated. Re-sponse surface methodology (RSM) was to determine to optimum combinations of three processing variables namely; concen-tration, immersion temperature lye solution and immersion time on peeling efficiency.
MATERIALS AND METHODS
Mature fruit of the seedless variety of breadfruit (Artocarpus communis Frost) used for the study were obtained from a local farm at Mamu in Ijebu North local Govern-ment area of Ogun State, Nigeria. Twenty– five fruits of various sizes were hand peeled to so that the relationship between the peels and fruit can be established. Some of thefruit were peeled as done normally by women (involving the removal of the peri-carp with some of the mesoperi-carp) while oth-ers were carefully peeled to remove as much as practicable only the thin pericarp.
Lye peeling of breadfruit: Lye–peeling of the fruit was carried out as described by Sreeparayanan, Rubikala and Jayas (1995) with minor modification. A thematically regulated stainless steel water bath was filled with 3-L lye-solution of the required concen-tration prepared using NaOH pellets, and heated to the desired temperature. The tem-perature of the lye-solution at any desired level was maintained within ±2°C. The masses of each of the pre-washed fruits to be treated were determined using Acculab elec-tronic digital scale (Model 2001). The fruits were placed in the hot lye solution with the aid of a plastic net and immersed in the solu-tion for the durasolu-tion of each specified resi-dent/immersion time (measured with a Heure stopwatch) before being removed and washed. Two modes of washing were adopted-soft (hand rinsing ) in stream of wa-ter and initial weighing, followed by abrasive washing using a brush with plastic thistle and final weighing. The peeling efficiency index (PEI) was calculated for varying levels of treatment as done by Sreeparayanan et al., (1995). Three levels/types of efficiency were evaluated; based on the conventional peeling as done by women (PEIA), careful removal of the thin pericarp (PEIB) and on the actual of peels (%peeled) removed from the fruit. Each experiment was replicated three times and the mean response was used for multiple regression analysis to develop an empirical model relating the independent variables to each peeling efficiency and percentage of peels removed.
showed a stationery (saddle) point in re-sponse surfaces the ridge analysis (canonical analysis) of SAS RSREG procedure was used to compute the estimated ridge of the opti-mum response.
Verification of Model
Optimal peeling efficiency index (PEI) and actual percentage of peels removed required for the peeling of breadfruit which depended on the independent variables were obtained using predictive equations of RSM. The ex-perimental and predicted values were com-pared in order to determine the validity of the model.
RESULTS AND DISCUSSION
Results of manual peeling of breadfruit re-vealed that the thin pericarp of breadfruit is about 6% of breadfruit while the manual re-moval of the pericarp with part of the meso-carp would involve removing about 11% of the weight of breadfruit. It was necessary to identify the three levels in which the effi-ciency of the peeling system can be based in order to avoid over or under peeling. Over-peeling leads to wastages and resulted in re-duction in unit yield per fruit. Over-peeling by chemical (lye) peeling process could occur as a result of prolonged or over-exposure of unpeeled fruits to unnecessary high concen-tration of Iye-solution. This has implications on processing cost and consumers’ health. The efficiency of lye-peeling process has been reported to be influenced by multiple parameters such as concentration of the lye (NaOH) solution, immersion temperature and time (Floros and Chinnan 1987; Sreeparayanan et al., 1995). The effects of these parameters may either be independent or interactive. Approximate conditions for lye-peeling of breadfruit were determined by varying one factor at a time while keeping the others constant. Index of peelingeffi-Experimental procedure
Optimization of lye peeling of breadfruit was carried out using response surface methodology (Montgomery, 2001; Myers and Montgomery, 2002). Based on prelimi-nary experiment, three independent vari-ables considered to be of importance to the peeling process were concentration of lye (NaOH) solution (X1, %w/v, NaOH/ water), temperature of the solution (X2,°C) and immersion time (X3, min). The inde-pendent variables (X1, X2 & X3) were se-lected for optimization on the basis of a three factor and three level face–centered cube (FCD) (Liyana-Pathirana and Shahidi, 2005) consisting of fourteen experimental runs. Peeling efficiency index (PEIA & PEIB) and actual percentage of removed from the fruit wase used as dependent variables for each level of treatment.
Data analysis
The responses surface regression (RSREG) procedure of statistical analysis system (SAS) and design expert (version 6.0.5) soft-ware were used to analyze the experimental data as described by Myers and Montgom-ery, 2003). Experimental data were fitted to a second order polynomial model and re-gression co-efficient obtained. The general-ized second-order polynomial used in re-sponse surface analysis was.
PEI (Y) = ßo + Σ Σßi Xi + Σ ßii X2j + Σ Σ ßßiiXi.Xj ………….(1)
Where Bo, Bi, Bij are the regression co-efficients for intercept, linear, quadratic and interaction terms, respectively, and Xi and Xj are the independent variables. The de-sign expert software was used to generate response surfaces contour plots while hold-ing a variable constant in the second-order polynomial model. When the results
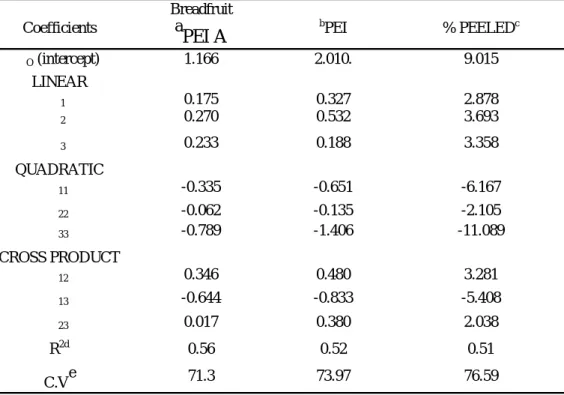
that is explained collectively by all the inde-pendent variables (concentration of lye, im-mersion temperature and time). The closer the value of R2 is to 100%, the better the empirical model. Results obtained in Table 3 revealed that R2 gave a good (50<R2>75) explanation of the variance for the three peeling efficiency responses for the lye-peeling of breadfruit. Inability of the model to give a very good (R2 <75%) explanation of the variance in the response suggest that it might be necessary to give consideration to other factors that are relevant to lye-peeling of breadfruit besides the three independent variables (lye-concentration, immersion tem-perature and time) used for the experiment. These factors may include; variation in agro-nomic characteristics within and among cul-tivars, the effect of the latex exudates on the attachment of pericarp of breadfruit to its mesocarp). R2 values in Table 3 also indi-cated that calculation of peeling efficiency index of breadfruit is best explained when it is based on the conventional way of peeling by women (11% mass of peels)
Coefficient of variation (C.V.) is a measure expressing standard deviation as a percentage of the mean (Thomas and Nelson, 1996). It described the extent to which the data were dispersed as indicated in Table 3. ANOVA of the regression parameters of the predicted response surface models for peeling effi-ciency of the fruit indicated the linear, quad-ratic and interaction ((cross product) did not produce a significant effect in each case (p>0.01 or p>0.05). Thus, none of the three effects of independent variables was primar-ily responsible for determining the term that may cause significant effects in the response (PEI). The models indicated that lye-concentration and temperature made more contribution to the response in term of lin-ear effects; this suggests that efficiency of ciency was calculated for breadfruit based
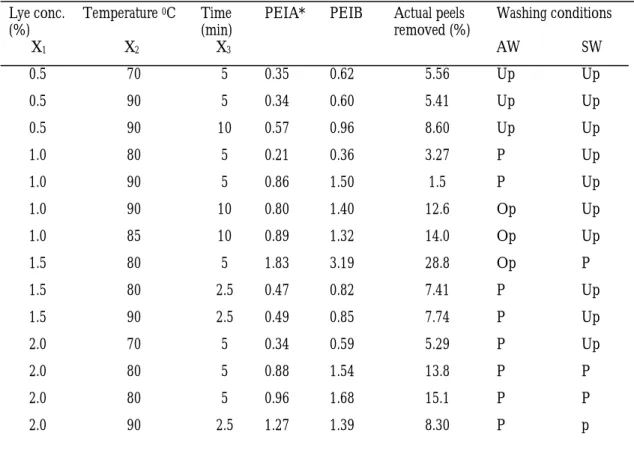
on the removal of either the pericarp alone or with some of the mesocarp as indicated in Table 1. The actual amounts of peels re-moved expressed as percentages also deter-mined index of efficiency and effectiveness of the peeling process. The washing condi-tion under which the peels were removed is as stated in Table 1.
In RSM, natural variables are transformed into coded variables which are dimen-sionless and having a mean zero and the same spread of standard deviation (Meyers and Montgomery, 2002). An appropriate range for each of the three variable factors in Table 1 was used to determine the lower, middle and upper design points for RSM in coded and natural (uncoded values) (Table 2).
Multiple regression equation was generated to relate response variable to coded levels of independent variable using least squares technique (Myers and Montgomery, 2002) to predict quadratic polynomial models for the respective peeling efficiency index (PEl). Analysis of variance (ANOVA) was used to access the extent to which the se-lected quadratic models adequately repre-sented the data obtained for the peeling ef-ficiency (Liyama-Pathirana and Shahidi, 2005). The result of ANOVA for the re-spective peeling efficiencies (responses) with their corresponding regression coeffi-cients of multiple determinations (R2) for the fruit generated by the software is shown in Table 3. Equation (1) was fitted to each of the dependent variables. The adequacy and goodness of fit were evaluated using the regression coefficient (R2) and the sum square of lack of fit respectively. R2 is the percent of variance in the dependent vari-ables (PEIA, PEIB and actual % peeled)
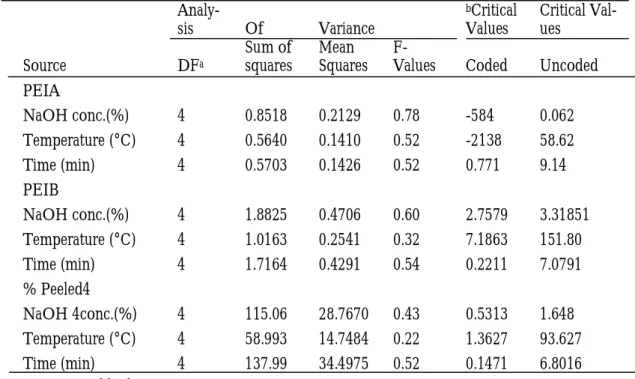
peel (PEIA) or % peeled. Result of ridge analysis (Table 4) had also indicated that maximum efficiency responses at these choices of peeling efficiency (PEIA and % peeled) for breadfruit were 0.1 to 1.7% lye concentration, 58.6OC immersion tempera-ture and 6.8 to 9.1 min immersion time.
Verification experiments were performed as these predicted conditions that were derived from ridge analysis or RSM to verify whether actual peeling could be achieved at the pre-dicted range (i.e., to confirm the relationship between statistical prediction and actual ex-perimental results). It was observed that ac-tual peeling of breadfruit was achieved within the predicted range (1.6%, 80°C and 5 min) irrespective of the washing conditions that was employed; thus confirming the va-lidity of the models. However, the use of abrasive washing made it possible to achieve lye-peeling of breadfruit 1.0%, 80°C and 5min of lye-concentration, immersion tem-perature and time respective
peeling increases as lye-concentration and temperature increase.
The relation between independent and de-pendent variables was viewed through a three dimensional representation of the re-sponses surface concreted by the models for the entire peeling efficiencies. The analysis of the contour surface responses revealed that the stationary points for Peel-ing Efficiency indices were at maximum (Table 5). Ridge analysis was performed to determine the critical levels of the design variables that produce the maximum re-sponse. The critical values in term of coded and uncoded variables for the peeling effi-ciencies (responses) are given in Table 4. Predicted critical values for lye-peeling of breadfruit suggest the desirability of using lower concentration of lye (0.06%), tem-perature (58.6%) but higher immersion time (9.14 min) to achieve the peeling of the fruit on the basis of 11% mass of peels (PEIA) than to use the other peeling efficiency re-sponses.
Verification experiment
Result of R2 (Table 3) had indicated the de-sirability of basing the peeling efficiency index (PEI) of breadfruit on 11% mass of
Lye conc. (%)
Temperature 0C Time
(min)
PEIA* PEIB Actual peels
removed (%)
Washing conditions
X1 X2 X3 AW SW
0.5 70 5 0.35 0.62 5.56 Up Up
0.5 90 5 0.34 0.60 5.41 Up Up
0.5 90 10 0.57 0.96 8.60 Up Up
1.0 80 5 0.21 0.36 3.27 P Up
1.0 90 5 0.86 1.50 1.5 P Up
1.0 90 10 0.80 1.40 12.6 Op Up
1.0 85 10 0.89 1.32 14.0 Op Up
1.5 80 5 1.83 3.19 28.8 Op P
1.5 80 2.5 0.47 0.82 7.41 P Up
1.5 90 2.5 0.49 0.85 7.74 P Up
2.0 70 5 0.34 0.59 5.29 P Up
2.0 80 5 0.88 1.54 13.8 P P
2.0 80 5 0.96 1.68 15.1 P P
2.0 90 2.5 1.27 1.39 8.30 P p
Table 1: Experimental Data on Lye-peeling of Breadfruit
*PEIA= Peeling efficiency based on 11% mass of peels (i.e. removal of pericarp with some mesocarp)
PEIB= Peeling efficiency based on 6% mass of peels (i.e. removal of pericarp alone)
(%) = Peeling efficiency based on actual mass of peels removed from fruit expressed as percentages AW = Abrasive washing Soft washing P = Peeled
OP = Over peeled UP = under peeled
Independent variables Units Symbol Breadfruit
Lye- concentration % X1 - 1 0 +1
Immersion OC X2 05 1.25 2.0
Immersion time Min X3 70 80 90
2.5 6.25 10
Table 2: Independent Variables and their Coded and Uncoded Values used for Optimization
Breadfruit
Coefficients a
PEI A
b
PEI % PEELEDc
βO (intercept) 1.166 2.010. 9.015
LINEAR
β1 0.175 0.327 2.878
β2 0.270 0.532 3.693
β3 0.233 0.188 3.358
QUADRATIC
β11 -0.335 -0.651 -6.167
β22 -0.062 -0.135 -2.105
β33 -0.789 -1.406 -11.089
CROSS PRODUCT
β12 0.346 0.480 3.281
β13 -0.644 -0.833 -5.408
β23 0.017 0.380 2.038
R2d 0.56 0.52 0.51
C.Ve 71.3 73.97 76.59
Table 3: Regression coefficients of the predicted quadratic polynomial models for peeling efficiency of breadfruit
a….Peeling efficiency index (PEL A) based on 11% mass of peels
b….Peeling efficiency index (PEl B) based on 6% mass of peel for breadfruit c…..Peeling efficiency based on actual mass of peels removed.
Analy-sis Of Variance
bCritical
Values
Critical Val-ues
Source DFa
Sum of squares
Mean Squares
F-Values Coded Uncoded
PEIA
NaOH conc.(%) 4 0.8518 0.2129 0.78 -584 0.062
Temperature (°C) 4 0.5640 0.1410 0.52 -2138 58.62
Time (min) 4 0.5703 0.1426 0.52 0.771 9.14
PEIB
NaOH conc.(%) 4 1.8825 0.4706 0.60 2.7579 3.31851
Temperature (°C) 4 1.0163 0.2541 0.32 7.1863 151.80
Time (min) 4 1.7164 0.4291 0.54 0.2211 7.0791
% Peeled4
NaOH 4conc.(%) 4 115.06 28.7670 0.43 0.5313 1.648
Temperature (°C) 4 58.993 14.7484 0.22 1.3627 93.627
Time (min) 4 137.99 34.4975 0.52 0.1471 6.8016
Table 4: Analysis of variance of the factors and the critical values obtained from ridge analysis of the response surface for peeling efficiency index
a…… Degree of freedom
b…… Critical value obtained from ridge analysis *…… not significant at 5%
Efficiency index
Eigen values Stationary point
Predicted valuesa
Observedb
PEIA 0.0489, -0.273,-0.9654 Maximum 0.8286 0.923
PEIB -004013,-0.5121-1.6399 Maximum 4.3927 1.1681
% peeled -1.5247, -5.3045 -12.53 Maximum 22.5428 12.624
Table 5: Comparison of predicted and experimental values for response variables of breadfruit
a.. Predicted value using ridge analysis of response surface quadratic model
ACKNOWLEDGEMENTS
The authors appreciate the late Dr. J.O. Aina for his input into the compilation of the report, Prof. C. T. Akanbi for reading and editing of the manuscript and Mrs. Bossey of the International Institute of Tropical Agriculture (IITA) Ibadan provid-ing relevant professional advice.REFERENCES
Adewusi, S.R.A., Akpobome, J.U., Osuntogun, B.A. 1995. Studies on the car-bohydrate content of Breadfruit (Artocarpus
communist Frost) from South-western
Nige-ria.. Starch/Starke, 47(2): 289-294.
Floros, J.D., Chinnan, M.S. 1987. Opti-mization of Pimento Pepper Iyre Peeler Process using response surface methodol-ogy. Transactions of ASAE, 30 (2): 560 -565. Graham, H.D., De-Bravo, E.N., (1981). Composition of the breadfruit. Journal of
Food Science, 535 -539.
Liyana–Pathirana, C., Shahidi., F. 2005. Optimization of extraction of phenolic compounds from wheat using response sur-face methodology. Food Chem. 936: 47 – 56. Loos, P.J., Hood, l.F., Graham, H.D., 1981. Isolation and characterization of Starch of Breadfruit. Cereal Chem., 58(4): 284 -286.
Morton, J., 1987. Breadfruit: Artocarpus altilis. Fruit of warm climates. Morton, J.F. Miami: FL. 50-58
Montgomery, D.C., 2001. Design and analysis of experiments (5th Ed) New York: Wiley.
Myers, R.H., Montogomery, D.C., 2002. Response Surface Methodology: process and product Optimizatrion using designed Ex-periments (2ND ED) New York: Wiley. 6-20. Nwokolo, E., Smartt, J., 1996. African breadfruit (Treculia Africana) and Polynesian breadfruit (Artocarpus altilis). Legume and Fruit Nutrition, p. 315-353.
Olatunji, O., Akinrele, I.A., 1978. Com-parative rheological properties and bread qualities of wheat flour diluted with tropical tuber and breadfruit flour. Cereal Chem., 55(1): 1-6.
Omobuwajo, T.V., Wilcox, A., 1989. Mi-crobes associated with field spoilage of breadfruit, Lebensm-Wissv. Technol, 22: 175-178.
Pantastico, E.B., 1975. Post-harvest physi-ology, handling and utilization of Tropical and sub-tropiocal fruits and vegetables. Senanayake, S.P.J.N., Shahidi, F., 2002. Lipase catalyzed incorporation of docoosa-hexaenoicx acid (DMA) into borage oil: Op-timization using response surface methodol-ogy. Food Chem., 77: 115-123.
Sreeparayanan, V.V., Rubikala, M., Jayas, D.S., 1995. Lye-peeling of cassava (Manihot esculenta Crantz). Agricultural
Engi-neering Journal, 3 (4): 163-172.
Talburt, W., Smia, O., 1967. Potato proc-essing. 2nd ed. West port, CT: AVI publish-ing
Thompson, A.K. Bean, B.O., Perking, C. (1974). Storage of fresh breadfruit. Tropical
Thomas, J.R., Nelson, J.K., 1996. Research methods in physical activity. 3rd edition. USA: Human Kinetics. P. 89-211.
Whistler, R.L., BeMiller, J.N., Pascall, E.F., (Eds.) (1984) Starch-chemistry and technology. London: Academic Press: 26-242.