Sharif University of Technology
Scientia IranicaTransactions B: Mechanical Engineering http://scientiairanica.sharif.edu
Impact of information technology on business
performance: Integrated structural equation modelling
and articial neural network approach
H. Sahin
a;and B. Topal
ba. Simav Vocational School, Dumlupinar University, 43500, Simav-Kutahya, Turkey, and Department of Industrial Engineering, Sakarya University, Sakarya, Turkey.
b. Faculty of Management, Sakarya University, Serdivan-Sakarya, Turkey.
Received 19 February 2018; received in revised form 8 May 2018; accepted 28 May 2018
KEYWORDS Business performance; Information
technology;
Information quality; Structural equation model;
Neural network.
Abstract. In today's globalizing world, also called the information age, information and information technologies are becoming increasingly important for businesses and have become an indispensable part of economic and social life. Nowadays, it is impossible to think of a business that is far from information technology; in addition, it is important to nd not only information, but also the highly accessible and reliable information. The important thing is to use information technologies eectively and eciently. Therefore, it is expected that the eective usage of information technology will have signicant positive eects on business performance. The aim of this study is to examine and analyze the impact of the intensive usage of information technologies on business performance in the supply chain process. A sequential, multi-method approach, integrating Structural Equation Modelling (SEM) with neural network analysis, was employed in this research. The information technology usage performance network was formed by using the SEM model, and the ANN model was used to predict a relationship between information technology usage levels and business performance by using these network outputs. Furthermore, the validity and reliability tests of the relevant model data were performed.
© 2018 Sharif University of Technology. All rights reserved.
1. Introduction
With the transition from the industrial to information society, rapid and incredible developments in informa-tion technologies have removed the borders in the glob-alizing world and rebuilt the world under the roof of information societies, which are in constant communi-cation and competition with each other. Developments in computer and communication technologies bring
*. Corresponding author. Tel.: +90 274 513 7250 / 1050; Fax: +90 274 513 53 16
E-mail address: [email protected] (H. Sahin) doi: 10.24200/sci.2018.20526
about a change in business activities in terms of cost, time, quality, and service. In particular, changes ex-perienced in information technologies cause signicant changes in the business structure and lead businesses to new ways of penetrating new markets, presenting their products and services, enhancing the eciency of their processes, customer acquisition, and ensuring customer loyalty [1]. Information technology can be considered as all tools, applications, and services that are used to provide information to organizations, which are rapidly developing [2]. As a result, information technology is best dened as \a general purpose technology", not as a traditional capital investment [3]. There have been signicant developments in information technologies over the last 20 years. With these technologies, data
processing has become faster and costs reduced and more reliable than ever [4]. The increasing usage of information technologies has resulted in the need to assess the eects of these technologies on productivity. In the literature, the level of the use of information technologies in businesses operating in dierent indus-tries has been examined, and the eects of the use of information technologies on the organizational perfor-mance of these businesses have been investigated [5-12]. Furthermore, the relationship among information tech-nology, organizational transformation, and business performance has been examined in dierent studies [13-19]. Dierent from the studies in the literature, the eect of the use of information technologies on business performance has been investigated in this study with an integrated model. Supply chain management as a concept has been widely accredited to a Booz Allen consultant named Keith Oliver who, in 1982, dened the concept as follows: \Supply Chain Management (SCM) is the process of planning, implementing, and controlling the operations of the supply chain with the purpose of satisfying customer requirements as eciently as possible. Supply chain management spans all movement and storage of raw materials, work-in-process inventory, and nished goods from point-of-origin to point-of-consumption". The role of informa-tion technology in SCM was highlighted in the past; for example, integrated information systems can lead to the improved business performance of companies in a supply chain [20]. At the intersection of information technology and SCM, three studies deal with a wider domain by addressing the use and eects of information technology for SCM [21-23]. In fact, SCM is the management of a set of interrelated issues that is in line with customers' satisfaction [24]. For this purpose, in this study, a network of the relationships between the usage of information technologies and performance was established with the SEM model, and the relationship between the information technology usage levels and business performance was predicted by using the outputs of this network with the ANN model. Furthermore, the validity and reliability tests of the data were performed, and the analyses were performed with the related models.
2. Research method
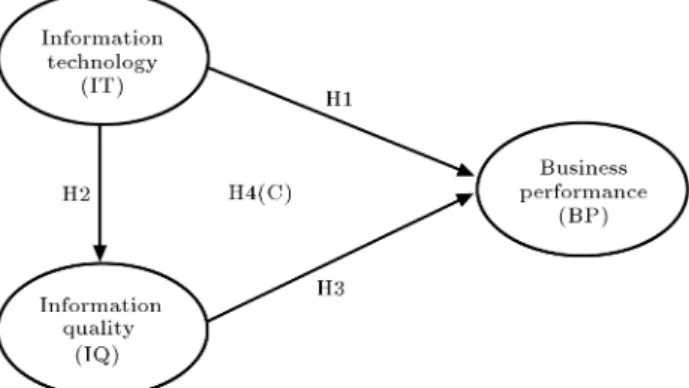
The independent variable of the study was determined to be the usage of information technologies, the de-pendent variable to be the business performance, and the mediator variable to be the information quality (Figure 1). Path c in Figure 1 (Hypothesis 4) can also be dened as the indirect eect of the indepen-dent variables on the depenindepen-dent variable through the mediator variable [25,26]. After the participation of the mediator variable, in addition to the direct eect
Figure 1. The proposed conceptual model and research hypotheses.
of the independent variable on the dependent variable, the indirect eect arising from the mediator variable emerges. Moreover, the variance change introduced by the indirect eect can be evaluated [27]. The statis-tical signicance of the indirect eect is obtained by the Sobel test statistic (http://www.danielsoper.com /statcalc3/calc.aspx?id=31). The following hypotheses were tested with the research model:
Hypothesis 1 (H1): There is a positive relationship between information technologies and business per-formance;
Hypothesis 2 (H2): There is a positive relationship between information technologies and information quality;
Hypothesis 3 (H3): There is a positive relationship between information quality and business perfor-mance;
Hypothesis 4 (H4): Information quality has a me-diator role in the relationship between information technologies and business performance.
The aim of this study is to examine and analyze the eects of the intensive use of information tech-nologies on business performance in a supply chain process. Therefore, an integrated model was created by developing a Structural Equation Model (SEM) and an Articial Neural Network (ANN) model considering the outputs of this model. The network of the relationships between the usage of information technologies and performance was established with the SEM model, and the relationship between the information technology usage levels and business performance was estimated by using the outputs of this network with the ANN model. The survey technique was used as a data collection tool in the study. In this study, within the scope of the reliability and validity studies of the scales, the conrmatory factor analysis was performed with AMOS 22.0, and item analyses were performed with the SPSS 21.0 program.
In addition, the structural equation model and articial neural networks have been integrated in many studies, and successful results have been achieved. Some of these are as follows: the estimation of the use of social media in higher education [28], supply chain [29], health supply chain [30], customer satis-faction and loyalty [31], mobile learning [32], open Inter-Organizational Systems (IOS) adoption [33,34], the determinants of NFC-enabled mobile credit [35], m-commerce adoption [36,37], cognitive engagement [38], and adoption of mobile entertainment services [39].
While structural equation modelling is often used to test hypothetical relationships, it sometimes sim-plies the complexities of relationships that may exist between variables [31,35-37,40]. This article uses a two-step SEM and neural network model to characterize the relationships between the variables. Whereas the SEM is a widely used statistical model to test linear relationships between the proposed hypotheses, the method may not be useful if the relationship between decision variables is not linear. Under these conditions, neural network modelling helps to understand linear and nonlinear relationships between related decision variables. This is one of the frequent advantages of neural network modelling. It is dicult to use neural network models to test hypotheses and understand causal relationships [28,0,41]. For this reason, this study integrates structural equation modelling with the articial neural network analysis to better understand the factors that determine the impact of information sharing in business performance measures.
3. Methodology
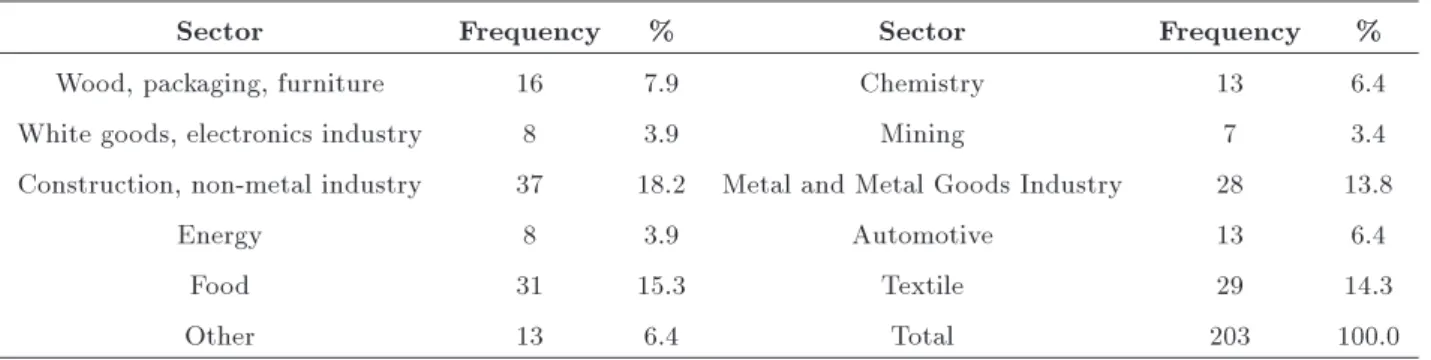
The businesses included in the study were randomly selected from the rst 1000 large companies determined by ISO, and prepared questionnaire forms were sent to the businesses via e-mail. As of the beginning of 2016, a total of 220 companies returned; however, since 17 of these were lled in the questionnaire in an incomplete and inappropriate way, data of the remaining 203 com-panies were analysed. Thus, 20.3% of the main mass was taken into consideration within the scope of the
study (Table 1). The survey questions were prepared on a 7-point Likert-type scale to provide a more precise assessment. In this part of the study, the IT usage levels in ISO 1000 businesses and how IT usage levels varied according to the company characteristics were investigated. Hypotheses created for this purpose were tested with appropriate statistical methods.
The ANN model was created by taking into account the variables for which the meaningful relation-ships between them were proved with the SEM model. ANNs are mathematical systems that mimic the way in which the human brain works [42]. Moreover, the articial neural network is generally an information processing system and a computer program that imi-tates the neural network system of the human brain [43-45]. The ANN is made up of interconnected processing units called neurons. The applied articial neural network has three layers: the input layer, the hidden layer, and the output layer [46]. The nodes in each layer after zero are assigned weights (synaptic weight), and a layer or a node has an associated linear or non-linear activation function [5,36]. ANN models have capabilities to capture linear as well as non-linear relationships between independent variables and a dependent variable. The ANN models have been shown to perform better than traditional statistical models such as MLR and logistic regression [47]. The ANN also has some disadvantages; for example, it is not suitable for testing research hypotheses because of its `Black Box' operations [39]. The ANN research is based on learning from data to mimic the biological capability of linear and nonlinear problem solving [48]. 4. Analytical methods and results
This study adopted the multi-analytic approach by combining the SEM with neural network analysis derived from Scott and Walczak [38]. The SEM examined the reliability and validity of the measures, and the neural network was used to predict business performance in 1000 ISO manufacturing businesses. In order to have a good quality neural network, it is vital to determine the required input variables. Similar to
Table 1. Sectoral distribution of companies participating in the study.
Sector Frequency % Sector Frequency %
Wood, packaging, furniture 16 7.9 Chemistry 13 6.4
White goods, electronics industry 8 3.9 Mining 7 3.4
Construction, non-metal industry 37 18.2 Metal and Metal Goods Industry 28 13.8
Energy 8 3.9 Automotive 13 6.4
Food 31 15.3 Textile 29 14.3
Table 2. Descriptive statistics of the variables.
Scale and subdimensions Number of items Mean St. Dv. Skewness Kurtosis Cronbach's alpha
Information quality 7 6.01 0.81 -0.74a 0.85 0.89
Information technologies 16 5.40 1.01 -0.69 0.49 0.92
Cost performance 4 4.57 1.32 0.11 0.16 0.89
Flexibility performance 3 4.83 1.26 0.27 -0.67 0.87
Response performance 3 5.11 1.20 -0.21 -0.39 0.84
Delivery performance 6 5.07 1.10 0.14 -1.13 0.77
Financial performance 5 4.66 1.07 0.55 0.49 0.90
a: After the inversion and square root transformation
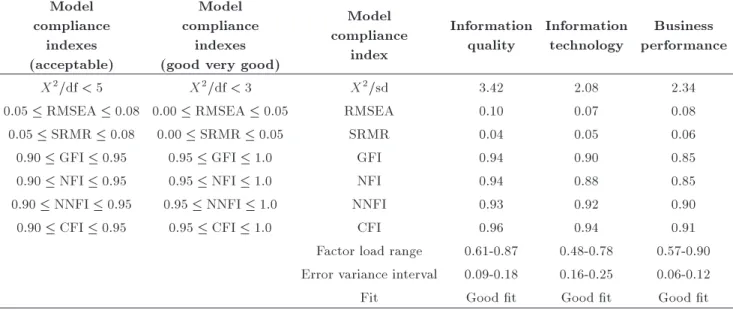
Table 3. Model t indices [25,26] and the results of the DFA and reliability analysis. Model
compliance indexes (acceptable)
Model compliance
indexes (good very good)
Model compliance
index
Information quality
Information technology
Business performance
X2=df < 5 X2=df < 3 X2=sd 3.42 2.08 2.34
0:05 RMSEA 0:08 0:00 RMSEA 0:05 RMSEA 0.10 0.07 0.08
0:05 SRMR 0:08 0:00 SRMR 0:05 SRMR 0.04 0.05 0.06
0:90 GFI 0:95 0:95 GFI 1:0 GFI 0.94 0.90 0.85
0:90 NFI 0:95 0:95 NFI 1:0 NFI 0.94 0.88 0.85
0:90 NNFI 0:95 0:95 NNFI 1:0 NNFI 0.93 0.92 0.90
0:90 CFI 0:95 0:95 CFI 1:0 CFI 0.96 0.94 0.91
Factor load range 0.61-0.87 0.48-0.78 0.57-0.90 Error variance interval 0.09-0.18 0.16-0.25 0.06-0.12
Fit Good t Good t Good t
the approach of Scott and Walczak [38], the inputs to the neural network are derived from the SEM's signicant and reliable hypothesized variables. The next sections discuss the results of both the SEM and neural network. The descriptive statistics of the independent and dependent variables of the study are presented in Table 2.
4.1. Structural model results
Table 3 shows the t index values obtained as a result of the conrmatory factor analysis of the Information Quality Scale (IQ), Information Technology Scale (IT), and Business Performance Scale (BP). The results of research Models 1 and 2 are presented in Table 4. As a result of the covariance linkages made in accordance with the modication suggestions, it was determined that the t indices reached acceptable levels and the models adjusted well. It was found that the scales and a single factor structure were appropriate, factor loadings
were adequate, and t-values were signicant at 0.01 for all items.
4.2. Articial neural network results
The Multi-Layer Perceptron (MLP) training algorithm was used to train the neural network. MATLAB was used as the software package to perform the neural network test. Cross-validations were made to avoid excessive mismatch of the model. As there is no heuristic way for determining the number of hidden nodes in a neural network, a preliminary network was examined using 1-10 hidden nodes. The Root Mean Square Error (RMSE) was used to measure the accuracy of the model over ten conrmations. It was found that using two hidden nodes was complex enough to map the datasets without incurring additional errors to the overall model. The input variables consisted of the two signicant variables from the SEM, while the output layer was business performance. Table 5 and
Table 4. Results of the research model.
Path Direct impact Mediator variable Indirect impact Hypothesis
(SE) R2 IS SBT R2
IT ! BP 0.23 (0.10) 0.05 H1: Accepted
IT ! IQ 0.26 (0.07) 0.07 H2: Accepted
IQ ! BP 0.06 (0.11) 0.01 H3: Rejected
IT ! BP IQ 0.02 0.74 0.09 H4: Rejected
X2=df: 1.56, RMSEA: 0.05, SRMR: 0.06, GFI: 0.85
Note: IS = Impact Size; SBT: Sobel test statistic;: p < 0:05;: p < 0:01;
IT: Information Technology; IQ: Information Quality; BP: Business Performance.
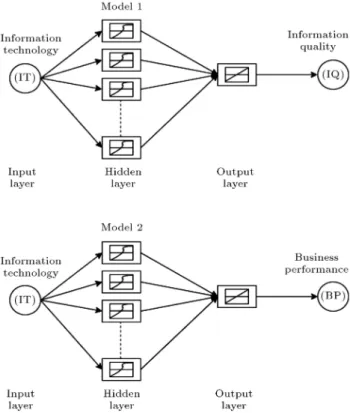
Table 5. Model of articial neural networks.
Performance measures
Model Output element (dependent variable) Input element (element independent) 1 Information Quality (IQ) Information Technology (IT) 2 Business Performance (BP) Information Technology (IT)
Figure 2 show the neural network structure designed in this study. The gure shows that the six predictors from the SEM signicant variables were used as inputs for the neural network. In this study, it was attempted to take advantage of both advanced statistical models (SEM-ANN modelling). Ten-fold cross-validation was performed whereby 75% of the data were used as the training net, leaving the remaining 25% of the data used to measure the prediction accuracy of the trained network.
Figure 2. Articial neural network architectures for proposed Models 1 and 2.
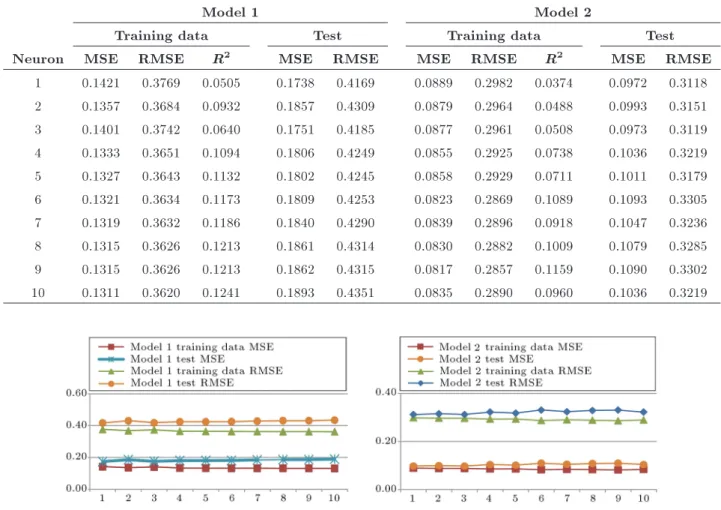
Table 6 lists the performance values for the training and test data of the ANN model, starting from neuron 1 to neuron 10. As the number of neurons increases, the performance for training data increases, while it decreases for the test data. The estimated performance (RMSE) changes for the training, and test data of the ANN model in the case of the use of 10 neurons are indicated in Figure 3. Figures 4 and 5 show a graph of the change in the real output values and the estimated values of Models 1 and 2. Except for some points, error values usually occur around the value of 0. The proximity of the error value to zero means that the value estimated by the model in return for the related input values is close to the real value. 5. Conclusion and recommendations
Nowadays, it is not possible to think of a business that is far from information technology, and it has become important not only to access information, but also to access it in the fastest and most reliable way. In this study, the eects of the intensive usage of information technologies in the supply chain process on business performance were examined. In order to examine the model, a sequential, multi-method approach integrating both the Structural Equation Modelling (SEM) with the neural network analysis was employed. The network of the relationships between the usage of information technologies and business performance was established with the SEM model, and the relationship between the information technology usage levels and business performance was estimated by using the outputs of this network with the ANN model. With the SEM model created, it was proved that there was a signicant positive relationship between infor-mation technologies and business performance as well
Table 6. MSE and RMSE values of articial neural networks.
Model 1 Model 2
Training data Test Training data Test
Neuron MSE RMSE R2 MSE RMSE MSE RMSE R2 MSE RMSE
1 0.1421 0.3769 0.0505 0.1738 0.4169 0.0889 0.2982 0.0374 0.0972 0.3118 2 0.1357 0.3684 0.0932 0.1857 0.4309 0.0879 0.2964 0.0488 0.0993 0.3151 3 0.1401 0.3742 0.0640 0.1751 0.4185 0.0877 0.2961 0.0508 0.0973 0.3119 4 0.1333 0.3651 0.1094 0.1806 0.4249 0.0855 0.2925 0.0738 0.1036 0.3219 5 0.1327 0.3643 0.1132 0.1802 0.4245 0.0858 0.2929 0.0711 0.1011 0.3179 6 0.1321 0.3634 0.1173 0.1809 0.4253 0.0823 0.2869 0.1089 0.1093 0.3305 7 0.1319 0.3632 0.1186 0.1840 0.4290 0.0839 0.2896 0.0918 0.1047 0.3236 8 0.1315 0.3626 0.1213 0.1861 0.4314 0.0830 0.2882 0.1009 0.1079 0.3285 9 0.1315 0.3626 0.1213 0.1862 0.4315 0.0817 0.2857 0.1159 0.1090 0.3302 10 0.1311 0.3620 0.1241 0.1893 0.4351 0.0835 0.2890 0.0960 0.1036 0.3219
Figure 3. Performance change (MSE and RMSE) according to the number of neurons in Models 1 and 2.
Figure 4. Real values and the change in estimations made according to Model 1.
Figure 5. Real values and the change in estimations made according to Model 2.
as between information technologies and information quality. On the other hand, estimations with the low error level were obtained for business performance with the ANN model created in the framework of these signicant relationships. With the predictive analytic SEM-ANN approach [31-34,36,38,39], the study may also provide a methodological contribution to statisti-cal analysis techniques.
This study has several limitations. Firstly, this study was carried out on the ISO 1000 manufacturing rms in Turkey; therefore, its results may not be generalizable to other companies. As a result of these limitations, future research may be conducted by per-forming a comparative study of other manufacturing rms. Secondly, a cross-sectional research approach was used, and the eect of time was not examined. It
is suggested that a longitudinal study be carried out in the future. Finally, the study also examined the eect of information technology on business performance with the SEM-ANN model. Future research can in-crease the model's power by using articial intelligence technologies such as fuzzy logic, genetic algorithms, and expert system with SEM.
References
1. Papazoglou, M. and Tsalgatidou, A. \Business-to-business electronic commerce issues and solutions", Decision Support Systems, 29(4), pp. 301-304 (2000).
2. Webster, F. \The information society: conceptions and critique", Encyclopedia of Library and Information Science, 58(21), pp. 74-112 (1996).
3. Brynjolfsson, E. and Hitt, L.M. \Beyond computation: information technology, organizational transformation and business performance", The Journal of Economic Perspectives, 14(4), pp. 23-48 (2000).
4. Byrd, T.A. and Davidson N.W. \Examining possible antecedents of IT impact on the supply chain and its eect on rm performance", Information and Manage-ment, 41, pp. 243-255 (2003).
5. Boran, S. and Diren, D.D. \Analysis of out of control signals in multivariate processes with multilayer neural network", Acta Physica Polonica A, 132(3), pp. 1054-1057 (2017).
6. Bolvar-Ramos, M.T., Garca-Morales, V.J., and Martn-Rojas, R. \The eects of information technol-ogy on absorptive capacity and organisational perfor-mance", Technology Analysis & Strategic Management, 25(8), pp. 905-922 (2013).
7. Chen, Y., Wang, Y., Nevo S., Benitez, J., and Kou, G. \Improving strategic exibility with information tech-nologies: insights for rm performance in an emerging economy", Journal of Information Technology, 32(1), pp. 10-25 (2017).
8. Chae, H.C., Koh, C.E., and Prybutok, V.R. \Infor-mation technology capability and rm performance: contradictory ndings and their possible causes", MIS Quarterly, 38(1), pp. 305-326 (2014).
9. Chakravarty, A., Grewal, R., and Sambamurthy, V. \Information technology competencies, organizational agility, and rm performance: enabling and facilitating roles", Information Systems Research, 24(4), pp. 976-997 (2013).
10. Garrison, G., Wakeeld, R.L., and Kim, S. \The eects of IT capabilities and delivery model on cloud computing success and rm performance for cloud supported processes and operations", International Journal of Information Management, 35(4), pp. 377-393 (2015).
11. Kasemsap, K. \The role of information system within enterprise architecture and their impact on business performance", Technology, Innovation, and Enterprise Transformation, pp. 262-284 (2015).
12. Keramati, A., Afshari-Mofrad, M., Behmanesh, I., and Gholami, R. \The impact of information tech-nology maturity on rm performance considering the moderating role of relational maturity: an empirical research", International Journal of Business Informa-tion Sys., 23(1), pp. 23-43 (2016).
13. Li, M. and Ye, L.R. \Information technology and rm performance: Linking with environmental, strategic and managerial contexts", Information & Manage-ment, 35(1), pp. 43-51 (1999).
14. Liu, Z., Prajogo, D., and Oke, A. \Supply chain technologies: linking adoption, utilization, and perfor-mance", Journal of Supply Chain Management, 52(4), pp. 22-41 (2016).
15. Peng, J., Quan, J., Zhang, G., and Dubinsky, A.J. \Mediation eect of business process and supply chain management capabilities on the impact of IT on rm performance: Evidence from Chinese rms", Interna-tional Journal of Information Management, 36(1), pp. 89-96 (2016).
16. Rivard, S., Raymond, L., and Verreault, D. \Resource-based view and competitive strategy: An integrated model of the contribution of information technology to rm performance", The Journal of Strategic Informa-tion Systems, 15(1), pp. 29-50 (2006).
17. Sahin, H. and Topal, B. \The eect of the use of infor-mation technologies in businesses on cost and nancial performance", International Journal of Engineering Innovations and Research (IJEIR), 5(6), pp. 394-402 (2016).
18. Weill, P. \The relationship between investment in information technology and rm performance: A study of the valve manufacturing sector", Information Sys-tems Research, 3(4), pp. 307-333 (1992).
19. Wu, F., Yeniyurt, S., Kim, D., and Cavusgil, S.T. \The impact of information technology on supply chain capabilities and rm performance: A resource-based view", Industrial Marketing Management, 35(4), pp. 493-504 (2006).
20. Thoni, A. and Tjoa, A.M. \Information technology for sustainable supply chain management: a literature survey", Enterprise Information Systems, 11(6), pp. 828-858 (2017).
21. Jain, V., Wadhwa, S., and Deshmukh, S.G. \Revisiting information systems to support a dynamic supply chain: Issues and perspectives", Production Planning & Control, 20(1), pp. 17-29 (2009).
22. Perego, A., Perotti, S., and Mangiaracina, R. \ICT for logistics and freight transportation: A literature review and research agenda", International Journal of Physical Distribution & Logistics Management, 41(5), pp. 457-483 (2011).
23. Zhang, X., Pieter van Donk, D., and van der Vaart, T. \Does ICT inuence supply chain management and performance? A review of survey-based research", International Journal of Operations & Production Management, 31(11), pp. 1215-1247 (2011).
24. Rahimi, Y., Tavakkoli-Moghaddam, R., Shojaie, S., and Cheraghi, I. \Design of an innovative construction model for supply chain management by measuring agility and cost of quality: An empirical study", Scientia Iranica, 24(5), pp. 2515-2526 (2017).
25. Bayram, N., Introduction to Structural Equation Mod-eling, Ezgi Bookstore, Bursa (2010).
26. Cokluk, O., Sekercioglu G., and Buyukozturk, S., Multivariate Statistics for Social Sciences, Pegem Pub-lications, Ankara (2010).
27. Meydan, C.H. and Sesen, H., Structural Equation Mod-eling, AMOS Applications, Detay Publishing, Ankara (2011).
28. Sharma, S.K., Joshi, A., and Sharma, H. \A multi-analytical approach to predict the Facebook usage in higher education", Computers in Human Behavior, 55, pp. 340-353 (2016).
29. Wong, T.C., Law, K.M., Yau, H.K., and Ngan, S.C. \Analyzing supply chain operation models with the PC-algorithm and the neural network", Expert Sys-tems with Applications, 38(6), pp. 7526-7534 (2011).
30. Chong, A.Y.L., Liu, M.J., Luo, J., and Keng-Boon, O. \Predicting RFID adoption in healthcare supply chain from the perspectives of users", International Journal of Production Economics, 159, pp. 66-75 (2015).
31. Leong, L.Y., Hew, T.S., Lee, V.H., and Ooi, K.B. \An SEM-articial-neural-network analysis of the rela-tionships between SERVPERF, customer satisfaction and loyalty among low-cost and full-service airline", Expert Systems with Applications, 42(19), pp. 6620-6634 (2015).
32. Tan, G.W.H., Ooi, K.B., Leong, L.Y., and Lin, B. \Predicting the drivers of behavioral intention to use mobile learning: A hybrid SEM-neural networks approach", Computers in Human Behavior, 36, pp. 198-213 (2014).
33. Chong, A.Y.L. and Bai, R. \Predicting open IOS adoption in SMEs: An integrated SEM-neural network approach", Expert Systems with Applications, 41(1), pp. 221-229 (2014).
34. Chan, F.T. and Chong, A.Y. \A SEM-neural network approach for understanding determinants of interor-ganizational system standard adoption and perfor-mances", Decision Support Systems, 54(1), pp. 621-630 (2012).
35. Leong, L.Y., Hew, T.S., Tan, G.W.H., and Ooi, K.B. \Predicting the determinants of the NFC-enabled mobile credit card acceptance: A neural networks approach", Expert Systems with Applications, 40(14), pp. 5604-5620 (2013).
36. Chong, A.Y.L. \A two-staged SEM-neural network approach for understanding and predicting the de-terminants of m-commerce adoption", Expert Systems with Applications, 40, pp. 1240-1247 (2013).
37. Yadav, R., Sharma, S.K., and Tarhini, A. \A multi-analytical approach to understand and predict the mobile commerce adoption", Journal of Enterprise Information Management, 29(2), pp. 222-237 (2016).
38. Scott, J.E. and Walczak, S. \Cognitive engagement with a multimedia ERP training tool: Assessing computer self-ecacy and technology acceptance", In-formation & Management, 46(4), pp. 221-232 (2009).
39. Hew, T.S., Leong, L.Y., Ooi, K.B., and Chong, A.Y.L. \Predicting drivers of mobile entertainment adoption: a two-stage SEM-articial-neural-network analysis", Journal of Computer Information Systems, 56(4), pp. 352-370 (2016).
40. Sharma, S.K., Gaur, A., Saddikuti, V., and Rastogi, A. \Structural equation model (SEM)-neural network (NN) model for predicting quality determinants of e-learning management systems", Behaviour & Informa-tion Technology, 36(10), pp. 1053-1066 (2017).
41. Bejou, D., Wray, B., and Ingram, T.N. \Determinants of relationship quality: An articial neural network analysis", Journal of Business Research, 36, pp. 137-143 (1996).
42. Ozcanli, Y., Kosovali Cavus, F., and Beken, M. \Comparison of mechanical properties and articial neural networks modeling of PP/PET blends", Acta Physica Polonica A, 130(1), pp. 444-446 (2016).
43. Davraz, M., Kilincarslan, S., and Ceylan, H. \Predict-ing the Poisson ratio of lightweight concretes us\Predict-ing articial neural network", Acta Physica Polonica A, 128, pp. 184-186 (2015).
44. Tekin, H.O., Manici, T., Altunsoy, E.E., Yilancioglu, K., and Yilmaz, B. \An articial neural network-based estimation of Bremsstarahlung photon ux calculated by MCNPX", Acta Physica Polonica A, 132(3), pp. 967-969 (2017).
45. Erkaymaz, O., Ozer, M., and Yumusak, N. \Impact of small-world topology on the performance of a feed-forward articial neural network based on 2 dierent real-life problems", Turkish Journal of Electrical En-gineering & Computer Sciences, 22(3), pp. 708-718 (2014).
46. Gunturkun, R. \Estimation of medicine amount used anesthesia by an articial neural network", Journal of Medical Systems, 34(5), pp. 941-946 (2010).
47. Sharma, S.K., Govindaluri, S.M., and Al Balushi, S.M. \Predicting determinants of internet banking adoption: A two-staged regression-neural network approach", Management Research Review, 38(7), pp. 750-766 (2015).
48. Boutalbi, E., Ait Gougam, L., and Mekideche-Chafa, F. \Comparison of second order algorithms for func-tion approximafunc-tion with neural networks", Acta Phys-ica PolonPhys-ica A, 128, pp. 184-186 (2015).
Biographies
Hasan Sahin was born in 1978. He works as a lecturer in Simav Vocational College Kutahya Dumlupinar
University. He received his MSc at the Department of Industrial Engineering from Kutahya Dumlupinar University in 2005, Turkey. He began his PhD edu-cation at the Department of Industrial Engineering, Sakarya University, in 2011. His research subjects are supply chain, information technologies, structural equation model, and articial intelligence.
Bayram Topal was born in 1960. He received his MSc from Istanbul Technical University (ITU) and PhD from Istanbul University, Turkey. He is a Professor at Sakarya University of Business Faculty. His main research areas are supply chain, quality management, statistical analysis and applications, and time series analysis.