JULIA F. STORM. Tentative Identification of Organic Compounds in the Influent and Effluent of the High Point Westside
Wastewater Treatment Plant and Implications for Aquatic Toxicity (Under the direction of DR. FRANCIS A, DIGIANO).
After identifying an acute toxicity problem) the North Carolina Division of Environmental Management required the High Point Westside Wastewater Treatment Plant (WWTP) to
institute periodic biomonitoring and reduce the toxicity. Here» Westside WWTP samples are analyzed using the chemical-specific approach to toxicity reduction in which potential
toxicants are identified.
WWTP samples determined as "toxic" or "nontoxic" by Daphni a pulex bioassay, effluents from six categories of
industrial dischargers, and a domestic wastewater sample are analyzed for organic chemicals using continuous solvent
extraction of wastewater samples and broad spectrum GC/MS analysis. An extensive database is developed which includes aquatic toxicity data and tentatively identified compounds in WWTP samples and industrial effluents ranked according to their potential for contribution to toxicity.
samples. Treatment does not remove some organic compounds
exhibiting significant toxicity to aquatic organisms and
shown to be present in "toxic" effluents and industrial
samp 1es.
Toxicity of Westside yWTP influent and effluent may be
caused by a variety of industrial organic compounds in
concentrations that alone would not be sufficient to produce
a toxic effect but, because they may all produce toxicity by
the same mechanism (narcosis) and thus may exhibit
concentration addition, together produce a toxic effect.
Recommendations for further analyses include confirmation of
identifications using additional mass spectral techniques and
TABLE OF CONTENTS
ACKNOWLEDGEMENTS...v i
1 . INTRODUCTION...1
£, LITERATURE REVIEW...4
Approaches to the Study of Toxicants in Wastewater...^
Aquatic Toxicological Stud ies...11
3. TOXICITY BACKGROUND AND DESCRIPTION OF SITE...16
Westside WWTP Description...16
Division of Environmental Management Assessment of
Toxicity...19
High Point Toxicity Assessment Program...SI
^. MATERIALS AND METHODS...E^
Sample Collection, Storage, and
Handling...S-^-General Characteristics of Westside Wastewater Samples.26
Preparation and Analysis of Wastewater Samples...ES
Certainty Measures...32
Identification Process...32
Acute Toxicity Tests...33
5 . RESULTS...35
An Evaluation of Metals as Contributors to Toxicity....35
Organic Compounds Found in Wastewater Samples...37
Available Data Concerning Toxicological Significance of
Organic Compounds Identified in Wastewater Samples...^9
Organic Compounds Found in Industrial Effluent and
Domestic Wastewater Samples...^9
Organic Compounds Escaping Wastewater Treatment...56
6, DISCUSSION...61
Considerations for and Limitations to Data Interpretation...61
Framework for Data Interpretation...66
Possible Organic Compounds Contributing to Influent Toxicity...70
Aquatic Toxicological Data for Compounds of Non-Industrial Origin Tentatively Identified in Inf luent Samples...79
Possible Compounds Contributing to Effluent Toxicity...80
Compounds Escaping Removal...85
Toxicity of Comp lex Mixtures...86
7. CONCLUSIONS AND RECOMMENDATIONS...89
REFERENCES...9^
This research was made possible by a grant from the Water
Resources Research Institute, Project #86-10-70062.
Thanks go to members of my committee. Dr. Charles M. Weiss
and Dr. Russell F. Christman. I express special thanks to Dr.
Francis A. DiGiano, my advisor, for his guidance and
assistance.
f-of performing bioassays, providing information, and
collecting samples, I wish to thank Glenda Botenheimer, Bill
Frazier, (om Gore, Frank Ward, and others on the staff of the
Department of Water and Sewer of the City of High Point,
North Carolina. Appreciation goes to Carol Haney of the North
Carolina State University GC/MS Laboratory for performing
GC/MS analyses. For her assistance in the use of the computer
spreadsheet and other computer related matters, I thank Marty
McClellavid. And for the moral support, love, and
1. INTRQDUCTIUN
On February 3, 1987 the Water Quality Act of 1987
ammending the Clean Water Act of 1972 became law (Federal
Register , 1987). This act requires states to develop by
February 1989 water-quality based permit limitations for
toxic pollutants to meet water quality standards beyond what
can be accomplished by Clean Water Act technology-based
requirements. Effluent biomonitoring is a cornerstone of this
policy. EPA advocates its use as a problem identification
tool and the use of toxicity as a control parameter in
setting permit limits, where appropriate. EPA suggests that
particular attention should be focused on POTWs having
significant industrial input since studies have shown PQTW's
to be significant sources of toxic materials (Federal
Register, 198^).
ERA'S Complex EFfluent Toxicity Testing Program was
carried out in support of the development and implementation of this policy ("Validity . . . ," 1986). The Technical
Support Document for Water Quali ty-based Tox ics Contro1
(September, 1985) and a draft report, "Methods For Toxicity Reduction Evaluations," (January, 1987) were published to aid states and municipalities in implementing biomonitoring
programs. There has been much discussion concerning the
permitting (Roop and Hunsaker, 1985; Wall and Hanmer, 1987; Dunbar, 1987), some of it controversial (Carter, 19S6;
Grimes, 1987). For PQTWs in particular, EPA's time frame for
implementation is thought by some to be impractical, and its
support documents have been attacked as inadequate (Grimes,
1987).
The state of North Carolina has been a leader in the
implementation of a biomonitoring program for the control of
toxics from industrial and municipal dischargers. During the last several years, ^0'/, of over ^00 toxicity tests performed by North Carolina's Division of Environmental Management
(DEM) on industrial and municipal dischargers revealed effluent toxicity (Wall and Hanmer, 1987). Dischargers who have been identified as having toxic effluent are required to
institute their own biomonitoring program and are responsible for reducing the toxicity.
Identifying toxicity problems has proved much easier than effecting toxicity reduction. This is especially true when dealing with the situation of a municipal wastewater
treatment plant receiving a variety of industrial discharges. 1 he PQTW that is the focus of this research, the Westside Wastewater Treatment Plant (WWTP) in High Point, North
Carolina is an activated sludge treatment system having considerable industrial input. The Westside WWTP has had an
intermittent problem with effluent toxicity over a period of several years. Although the NC DEM studied the situation and
continued, and a toxicity reduction strategy is needed.
there are two approaches to toxicity reduction: (1) the
chemical-specific approach in which potential toxicants are
identified and (2) the whole effluent toxicity approach in
which treatment or control procedures ars investigated
without uncovering the specific chemical nature of the
toxicants. The former approach is the one applied in this
research.
I he specific objectives of this research are:
(1) to create a database of organic chemicals identified
frequently in Westside WWTP influent and effluent determined
to be acutely toxic in aquatic bioassays and in Westside WWTP
influent and effluent considered nontoxic,
(2) to analyze the implications regarding toxicity of the Westside WWTP influent and effluent by relating data from the toxicological literature to the findings of organic chemical
analyses,
(3) to investigate possible sources of agents thought to be
contributing to toxicity by analyzing industrial and domestic
wastewater samples, andApproaches to the Study of Toxicants in Wastewater
Approaches to the study of toxicants in wastewater may be
divided into three categories:1) mutagenicity testing of selected fractions of wastewaters
with various levels of chemical characterization of the
wastewater «
'd) identification of organic compounds in wastewater with
evaluation of environmental significance using the
toxicological literature, and
3) toxicity reduction evaluations of wastewater treatment
p1 ant ef fluent.Neal, et al. (1980) evaluated the performance of selected
advanced wastewater treatment plants for removing (or introducing) mutagenic chemicals and determined the
distribution of detected mutagenic activity among various
classes of chemical compounds. Salmonella, yeast, and
mammalian cells were used to determine mutagenic activity.
Sorption on polyurethane foam plugs, sorption on XAD resin,
and solvent extraction techniques were used to recover
organics from wastewater. Solvent extraction exhibited the best recovery of the three methods: XTOC recovered from
secondary effluent equaled 24.6. Aromatic and oxygenated
5
pre-chlorination secondary effluent from an activated sludge
treatment plant exhibited the greatest mutagenicity. The
presence of many non-extracted polar mutagens was
demonstrated.
Meier and Bishop (1985) evaluated conventional treatment
processes for removal of mutagenic activity from municipal
wastewaters. Their study investigated mutagen removal at
various stages of treatment at several treatment plants: one
receiving a heavily industrialized municipal waste, one
receiving primarily domestic waste» and the EPA Test and
bvaluation Facility in Cincinnati, Ohio, which receives an industrialized municipal waste. Mutagenicity tests were
performed using Salmonel1 a; wastewater was solvent extracted
at low and high pH values. Meier and Bishop concluded that
the mutagenic activity (both direct-acting and that requiring
metabolic activation) was primarily industrial in origin
because the domestic wastewater effluent exhibited a
substantially lower mutagenicity. Removal of mutagenic
activity by conventional treatment varied from none to two thirds of that initially present in the untreated wastewater,
leading to the conclusion that "an appreciable portion of the
responsible mutagens are relatively refractory to removal by
conventional primary and activated sludge treatment." In
contrast to findings of studies of drinking water,
chlorination of secondary effluent did not substantially influence the mutagenicity of wastewater effluent. Mutagenic
acid/neutral fraction. The base fraction of unchlorinated
secondary effluent had the greatest specific mutagenic
activity? although the acid fraction had the greatest overall
mutagenic activity.lt was recommended that identification of
compounds responsible for mutagenic activity be undertaken to
help determine the source and effective treatment methods for
thei r remova1.
Saxena and Schwartz (1979) investigated mutagens in
wastewaters at various treatment stages of three advanced wastewater treatment plants representing three categories of advanced treatment processes: biological» physical-chemical>
and land application. Influent to each of the three plants was secondary effluent from a conventional wastewater
treatment plant. Mutagenicity assays on Salmonella were performed with and without mammalian metabolic activation.
Both the biological and physical-chemical treatment processes
failed to remove and in some cases introduced mutagenic substances.
Happaport, et al. (1979) determined the mutagenicity (Ames bioassay) of five advanced wastewater treatment plants in
urban areas. The sources of these wastewaters ranged from completely domestic to mixed domestic-industrial wastes.
Wastewater samples of primary, secondary (pre-chlorination)» and post-secondary (dechlorination employed at some plants) were collected. Organic compounds in the wastewater samples were concentrated by XAD resins. Mutagenic concentrates were
extraction. Mutagenic samples were obtained only from plants having mixed domestic and industrial influent. Basic and neutral fractions appeared to contain most of the mutagenic activity. Nitrogenous bases, many of which are known to be mutagens, were probably among the compounds in the basic
fractions. It was suggested that the activated sludge process may have converted inactive substances into mutagens since activity was observed in secondary and post-secondary
effluents when none had been observed in primary effluent, even w^len tested at higher doses. They recommended compound
identification in mutagenic fractions as a goal of future
wor k .
Jungclaus, Lopez-Avila, and Hites (1978) analyzed the wastewater, receiving water, and receiving water sediments from a specialty chemicals manufacturing plant producing a
wide range of compounds including pharmaceuticals,
herbicides, antioxidants, thermal stabilizers, UV light
absorbers, optical brighteners, and surfactants. The
wastewater was treated by neutralization, biodegradation (in
trickling filters), and clarification, achieving about S5'/.
total BOD removal. Solvent extraction of water samples at low
and high pH values and vapor stripping techniques were
employed. Analysis was by GC/FID/ECD and 6C/MS.
Concentrations of the anthropogenic compounds ranged up to 15
ppm in the wastewater, 0.2 ppm in the river water, and
several hundred ppm in the sediments. Mammalian toxicity data
information involving Daphnia for s-triazine herbicides found in both the wastewater and river water were discussed.
Jungclaus, Lopez-Avia, and Hites concluded that "a human health hazard is difficult to assess, but the long-term,
low-level exposure to this wide variety of chemicals may have
contributed to the lack of biota in the area.."
fJames and Hites ( 1977) ident i f ied organic compounds
extracted from a dye manufacturing plant wastewater.
Treatment of the wastewater involved neutralization, aeration
lagoon biological degradation, and settling, resulting in 707. LOU and 85*/. BOD removal. Some compounds were not removed at all by the treatment process; others were degraded or altered to produce compounds not present initially. Toxicity of
compounds in both these categories were discussed in a limited manner. One compound found in the effluent is
patented as a nematocide but was present as an impurity in a
raw material used in dye manufacture. Games and Hites
emphasized the benefit of broad spectrum analysis, as target
compound analysis would not have discovered the potentially
toxic nematocide. They recommended that a rapid screening
test be developed to estimate the risk from chronic low level
exposure to compounds such as those from the dye plant
studied.
Brandes, Mount, and Wall (1986) used POTW effluent and
ambient (Cuyahoga River) toxicity testing to determine if the PCJfW in question was causing an adverse impact on the quality
9
the wastewater effluent ranged from 30 to 100 percent
effluent, values Brandes, et al. considered characteristic of
a moderately toxic effluent. To determine the cause of the toxicity, effluents were fractionated using solid phase extraction columns and fractions were tested for toxicity. Brandes, et al. concluded that toxicity was caused by
different toxicants on different occasions. A moderately
polar fraction containing 15 organic compounds, phenolic ones
in particular, was responsible for causing toxicity.
Uotts, et al. (1987) conducted a toxicity reduction
evaluation of the Patapsco wastewater treatment plant in
Baltimore, Maryland, an activated sludge biological treatment
plant receiving approximately 60*/. domestic and 30*/. industrial
influent. Periodic acute toxicity bioassays were conducted
with Cer iodaphnia dub ia and Mysidapsis bah la and chronic
bioassays with C. dub ia. They demonstrated that secondary treatment significantly reduces effluent toxicity. Toxicity tests of solid phase column fractions of the effluent
indicated that non-polar compounds were responsible for the toxicity. Preliminary data from GC/MS analysis of non-polar organic fractions indicated that the complexity of
chromatograms will make identification of specific compounds
difficult, Botts, et al. found that the specific substrate
utilization rate (at high COD levels) decreased for a "toxic"
wastewater compared to a "typical" domestic wastewater,
indicating that toxic compounds inhibit biodegradation at
effluents indicated no pass-through toxicity. Further batch
tests will determine the biodegradable component of
industrial effluents. Toxicity treatability tests of other
industrial effluents are planned.
Gary and Barrows (1981) conducted acute toxicity testing
using fathead minnows and Daphnia maqna of untreated and
treated effluents from five pesticide manufacturers, one
organic chemical manufacturer? and a bleached-kraft paper
mill. Results indicated that the average toxicity reduction
of the wastewater treatment plants was 98'/., although
significant mortality of test organisms still existed in
treated effluents. No characterization of the treated or
untreated effluents was made.
Horning, Robinson, and Petrasek (198'4-) used fathead minnow, Uaphn ia maqna, and rainbow trout acute toxicity
testing to evaluate the effectiveness of conventional
wastewater treatment. Influent to the pilot-scale treatment
system consisted of raw municipal wastewater mixed with a
known concentration of SS priority pollutants (nominally 50
ug/L of each). Concentrations of priority pollutants were
reduced by BOV. to greater than 99'/.. Toxicity reduction ranged
from 65'/. to 83'/.; however significant toxicity was still
present in the effluent. They concluded that removal
efficiency is not necessarily a good indicator of the toxic properties of a conventionally treated wastewater effluent.
They also submitted that "organism responses should be
11
characterization, in determining the suitability of an
effluent for discharge into the aquatic environment."
Aquat ic I ox icolog ical Stud ies
Research involving the toxicity of complex effluents to
aquatic organisms has benefited from studies of quantitative
structure-activity relationships (QSAR). In order to
accomplish quick, effective hazard assessment of the
tremendous number of industrial chemicals in use and being
developed for use and to focus efforts on the more
potentially hazardous chemicals, quantitative
structure-activity relationships have been developed to
predict toxicity.
Veith, et al. (19B3) mention reviews showing narcosis to
be a non-specific reversible physiological effect (central
nervous system depression probably due to membrane
perturbation, (Hermens, et al. 19S^a)) caused by a wide
variety of organic chemicals- Because this common mode of
action of toxicity to aquatic organisms exists,
structure-activity relationships may be determined.
Conversely, chemicals for which QSARs exist are assumed to
bring about acute toxicity by the same mode of action
(Hermens 198'^a). Veith, et al (1983) reported Konemann's
findings obtaining a linear relationship between the
n-octano1/water partition coefficient (log P) and acute
toxicity to guppies of 50 anaesthetizing industrial
chemicals with log P greater than 6 due to a deviation from
linearity for bioaccumulat ion with such compounds. Veith et
al. (1983) concluded that the 96 hour LC50 to fathead minnows
ot bO industrial alcohols, ketones, ethers, alkyl halides,
and substituted benzenes selected from the Toxic Substances
Control Act industrial inventory can be estimated by a
structure (n-octano1/water partition coefficlent)-toxicity
relat i onsh ip.
Bobra, et al. (1983b) concluded from a study of 33
hydrocarbons and chlorinated hydrocarbons and their acute
toxicities to Dj^ maqna in a closed system that different
alkanes, eyeloalkanes, monoaromatic, polynuclear aromatic,
and cl-) lor mated hydrocarbon solutions exhibit similar
toxicity at similar fractions of their saturation
concentration. She developed a formula from the relationship
she observed for estimating the LC505 of compounds like those
she studied:
O.'d X subcooled liquid solubility xS for linear compounds
or xO.33 for small cyclics or xl for large molecules.The advantage of this model to those using logP values is
that bioconcentration is taken into account, so that biotic
concentration is being reflected in the ratio of the
chemical's solubility in the organism to its subcooled liquid
solubility. Bobra submitted that the limits of this
predictive model for other compounds should be investigated.
In another study (19a3a), she showed that the model can be
13
In an examination of QSAR models, Bobra, et al. (1985)
suggested that when presenting QSAR data logarithmic plots of
toxic concentration versus both solubility and o/w partition
coefficient be prepared. In the case of the acute toxicity of
cfi lorobenzenes to D_^ maqna, the results showed that the
nature of the toxic effect is nonspecific and that the toxic
effect occurs when a critical concentration of toxicant is
reached within the organism, i.e., the EC50 is controlled
primarily by organism/water partitioning. Call, et al.
(1985) developed a model based on partition coefficient for
predicting subchronic toxicities to fathead minnows of ten
narcotizing chemicals (ketones, benzenes, ethers, and alkyl
halides). The model estimated maximum acceptable toxicant
concentration (MATC).
Studies of the toxicity of mixtures of organic chemicals
to LK_ maqna using both experimental and QSAR-estimated
toxicities utilize Konemann's mixture toxicity scale
(Hermens, et al., 198^a) to describe the type of joint action
exhibited by the mixture of chemicals, in which concentration
addition is indicated by a mixture toxicity index of 1.
Studies of chemical mixtures including industrial chemicals
occurring in wastewater and of particular industrial
wastewaters have been conducted (Broderius and Kahl, 1985;
Hermens, et al . , 1985; Hermens, et al . , 198'^a and 19a'^b;
Bobra, et al., 1983a).
mode of action (narcosis) and tested in equal fractions of
their LCSO's were investigated by Broderius and Kahl <1985)
and Hermens, et al. (1985). All the mixtures displayed a
concentration additive acute joint action. The same
conclusion was reached by both studies: even at no-effect
levels of individual toxicants combinations of chemicals can
produce a toxic effect. EPA's Technical Support Document for Uiater Uual i ty-based Toxics Control presents data collected by
Alabaster and Lloyd indicating that mixtures of toxicants
found in sewage and industrial effluents exhibit acute
toxicity additivity to aquatic organisms (p. 6). Alabaster
and Lloyd's data deviating from additivity involved mixtures
of pesticides which generally act according to a variety of
specific mechanisms and not by narcosis.
Hermens, et al. (19a'^b) determined both the acute toxicity
to and the inhibition of reproduction of D_^ maqna of a
mixture of lA- chemicals having varying chemical structures
and probable modes of action. Results of the study showed
that the potential for addition is reduced when more specific
sublethal criteria? such as inhibition of reproduction in
this study) are examined as opposed to mortality. However) even though chemicals were considered to have different modes of action, concentration addition was observed in the
mortality study. It was concluded that this phenomenon of
concentration addition of chemicals having different modes of toxic action is probably rare. Even though reduced joint
15
reproduction (sublethal effect), the toxicity of the mixture
was much higher than that of the individual chemicals and was
near concentration addition. In a subsequent study, Hermens, et al. (1985) investigated the joint toxicity on inhibition of growth of D. maqna of a mixture of alcohols and
chlorohydrocarbons. Concentration-additivity was observed,
even at the no observable effect levels with sublethal
3. TOXICITY BACKGROUND AND DESCRIPTION OF SITE lAJestside WUJTP Description
Ihe High Point Westside WWTP includes treatment by
trickling filters and activated sludge in series. The
effluent is filtered. A flow diagram of the plant is given in
Figure 3.1. Prior to September of 19S6, when operation of the
expansion of the plant began, the plant operated with only
one aeration basin.
fctf-luent from the plant is discharged into the Rich Fork
of Abbotts Creek which empties into the Yadkin River at High
Rock Lake (a source of drinking water for the town of Denton,
NO. Rich Fork Creek has a 7Q10 (7 day, 10 year low flow) of
0.3 cubic feet per second; during periods of low flow the
effluent comprises 95*/. of the creek's flow. (NC Division of
tnvironmental Management, Jan. 23, 198*^) Table 3.1 summarizes
operational and influent characteristics of the plant.
Effluent BODS and suspended solids are normally less than EO
mg/L. Values for suspended solids, BQD5, and COD removal
efficiencies are given for March 1986 and March 1987 because
sampling for this study was performed during these two months
and because one month was prior to and the other following plant expansion and upgrading of treatment. It appears that
improvement in these removal efficiencies has occurred since
WFLUECT PUMP STA,
TRICKLING
FILTER
ANAEROBIC
SLUDGE DIGESTERS
SLUDGE THICKHIER
CHLORINE
BASIN AERATIOJ B AS IMS
PP.IHARY
LARIFIERS
FIHAL
CLARIFIERS EFFLUENI
FILTER ^
EFFLUWT TO
BICH FORK CREEK I£GE<D
---ͨLIQUIDS FLOW
---»SLUDGE FLOW
FIGURE a.lJ'ROCESS FLOW PIAGRAM, HIGH POWT WESTSIDE PUVBT
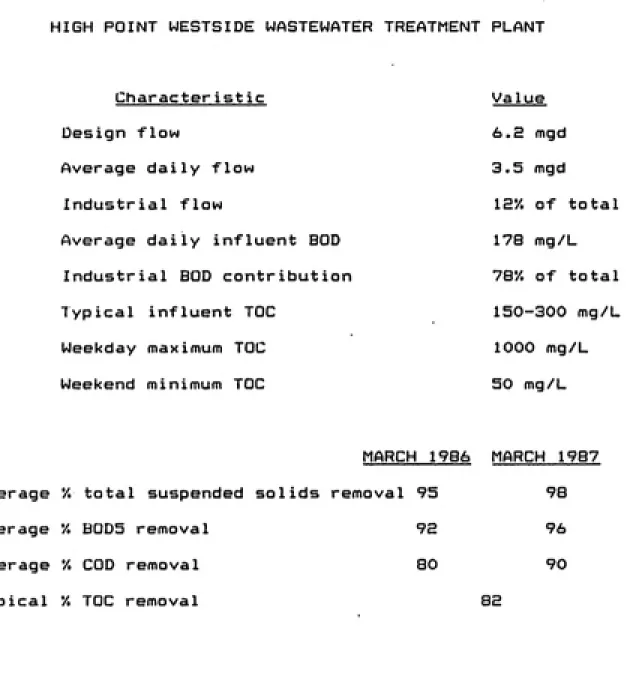
Table 3.1. OPERATIONAL AND INFLUENT CHARACTERISTICS
HIGH POINT WESTSIDE WASTEWATER TREATMENT PLANT
Character ist ic Value
Design flow 6.E mgd Average daily flow 3.5 mgd
Industrial flow 12'/. of total
Average daily influent BOD 178 mg/L
Industrial BOD contribution 78'/. of total
Typical influent TOC 150-300 mg/L Weekday maximum TOC 1000 mg/L Weekend minimum TOC 50 mg/L
19
periods of heavy rain. While flows of IS-l-^ mgd may be
reached, these periods are of such short duration as not to
be reflected in the average daily flow.
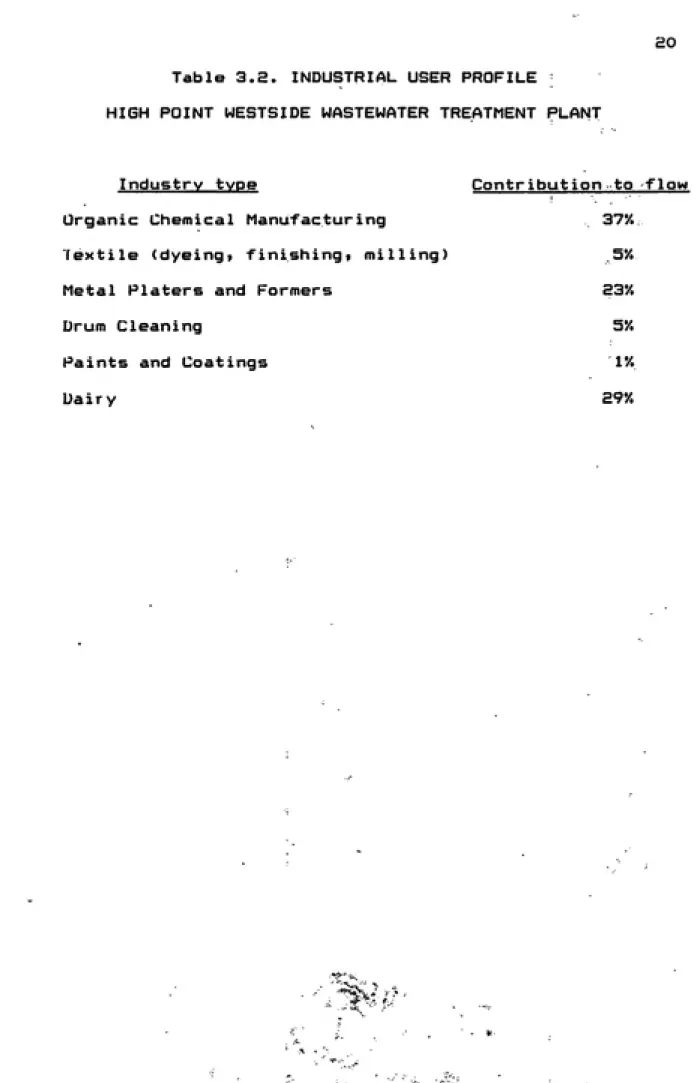
Industrial contributions to the Westside plant are shown
in Table 3.2 to be a small percentage of the flow (IE*/.) but a
large percentage of the BOD (78*/.). Industrial users of the
High Point Westside WWTP may be divided into the following
categories: organic chemical manufacturers, textile (dyeing
and finishing, milling), metal platers and formers, drum
cleaning, paints and coatings, and dairy operations. Table
3.B lists each of these industrial categories and its
corresponding percentage of industrial flow to the wastewater
treatment plant. While dairy operations are responsible for
ci9'/, of the industrial flow, the effluent contributes mainly
BOD to the plant and makes no contribution to the toxicity of
the treatment plant influent. Disregarding the dairy
operations, the organic chemical manufacturers and metal platers and formers are the largest contributors based on
flow.
Division of Environmental Management Assessment of Toxicity
The North Carolina Division of Environmental Management
<DEM) conducted a study in 1983 of the Westside WWTP and its
impact on Rich Fork Creek (NC DEM, 198'^). Samples of effluent
collected prior to chlorination on three dates were submitted
to ^B hour static Daphnia pulex bioassays. These acute
Table 3.2. INDUSTRIAL USER PROFILE
HIGH POINT WESTSIDE WASTEWATER TREATMENT PLANT
Industry type Contribution to flow Organic Chemical Manufacturing 37%
fextile (dyeing, finishing, milling) 5*/.
Metal Platers and Formers E3*/.
Drum Cleaning 5*/.
Paints and Coatings 1*/.
21
effluent. In addition, a flow-through 96 hour LC50 using
fathead minnows was determined to be 64'/. effluent (prior to
chlorination). The study found that the numbers and diversity
of fish and benthic invertebrate populations were greatly
reduced downstream from the WWTP and concluded that the
effluent was greatly stressing downstream biota.
Results of chemical analyses of the effluent conducted at
the time of the benthic survey showed there to be high levels
of phenols and of formaldehyde) a tributyl tin compound at ppb levels? and 10 unidentified peaks detected by GC/MS.
Vighi and Calamari <1985) found tributyltin chloride to have
a 'd^ hour LCJSO of 0.013 mg/L (13 ppb) using Daphnia maqna .
The DtM report concludes that while formaldehyde and tributyl
tin were components of the whole effluent toxicity, additional toxic constituents probably exist. It also
suggests that if nonylphenol ethoxylates were a major
component of the phenols, that the municipality investigate
the possibility of having the textile industry substitute the
more biodegradable alcohol ethoxylates for them. The tributyl
tin compound used by the textile industry as a biocide was
substituted for with a less potently toxic compound.
High Point Toxicity Assessment Program
The Central Laboratory of the High Point Water and Sewer
Department has conducted acute Daphnia pulex toxicity tests
for several years on the recommendation of the state Division
treatment plant effluent has sometimes been as frequent as
two times per week. DEM defined acceptable levels of acute
toxicity of the Westside WWTP effluent as and LC50 of greater
than or equal to 95*/. effluent. From February 1986 to
September 1986, prior to improvement in treatment facilities,
the laboratory biomonitoring program found 8 of 13 influent
and 13 of ^3 effluent samples bioassayed as having LC50
values less than 90+'/.. Following upgrading of treatment
processes, between September 1986 and April 1987, 5 of 5
influent and 9 of ^1 effluent samples showed LC50 values of
less than 90+'/., showing some improvement in reduction of toxicity. Chronic toxicity of the treatment plant effluent
has been documented also.
In the summer of 1987 the High Point Central Laboratory
contracted with a private laboratory to conduct acute
toxicity tests of industrial effluents discharged to the
Westside plant and of an untreated domestic wastewater
sample. Of the industrial effluents tested, 80'/. had LC50
values less than 10'/.. The LC50 values of the industrial
effluents ranged from less than 0.1'/. to 71'/.. The industrial
categories having at least one significant contributor (based
on flow) having an LC50 of less than 1'/. are listed below:
textile (minimum LC50 = 0.1'/.)
drum cleaning (minimum LC50 = 0.1'/.) metal plating (minimum LC50 = 0.1'/.)
metal forming
organic chemical manufacturing.
The industrial effluent having the least toxicity (LC50=71*/.)
£3
an aerobic biological process. The least toxic untreated
industrial effluent from an organic chemical manufacturer had
an LC50 of 68*/.. An untreated domestic wastewater sample had
an LL'bO of 90%. These findings imply that the source of the
toxicity of influent to the Westside plant is primarily
i ndustr i al.
Attempts have been made by a private laboratory contracted
by the High Point Central Laboratory to cultivate and
maintain stock Cer iodaphnia in Westside domestic wastewater
treated in a batch reactor using activated sludge from the
Westside plant. Although the daphnia live in this medium,
they do not exhibit as high a reproductive rate as is
required by EPA quality assurance guidelines for use in
chronic bioassays. This suggests either that levels of toxic
compounds present in the untreated domestic wastewater itself
Are high enough to depress reproductive rate or more probably
that toxic compounds associated with the sludge are adversely affecting the reproductive rate. That sludge is a sink for
heavy metals and polynuclear aromatic hydrocarbons has been
well documented. Other compounds have been shown to be
concentrated in sludge? as well- Giger> Brunnerj and
Schaffner (1984) reported that 4-nonyIphenoIs, degradation
products of nonylphenol polyethoxylates, are present in
Sample Collection, Storage? and Handling
Samples of influent and effluent from the High Point Westside WWTP were collected on a weekly basis for a two month period in the spring of 1986 and as toxicity was
discovered by periodic biomonitoring until April of 1987. An
aeration basin grab sample was collected April 30, 19B6 due to concern over a dramatic increase in the consumption of oxygen in thie aeration basin. Table "^.1 lists the samples collected and corresponding results of acute toxicity tests.
Wastewater samples exhibiting an LC50 of 90*/. or less in the
^B hour static Daphnia pulex bioassay are defined as "toxic."
An LC50 of 90*/. means that in a solution composed of 90*/. by
volume wastewater and 10% by volume pure dilution water mortality of 50*/. of the test organisms was observed.
"Nontoxic" samples are defined as those having an LC50 of 90+y..
Wastewater samples were composited over B^ hours at a rate
of one liter every six hours. Wastewater treatment plant
effluent was collected prior to chlorination.
A 24 hour composite sample of domestic wastewater
collected from a point in the sewer system having no
25
Table ^.1. HIGH POINT WESTSIDE WWTP SAMPLES AND CORRESPONDING BIQMONITQRING RESULTS
SAMPLE COLLECTION 48 hour LC50 TOXICITY DATE TYPE METHOD Daphnia pulex DESIGNATION
2/3/86 EFF COMPOSITE 56*/. TOXIC
3/3/86 INF COMPOSITE AN NONTOXIC
3/3/86 EFF COMPOSITE 90+*/. NONTOXIC
3/11/86 INF COMPOSITE 15% TOXIC
3/11/86 EFF COMPOSITE 90+'/. NONTOXIC
3/26/86 INF COMPOSITE AN NONTOXIC
3/26/86 EFF COMPOSITE 90+'/. NONTOXIC
3/31/86 INF COMPOSITE AN NONTOXIC
4/1/86 INF COMPOSITE 33'/. TOXIC
4/1/86 EFF COMPOSITE 90+'/. NONTOXIC
4/8/86 INF COMPOSITE AT TOXIC
4/8/86 EFF COMPOSITE 66'/. TOXIC
4/30/86 AB GRAB 49'/. TOXIC
11/17/86 EFF COMPOSITE h% TOXIC
11/18/86 EFF COMPOSITE 6'/. TOXIC
3/16/87 INF COMPOSITE AT TOXIC
3/16/87 EFF COMPOSITE 10'/. TOXIC
3/17/87 EFF COMPOSITE 6.1'/. TOXIC
abbreviations: INF = influent; EFF = effluent;
AB = aeration basin; AT = assumed toxic;
categories: (1) organic chemical manufacturing, (2) textile,
<3) metal finishing, <'^•) diecasting, (5) paints and coatings,
and (6) drum cleaning were collected during this time period.
Industrial wastewater samples in each category consisted of a
mixture of 2A- hour composites of two or more of the
significant (based on flow) industrial contributors to the
wastewater treatment plant.
Samples were stored in capped, two gallon acid-washed glass bottles with a minimum of headspace at ^ C, except
during overnight shipping when samples were stored on ice in
coolers. The majority of samples were extracted within one
week of collection, except for some industrial composites
which were stored for a maximum of one month prior to
extract ion.
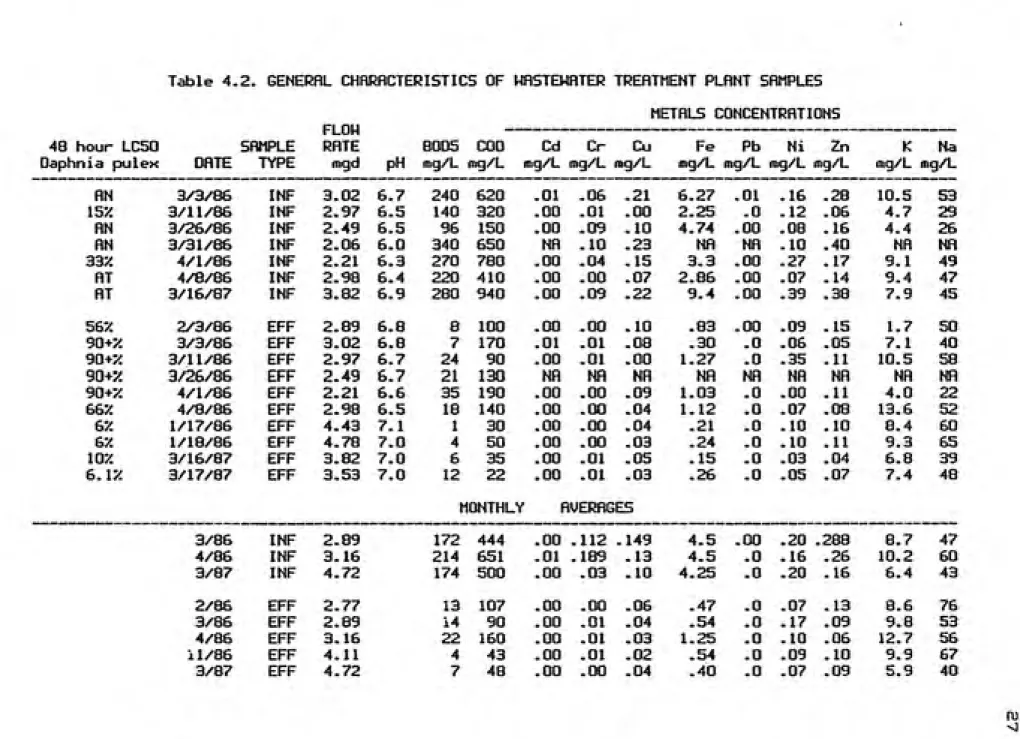
Cjeneral Characteristics of Westside Wastewater Samples Table "4-.2 provides characteristics of samples collected
tor this study. These data were obtained from the Central
Laboratory of High Point's Department of Water and Sewer.
Acute toxicity bioassay results (reported as percent effluent
or influent causing mortality of 50*/. of Daphnia pulex test
organisms), average daily flow, pH, BODS, COD, and metals
concentrations are given. In addition, monthly averages for each parameter except pH are provided. No value for any
Table 4.2. GENERAL CHARACTERISTICS OF WASTEWATER TREATMENT PLANT SAMPLES
•
METALS CONCENTRATIONS
48 hour LC50 SAMPLE
FLOW
RATE 8005 COO Cd Cr Cu Fe Pb Ni Zn K Na
Daphnia pulex DATE TYPE rngd pH mg/L mg/L 1ng/L mg/L mg/L mg/L mg/L rog/L mg/L mg/L mg/L
AN 3/3/86 INF 3.02 6.7 240 620 .01 06 .21 6,27 .01 .16 .28 10.5 53 isy. 3/11/86 INF 2.97 6.5 140 320 .00 .01 .00 2.25 .0 .12 .06 4.7 29
AN 3/26/86 INF 2.49 6.5 96 150 .00 .09 .10 4.74 .00 .08 .16 4.4 26 AN 3/31/86 INF 2.06 6.0 340 650 NR .10 .23 NR NA .10 .40 NA NR 33J£ 4/1/86 INF 2.21 6.3 270 780 .00 .04 .15 3.3 .00 .27 .17 9.1 49 AT 4/8/86 INF 2.98 6.4 220 410 .00 .00 .07 2.86 .00 .07 .14 9.4 47
AT 3/16/87 INF 3.82 6.9 280 940 .00 .09 .22 9.4 .00 .39 .38 7.9 45 sey. 2/3/86 EFF 2.89 6.8 8 100 .00 .00 .10 .83 .00 .09 .15 1.7 50 30+y. 3/3/86 EFF 3.02 6.8 7 170 .01 .01 .08 .30 .0 .06 .05 7.1 40 90+y. 3/11/86 EFF 2.97 6.7 24 90 .00 .01 .00 1.27 .0 .35 .11 10.5 58 3Q+y. 3/26/86 EFF 2.49 6.7 21 130 NR NA NA NA MA NR NR NR NR 30*y. 4/1/86 EFF 2.21 6.6 35 190 .00 .00 .09 1.03 .0 .00 .11 4.0 22 S£,y. 4/8/86 EFF 2.98 6.5 18 140 .00 .00 .04 1.12 .0 .07 .08 13.6 52
67. 1/17/86 EFF 4.43 7.1 1 30 .00 .00 .04 .21 .0 .10 .10 8.4 60
sy. 1/18/86 EFF 4.78 7.0 4 50 .00 .00 .03 .24 .0 .10 .11 9.3 65 107. 3/16/87 EFF 3.82 7.0 6 35 .00 .01 .05 .15 .0 .03 .04 6.8 39
s.iy. 3/17/87 EFF 3.53 7.0 12 22 .00 .01 .03 .26 .0 .05 .07 7.4 48
MONTHLY AVERAGES
3/86 INF 2.89 172 444 .00 .112 .149 4.5 .00 .20 .2B8 8.7 47 4/86 INF 3.16 214 651 .01 .189 .13 4.5 .0 .16 .26 10.2 60 3/87 INF 4.72 174 500 .00 .03 .10 4.25 .0 .20 .16 6.4 43 2/86 EFF 2.77 13 107 .00 .00 .06 .47 .0 .07 .13 a.6 76 3/86 EFF 2.89 14 90 .00 .01 .04 .54 .0 .17 .09 9.8 53
4/86 EFF 3.16 22 160 .00 .01 .03 1.25 .0 .10 .06 12.7 56 il/86 EFF 4.11 4 43 .00 .01 .02 .54 .0 .09 .10 9.9 67 3/87 EFF 4.72 7 48 .00 .00 .04 .40 .0 .07 .09 5.9 40
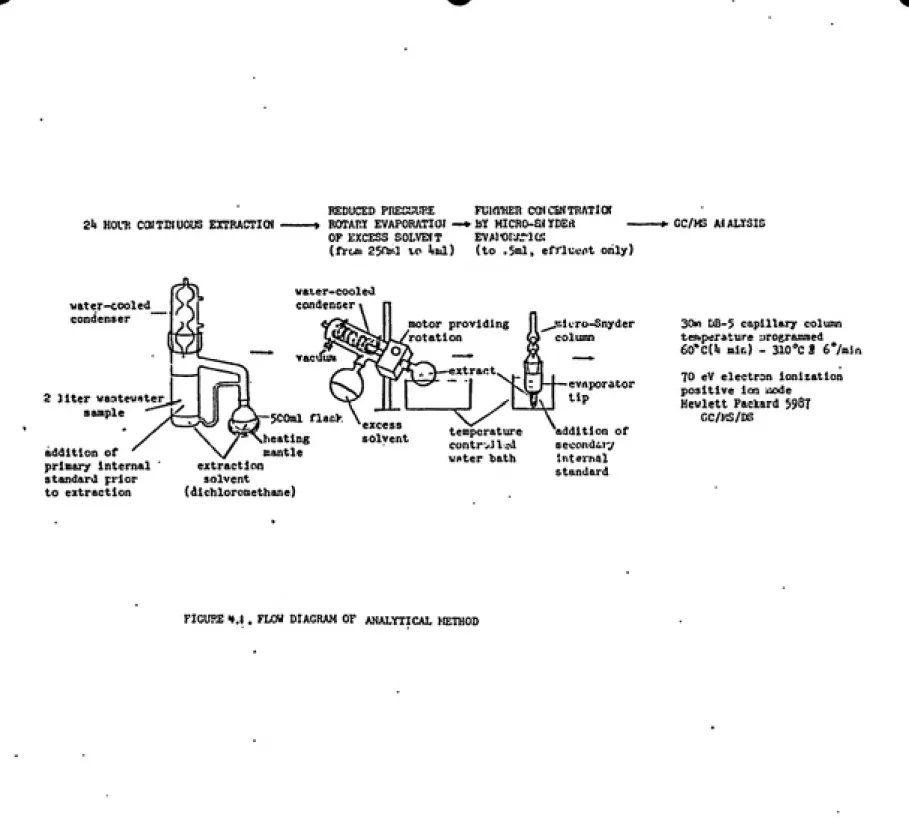
Preparation and Analysis of Wastewater Samples
Ihe preparation of samples for analysis is depicted in Figure ^.l. A procedural blank consisting of deionized
distilled water was treated according to the same procedure as each set of three wastewater samples in order to detect any contamination entering the process from the extraction through the analysis stages. Wastewater samples (2 L) were
continuously extracted for at least 16 hours with 250 mL of B
and J residue analysis grade dichloromethane. Those collected
before May 1986 were extracted at ambient pH, generally about
pH 6.5. Wastewater samples collected after May 1986 were
extracted first at a pH greater than 11 and then at a pH less
than two in order to insure maximum recovery of organic bases
and acids and to simplify chromatographic analyses. Sodium
hydroxide (0.1 M) was used to adjust the wastewater samples to pH 11 or greater; adjustment to pH 2 or lower was
accomplished by the addition of concentrated hydrochloric
acid. Primary internal standards were added to wastewater samples prior to extraction as a means of determining the recovery of the extraction process. Wastewater samples extracted at ambient pH and acidified samples were spiked
with 2,5-dimethylphenol; samples made basic were spiked with
dS-anthracene. The continuous extraction apparatus was cleaned after each use with detergent and acid dichromate
solution and rinsed thoroughly with deionized distilled
water.
21) HOLTi CaiTDJUOUS EXTRACTIW
REDUCED PREOaURE
ROTARY EVAPORATiai
-OF EXCESS SOLVEJT
(from 250ir.l vc Uud)
FUlfl'HER CdiCENTRATIOf
• BY MICRO-aiYDErt — EVAi'Oi;;.?'ia;
(to .5ml, effliioiit only)
-»- GC/MS ki ALYSIS
vater-cooled condenser
]iter wantew8ter
sample
addition of
prlmai-y internal
standard prior
to extraction
water-cooled condenser
Ezl _
5C0ral flatiK
motor providing
/rotation
^beating
mantle extraction
solvent
(dichloromethane)
'excess
solvent temperature control I.;d wHter bath
.•r.lcro-Snyder
column
evaporator
tip 'addition of
Eecondaiy Internal
standard
30in DB-5 capillary column
teiiiper-ature uroerammed 60''C(U mir.) - 310 "0 3 6°/mia
70 eV electron ionization positive ion isode
Hewlett Packard 5987
GC/t'S/DS
less than t5 mL using rotary evaporation at a temperature of
approximately 32 C. Further concentration of the extract, if
needed, was accomplished in micro-Snyder equipped
concentrator tubes to which the extract had been
quantitatively transferred. Extracts expected to be of
greater 1OC content, i.e. wastewater treatment plant influent
and industrial effluents, were concentrated to approximately
b mL, Wastewater treatment plant effluent and domestic
wastewater extracts were concentrated to approximately 0.5
niL. Extracts were spiked with the secondary internal standard
(1,^-dichlorobenzene or 1-chlorooctadecane) for the purposes
of quantitation and transferred to 10 mL teflon-lined,
screw-capped vials for storage in the freezer until analysis.
Extracts were analyzed by both GC/FID and GC/MS. The gas
chromatographic column employed for the analysis of the
samples collected prior to May 1986 was a J &< W 30m, wide
bure (0.32mm ID), thin film (O.ESum) DB-5 fused-silica
capillary column. To achieve maximum column life and
performance, two separate, identical columns were used for
the analysis of acid and base/neutral extracts (samples
collected after May 1986). These columns were J S< W 30m,
narrow bore (0.25mm ID), thick film (lum) DB-5 fused silica
capillary columns. Gas chromatographic conditions for GC/FID
and GC/MS analyses are given in Table -^.3. GC/MS analyses
were performed by Carol Haney of the North Carolina State
University GC/MS laboratory. Performance of chromatographic
31 Table '^.3. CONDITIONS FDR CHROMATOGRAPHIC ANALYSIS
GC/FID GC/MS/DS
instrument Varian 3700 Hewlett-Packard 5987
temperature program 60° (^')-a80''3 67min 60" <4'J-SIO^S A^/min
carrier gas Helium Helium
carrier flow rate 1 mL/min 1 mL/min
injector temperature SSO^C SOO^C
detector temperature 300 Cionization technique EIj 70 eV
mode positive ion
ion separation technique quadropole mass filter
ion source temperature £00"C
transfer line temperature SOO^C
mass spectral library NBS-NIH
by injection of the Grob mix prior to analysis of sample extracts by GC/FID. No significant degradation in column
performance was observed.
Certainty Measures
Although primary internal standards were employed, no quantitative measure of recovery of the primary internal standard was determined. Because 1 ,''t-d ich lorobenzene was present in samples? it was a poor choice for an internal
standard and could not be used as a basis for quantitation of
recovery of the extraction process. The other secondary
internal standard used, 1-chlorooctadecane, was either added
to samples in too small a quantity to be detected or was not
amenable to chromatography under the conditions used. In either case, because none was detected, quantitation of recovery of the primary internal standard could not be achieved. Despite these problems, S,5-dimethyIpheno1 was observed in a majority of samples. Thus, recovery of a compound spiked into the sample matrix prior to extraction
was demonstrated. The fact that no compounds were identified
in procedural blanks indicates that no contamination was introduced to samples by the analytical procedure itself.
Identification Process
The process of assigning identifications to compounds
detected in samples included: 1) computer library search of
33
comparison of library identifications to reference spectra»
and 3) inspection of spectra for reasonable fragmentation
given the identification. Because spectra of standards were
nut generated on the mass spectrometer used for sample
analysis for comparison with sample spectra? identifications
may only be termed "tentative," as opposed to confirmed.
Acute Foxicity Tests
Bioassays of wastewater samples were performed by the
Central Laboratory of the High Point Department of Sewer and
Water . The bioassay method used was that developed by EPA
(Peltier and Weber, 1985) and modified by the NC Division of
Environmental Management to use Daphnia pulex > a waterflea
which lives in soft water, as opposed to Daphnia maqna, a
hard water organism.
"the method can be summarized as follows. Wastewater
samples were diluted with well water to five concentrations
ranging from 0 to 90% influent or effluent. Test organisms
(10 Daphnia pulex individuals less than S.^ hours old) were
added to wastewater samples in 10 mL of dilution water; total
volume of test medium was 100 mL. Mortality of the test
organisms was recorded after ^8 hours. Dissolved oxygen,
temperature, and pH of the test medium were measured at the
beginning and end of the test. Plots of log percent mortality
versus wastewater concentration were constructed. The
concentration at which 50*/. mortality occurred was obtained
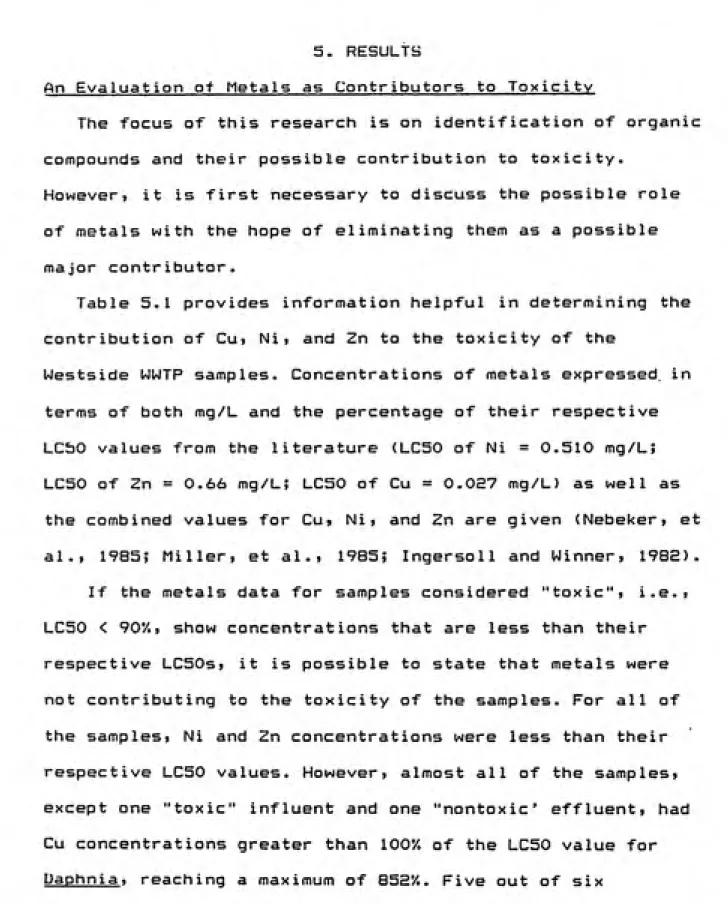
An Evaluation of Metals as Contributors to Toxicity
The focus of this research is on identification of organic
compounds and their possible contribution to toxicity.
However, it is first necessary to discuss the possible role of metals with the hope of eliminating them as a possible
major contributor.
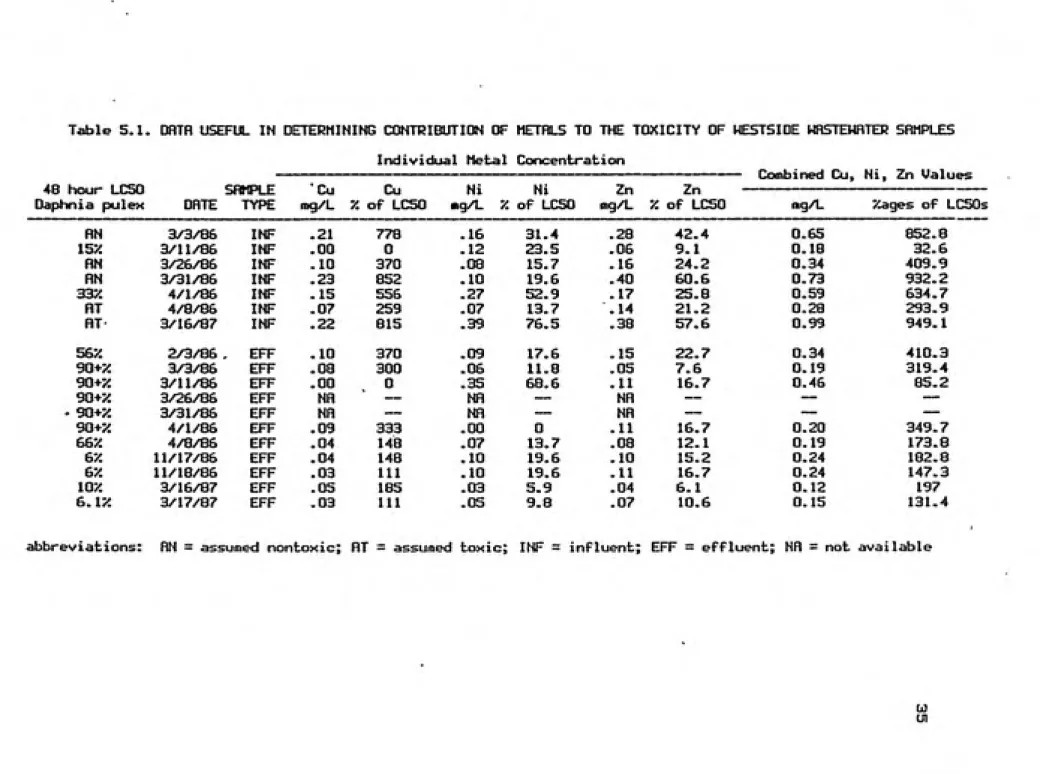
Table 5.1 provides information helpful in determining the
contribution of Cu, Ni, and Zn to the toxicity of the
Westside UIWTP samples. Concentrations of metals expressed in terms of both mg/L and the percentage of their respective
LCbO values from the literature (LC50 of Ni = 0.510 mg/L;
LC50 of Zn = 0.66 mg/L; LC50 of Cu = 0.057 mg/L) as well as the combined values for Cu, Ni, and Zn are given (Nebeker, et al., 1985; Miller, et al., 1985; Ingersoll and Winner, 1982).
If the metals data for samples considered "toxic", i.e., LC50 < 90'/., show concentrations that are less than their respective LC50s, it is possible to state that metals were not contributing to the toxicity of the samples. For all of the samples, Ni and Zn concentrations were less than their
respective LC50 values. However, almost all of the samples,
except one "toxic" influent and one "nontoxic' effluent, had
Cu concentrations greater than 100*/. of the LC50 value for
Table 5.1. DflTfl USEFUL IN DETERMINING CONTRIBUTION OF METflLS TO THE TOXICITY OF WESTSIDE WHSTEMRTER SHMPLES
Individual Metal Concentration
48 hour LC50 SAMPLE Cu Cu Ni Ni Zn 7-*. _^.
uomoinea ou, n1, en vd1ue5 in —
Daphnia pulex DATE TYMt mg/L y. of LC50 mg/L y. of Lcsn mg/L ;; of LC50 mg/L Xages of LC5Gs
HN 3/3/86 INF .21 778 .16 31.4 .28 42.4 0.65 852.8
15Z 3/11/86 INF .00 0 .12 23.5 .06 9.1 0.18 32.6
RN 3/26/86 INF .10 370 .08 15.7 .16 24.2 0.34 409.9 AN 3/31/86 INF .23 852 .10 19.6 .40 60.6 0.73 932.2
33Z 4/1/86 INF .15 556 .27 52.9 .17 25.8 0.59 634.7
HT 4/8/86 INF .07 259 .07 13.7 .14 21.2 0.28 293.9
HT 3/16/87 INF .22 815 .39 76.5 .38 57.6 0.99 949.1
5&y. 2/3/86 EFF .10 370 .09 17.6 .15 22.7 0.34 410.3 3Q*y. 3/3/86 EFF .08 300 .06 11.8 .05 7.6 0.19 319.4 sa+y. 3/11/86 EFF .00 0 .35 68.6 .11 16.7 0.46 85.2 SQ*y. 3/26/86 EFF NA —
NA —
NA — — —
ͣ
90+X 3/31/86 EFF NH —
NH —
NA — — —
90+Z 4/1/86 EFF .09 333 .00 0 .11 16.7 0.20 349.7
66J: 4/8/86 EFF .04 148 .07 13.7 .08 12.1 0.19 173.8
6Z \\n7/\^ EFF .04 148 .10 19.6 .10 15.2 0.24 182.8
&/. 11/18/86 EFF .03 111 .10 19.6 .11 16.7 0.24 147.3
lOZ 3/16/87 EFF .05 185 .03 5.9 .04 6.1 0.12 197
^.\y. 3/17/87 EFF .03 111 .05 9.8 .07 10.6 0.15 131.4
"nontoxic" samples (although 3 out 5 were assumed "nontoxic") had Cu concentrations greater than the no observable effect concentration (NOEC) of 0.020mg/L (Ingersoll and Winner,
198S)j the highest being 0.09 mg/L. This apparent increase in the concentration required to effect acute toxicity is
probably due to the phenomenon of complexation of metals by high molecular weight organics or other compounds having complexation capability (Winner, 1985; Flickinger, 1985). Buckley (1983) showed wastewater treatment plant effluent to have this kind of complexation capability. He found that complexation of Cu by ^0'/. sewage treatment plant effluent diminishes the toxicity from total Cu to juvenile coho salmon
(LC50 = 0.286 mg/L as opposed to 0.022 mg/L). If the same
increase in the median lethan concentration of Cu (LC50) is
seen in wastewater with Daphnia > this would account for samples having high concentrations of Cu exhibiting no
toxicity to Daphni a and would indicate that the toxicity of "toxic" samples is due to something other than Cu.
Upon examination of Cu» Ni, and Zn concentration values, the conclusion can be drawn that metals probably played no role in the toxicity of the 3/11/86 influent sample having an LC50 of 157.. However, because copper concentrations were
greater than lOOV. of the Cu LC50 for the other "toxic" samples, other criteria for determining the toxic
contribution of metals was developed. Using the combined
37 all other affects equal, "toxic" samples having a combined concentration of Cu, Ni, and Zn of less than O. "^6 mg/L and whose toxicity thus appears not to be caused by metals are: 'd/3/&h effluent, -^/S/S^ influent and effluent, 11/17/86 effluent, 11/18/86 effluent, 3/16/87 effluent and 3/17/87 effluent.
Using the combined percentages of LC50 values for Cu, Ni, and Zn as given in Table 5.1, it appears that metals were not the major cause of toxicity in any of the "toxic" effluent samples, except perhaps the one collected 2/3/86. In all effluent samples except 2/3/86, the combined percentages of
LC50s for the three metals were below 3'^9.7'/,, the value
reported for the 4/1/86 "nontoxic" effluent and used for comparison purposes. The 3/11/86 influent sample (LC50 =
lb'/.) and the '^/a/86 influent sample (assumed "toxic") both had combined percentages of LCSOs for Cu, Ni, and Zn below
the 3'^9.7*/. comparison value, indicating that toxicity in those influent samples thought to be toxic may not be due to me tal5.
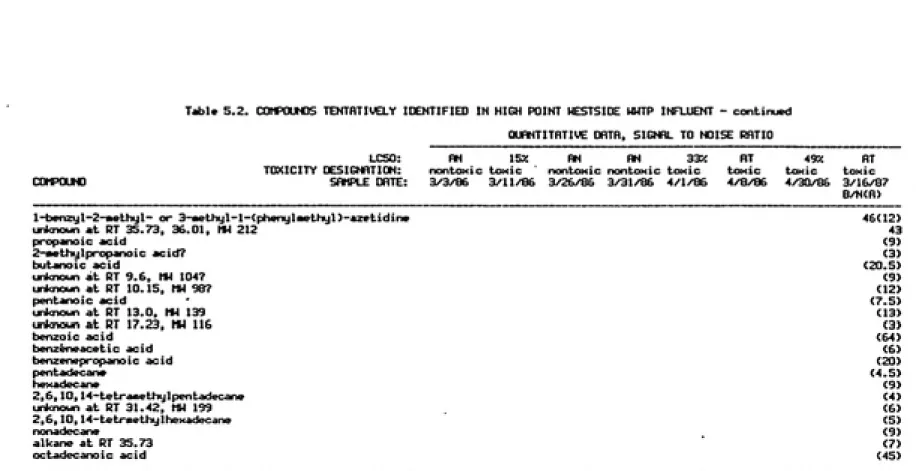
Organic Compounds F-ound in Wastewater Samples
Organic compounds tentatively identified in seven High
Point Westside WWTP influent samples and one aeration basin sample are listed in Table 5,S. Five out of the eight samples
were defined as "toxic," three as "nontoxic." A "toxic"
sample is one exhibiting an LC50 of 90V. or less in the ^3
QUHNTITFITIVE DflTH, SIGNAL TO NOISE RRTIO
CCB1P0UN0
LC50: TOXICITY DESIGNATION: SAMPLE DATE:
AN ISX AN AN 33X nontoxic toxic nontoxic nontoxic toxic 3/3/86 3/U/86 3/26/86 3/31/86 4/1/86
AT 49Z AT
toxic toKic toxic 4/8/B6 4/30/86 3/16/87
B/N(A>
8 61 1 6 28 1 4 23
87 70 24(28) 1 4 10 5<8>
! 32 40 17
i 94 100 9
; 3
14 1 5 38 7<6>
2 8 5
13 C3.5) i 7 30 4<4)
5 2
19 20 4
1-(2-methoxypropoxy)-2-propanoI
benzoic acid, butyl ester
l-C2-iiiethoxy-l-inethylethoxy)-2-propanol (early RT) l—(2-methoxy-l-methylethoxy)-2-propano1 (late RT)
1,2,4-trichlorobenzene
1,1' -b i p>heny 1
imdecane
'naphthalene »'2-ethy 1-1 -hexano 1
'dimethylbenzene (early RT) J2-butoxyethano1
'1- or 2-methylnaphthalene (early RT)
.l-(2-butoxyethoxy)ethanol
tT-chloro-2-, 3-, or 4-riiethylbenzene (early RT)
ͣ
14,8,12-trimethyl-3,7,11-tridecatrienoic acid, methyl ester
or tridecatrienenitri le
•"l-heptacosanol
(1,2- or 1,3-dimethylnaphthalene 4-methylnaphthalene (late RT)
caffeine
•1,2,3- or 1,3,5-trichlorobenzene '2-methyI-2,4-pentaned i o1
< nonane
i5-(phenylmetnyl )~2-thioxo-4-iniida2Gl inone
«ethy1benzene
joctadecanoic acid, butyl ester (early RT)
2 32
38
88
20 50
22 33
10.5 20 48
42 15.5 72 25
7 11 20
34.5 17 65
16 15 100 180 4 7.6 268
31.5 7.6 7.6
6
80
3 7 52
6 4
4 3.5
5.5 4
4 5.2
2 5 20
• • '
«
\
T^le 5.2. CaiHPOUHDS TENTHTIWELY IDENTIFIED IN HIGH POINT HESTSIDE
QUflNTITfiTIVE DHTfi
WWTP INFLUENT - continued
SIGNAL TO NOISE RfiTIO
-G LC50: RN 15Z HN fiN 33Z
TOXICITY DESIGNfiTION: nontoxic toxic nontoxic nontoxic toxic
COMPUUND SflMPLE DHTE: 3/3/86 3/11/86 3/26/86 3/31/86 4/1/86
HT 49Z HT toxic toxic toxic 4/8/86 4/30/86 3/16/87
B/H(fl)
cis- or trans-et,«,4,5-tetramethyI-l-cyclopentene-l-methanol 3
alkane at kRT 9.8 3
2-ethyl-N,N-diiiiethyl-l-hexanamine 2
octadecanoic acid, butyl ester (late RT) 4 2 30
dodecane 4 3.5
isothiocyanic acid, phenyl ester 3.5
N,N-dimethylcyclohexanamine 8.4 368
3-inethyl-l-butanol benzoate (isoamylbenzoate) 15.5 268
toluene 118
dimethylbenzene (late RT) 1.5 100
*-terpineol 9 15 95
benzeneoiethanol 30.5 80
d-limonene 62
1,2-benzenedicarboxylic acid, bis(2-ethylhexyl) ester 35
alkane at xRT 36.21 25
l-ethyl-2-, 3-, or 4-methylbenzene 16 1,2,3-, 1,3,5-, or 1,2,4-triinethylbenzene 22
4-methylphenol 6.3 14
hexahydro-2H-azepin-2-one 13
2-methylquinoline 16
dodecanoic acid 18 tetradecanoic acid 20 hexadecanoic acid 22
1-hexadecene 15
docosane 25 alkane at »RT 33.42 15
33
163 68 80 75
22
6
6 88
17 17 360(27)
2 2
12 7 47
9 17 34(7)
(4) 2
40 16 140 2 4.5(4)
QUflNTITOTIVE DfiTfl, SIGNAL TO NOISE RATIO LC50: RN 15X HN HN 33y.
TOXICITY DESIGNHTION: nontoxic toxic nontoxic nontoxic toxic
COMPOUND SAMPLE DATE: 3/3/86 3/11/86 3/26/86 3/31/85 4/1/86 alkane at kRT 34.86 IS
alkane at kPT 40.04 12 1, l-dicLfC lohexLjl heptane? 15
IH-indole 13 80 10 phenol 4 2 73 7 decanoic acid 60 6 molecular sulfur 2 20 4
l,2-benzenedicarboxL)lic'acid, butyl phentjlmethyl ester 20
1,2,4-trithiolane 5
1,2,4,6-tetrathiepane 2
nonylphenol isomer
N,N,N' ,N'-tetraethyl-l,2-ethanediamine?
1,2-benzenedicarboxylic acid, diisoctyl or dioctyl ester 12 14.S
3-iiiethy 1-lH-indole
dimethyltrisulFide 1.5
1,1'-oxyb i sbenzene
1,3-d i hy dr 0-2H-i ndo 1-2-one 1,8-diinethylnaphthalene
2,6,10,15,19,23-hexamethyl-2,6,10,ie,22-tetracosahexaene
2-ethylhexanoic acid
4-<2,2,3,3- or 1,1,3,3-tetramethylbutyl)phenol
6-methyl-2-phDnylindole? MW 207 2
9,12-octadecedienoic acid 24 18 14-methylcholestane 11 11.4
unknown at xST 46.2 7
hexacosano1 5 5.2
HT 49X AT
toxic toxic toxic 4/8/86 4/30/86 3/16/87
B/N(H)
12 116 5
7 70 2(22)
5 (19)
7 9 7 6
29 103
61 47
39
22 <4) 20
16
12
Table 5.2. COIiPOUNDS TENTRTIVELY IDENTIFIED IN HIGH POINT ME5TSIDE MHTP INFLUENT - continued
QUflNTITHTiyE OHTH, SIGNAL TO NOISE RATIO
HT 49X HT
toxic toxic toxic
4/6/86 4/30/86 3/16/87 8/N(n)
LC50: AN ISJC AN AN 33y.
TOXICITY DESIGNATION: nontoxic toxic nontoxic nontoxic toxic
COMPOUND SAMPLE DATE: 3/3/86 3/11/86 3/26/86 3/31/86 4/1/86 alkane at kRT 54.9, 54.6 6 3
xRT 10.4, 1-methyl-2-, 3-, 4-(l-methylethyl), or 3-propyl- 6 benzene or l-ethyl-2,4- or 3,5-dimethylbenzene or
4-ethyl-—1,2-dimethylbenzene or 2-ethyl-l,4—dimethylbenzene
N-(4-hydroxyphenyl)aceta«ide or HW 169 5.3 5
xRT 11.2, 1,2,4,5- or 1,2,3,5-tetramethylbenzene or methyl 7
i sopropy1benzene i somer
xRT 11.4, isomer of «RT'11.2 7
unknoun at xRT 43.84 12 20
9-octadecenoic acid 14 C33> unknoun at "RT 32.45, MM 2117 365
unknoun at RT 31.30, (»RT 24.0, 22.72), MM 203 3 11.2 18 16 6 42
unknoun at RT 29.86, <>«RT 23.4), MM 175 3 5
2-isopropylidenedihydrobenzofuran-3-one or 4-methyl-5-phenyl 2 5.2 6
4-imidazolin-2-one or MM 189
unknoun at kRT 20.9, 20.8 2 2
heptadecane .2 CI0.5)
octadecane 2 (11) unknoun at xRT 26.8, MM 201? 2
OUHNTITHTiyE DRTfl, SIGNHL TO NOISE RHTIO
HT 49% AT
toxic toxic toxic
4/8/B6 4/30/86 3/16/87 B/N(R) LC50: HN 15Z FW HN 33Z
TOXICITY DESIGNATION: nontoxic toxic nontoxic nontoxic toxic
COrWJUND SAMPLE DATE: 3/3/86 3/11/86 3/26/86 3/31/86 4/1/86
alkane at «CT 13.9 2
3-<l—iiiethyl-2-pyrrolidinyl)pyridine (nicotine) 1.5 l-(2—propenyloxy)-2-propanol 1.5 azidocyclohexane? 1.5 2-cyclohexen-l-ol 1.5 2-cyclohexen-l-one 3.5
decane 3
1-methyl-2- or 4-propylbenzene or (1—nethylpropyl)ben2»ne 2
kRT 9.7, isomer of xRT 11.2 3
unknoun at >«RT 31.8, 31.7 3 12
nonadecanol? 2 unknoun at xRT 33.6 4 unknoun at kRT 34.16
unknoun at xRT 50.0, MW 296 3
unknoun at »RT 54.0, MW 296 3
unknoun at «RT 31.72 4
unknoun at xRT 21.86, MW 1887 4
unknoun at xRT 32.3 4 unknoun at xRT 36 4
unknoun at xRT 31.18, MM 229? 88 1,2 benzenedicarboxylic acid, dimethyl ester 17
hexanoic acid 13 Cll) tetrachloroethene 10 4-hydroxy-4-rnethy 1 -2-pentanone 12 2-(2—<nethoxyethoxy)ethanol 5(11) (chloromethyl Jbenzene 12
Table 5.2. COMPOUNDS TENTHTIWELY IDENTIFIED IN HIGH POINT MESTSIDE MWTP INFLUENT - continued QUHNTITHTIVE DflTfi, SIGNAL TO NOISE RRTIO
LC50: HN 15Z HN FIN 33X HT 49y. HT TOXICITY DESIGNATION: nontoxic toxic nontoxic nontoxic toxic toxic toxic toxic COMPOUND SHMPLE DHTE: 3/3/86 3/11/86 3/26/86 3/31/86 4/1/86 4/8/86 4/30/86 3/16/87
B/N(R)
l-ben2yl-2-methyl- or 3-«ethyl-l-(phenyliiiethyl>-azetidine 46(12>
unknown at CT 35.73, 36.01, MW 212 43 propanoic acid <S> 2-methylpropanoic acid? <3)
butanoic acid C20.5> unknown at RT 9.6, MW 1047 (9)
unknown at RT 10.15, MW 98? C12) pentanoic acid (7.5)
unknown at RT 13.0, MW 139 CIS)
unknown at RT 17.23, MW 116 <3)
benzoic acid C64)
benzeneacetic acid (6)
benzenepropanoic acid (20) pentadecane (4.5)
hexadecane (9)
2,6, 10,14-tetramethylpentadecane <4) unknown at RT 31.42, MW 199 (6) 2,6,10, M-tetrmethylhexadecane (5)
nonadecane (9) alkane at RT 35.73 (7) octadecanoic acid (45)
abbreviations: flT=assumed toxic; RNT^assumed nontoxic; B/N=base/neutral extract; (fl)=acid extract; RT=retention time; Mi^=itiolecular
weight
146 different compounds at a detection limit of approximately 10 ppb was attempted in the influent/aeration basin samples. Tentative identification of 120 compounds was made.
Insufficient information precluded the tentative
identification of 24 detected compounds referred to as
"unknown. "
[able b.3 contains a list of compounds identified in ten High Point Ulestside effluent samples, six of which were
defined as "toxic" and four as "nontoxic." At a detection
limit of approximately 1 ppb, the identification of 123
different compounds was attempted in these samples. Tentative identification of B2 compounds was made. Compounds referred
to as "unknown" (41) were detected; however, information
necessary to make tentative identification of these was 1ack i ng.
Although the approach employed in this work was that of broad spectrum analysis, some quantitative information can be extracted from the data. In addition to compound
identification, Tables 5.2 and 5.3 present semi-quantitative data for each compound. This semi-quantitative data is
expressed as the ratio of the height of a chromatographic peak in the total ion chromatogram (corresponding to a
Table 5.3. aSMPOUNDS TENTflTigELY IDENTIFIED IN HIGH POINT MESTSIDE HWTP EFFLIENT QUHNTITHTIUE DflTR, SIGNAL TO NOISE BflTIO
COMPOUND
LC50: TOXICITY DESIGNHTIOH: SAMPLE DHTE:
56Z so+y. so*y. 90+Z so+y. s&y. Oi sx loz e.iz
toxic nontoxic nontoxic nontoxic nontoxic toxic toxic toxic toxic toxic 2/3/86 3/3/86 3/11/^ 3/26/86 4/1/86 4/8/86 11/17/86 11/18/86 3/16/87 3/17/87
B/N B/NCH) B/N<fl) B/NCR)
benzoCb]naphthoC2, l-d3 or Cl,2-d]thiophene
H-(4-hydroxyphenyl)acetaiiiide or MW 169? 81 50
phosphoric acid, triethyl ester
tetrachloroethene (tetrachloroethylene,perchloroethylene) tetrahydro-2-furanmethano1
1-<2-propeny1oxy)-2-propano1
4-hydroxy-4-methyl-2-pentanone <diacetone alcohol)
toluene
unknown at RT 9.54. "(RT 4.3), MW 97 60
2—cyclohexen-1-ol 25
unknown at RT 11.21, 11.23, 11.35
2H-pyr-an-2-one or 2-cyclohexen-l-one 48
3,3,3-trichloro-l-propene unknown at RT 18.66. tlW 168
2-phenyl-l,3,2-dioxaborolane7 MW 148
1,3— i sobenzofurand i one
2-isopropylidinedihydroben2ofuran-3-one or 4-iiiethyl-5—phenyl 40
-4-imidazolin-2-one or MW 189
1,2-benzenedicarboxylic acid, diethyl ester 20
(diethyl phthalate)
unknown at RT 31.30. 31.50, >«(RT 24.02,22.73,22.68), MU 203 10 2-acety I -2,8-d ihydro-7-methy 1 ~8-methy 1 enepyr azo 1 o—
C5, l-cKl,2,4]triazine unknown at RT 26.75, MW 207
unknown at RT 40. i4, kCRT 32.7, 32.3, 32.4, 31.03), MK 204 60 10 (2,2,5,7-tetramethyl-l-tetralol?)
chloroform
d i bromoch1oromethane
unknown at RT 16.22 (spectrum similar to RT 10.46)
unknown at RT 17.37 (contains 2 chlorine?) unknown at RT 10.46
2-isoxazoIidinecarboxylic acid, ethyl ester? or MW 161? M,4-dimethylDenzenesuifonairiide or (phenoxymethyDbenzene?
4-methyl-3-penten-2-one or 2,5-dihydro-2,5-dimetnylfuran
4-et.iyioiperidine or 1-piperioinecartjoxaidenjde 33 5
6 5 92 12 32 6 e 2.5 2.5 4.S 22 46 36 36 4(2) 3(3) 3.5(2) 2(7) 2(16) 2(16) 17 7 126 4 10
6 2(5)
30 180(101) 4 10(21)
5
2(10)
220 i.5 5 2.5 1.5
7
2 3
QUHNTITRTiyE DHTfl, SIGNAL TO NOISE RFITIO
COMPtaJNO
LC50: TOXICITY DESIGNHTION: SAMPLE TOTE:
56Z SO*-/. 90+2 90+Z 90+Z 66Z toxic nontoxic nontoxic nontoxic nontoxic toxic 2/3/86 3/3/86 3/11/86 3/26/86 4/1/86 4/8/86
ex toxic 11/17/86 B/N 62 toxic n/lB/86 B/HCA) 102 6.12 toxic toxic 3/16/87 3/17/87 B/NCfl) B/N(A)
N-acety 1 -N— < 2-«ethy 1 propy 1) acetam i de or S-methy 1 -S-nonanaoi i ne cyclohexene or trans-2-methyl- or 4-(iiethyl-l,3-pentadiene 7-oxabicyclo [4.1.0] heptane
MM 105 or dimethoxymethane CRT 10.03)
unknown at RT 10.74, 10.99, MW 91?
benzenenethanoI
2,3,6-tri«iethyl-4-octene or I—butyl-2-ethyl-cyclopentane or
< - ) -Lavandu 1 o I
unknown at RT 24.01, 24.31, MW 159
l-ben2yl-2— or S-methyl-azetidine
unknown at RT 26.64, 26.94, MM 203
unknown at RT 29.86, 30.21, MW 175 kCRT 23.65, 23.3, 23.42.
23.73, 22.12)
2-(1-methyIhepty1)cycIopentanone
unknown at RT 34.05, 34.40, MW 232?
3,4—dihydro-5,7-dimethyl-l<2H)-naphthalenone or
7-methyl-4-Pteridinecarboxyl ic acid, ethyl ester 3,4-dihydro-6,7-di me thy 1 -1C 2H ) -naphtha I enone l,2-ben2enedicarbQxylic acid, bisC2-ethylhexyl)
(bis<2-ethylhexyl)phthalate)
1,4-dioxane
1,3-, 1,2-, or 1,4-dichlorobenzene fIuoromethy1benzene?
unknown at RT 14.7, MW 134
(3-ch 1 oropropy 1) benzene?
bromomethylbenzene? or (methylsulfonyl )methyl benzene? 5—(Tiethy I -2—hexanone
unknown at RT 9.61, MW 184?
3— or 1-chlorocyclohexene?
benzaldehyae
3,7-diinethyl-l-octene?
dichlorocyclohexane CMW 152) or 1-methyl-lH-pyrrole (MW 81)
unknown at RT 16.26, 16.25, MW 81 or 97 (brominated?)
1-nitrosopiperidine
unknown at RT 19.36, 19.32, MW 127, (simiiar to 3T IS.28)
10 4 3
3D 30 35 30 6.5 2
9 6
16
0-Table 5.3. ODMPOUNDS TENTATIVELY IDENTIFIED IN HIGH POINT WE5TSIDE MMTP EFFLUENT - continued QURNTITHTiyE DflTH, SIGNHL TO NOISE RHTIO
COMPOUND
LC50:
TOXICITY lESlGNflTION: SRMPLE DHTE:
56X 90+5i 90+Z 90+Z 90+5:: toxic nontoxic nontoxic nontoxic nontoxic 2^3/86 3/3/86 3/11/86 3/26/86 4/1/86
66Z 6Z 6X lay. 6. IX toxic toxic toxic toxic toxic
4/8/86 11/17/86 11/18/86 3/16/87 3/17/B7 B/N B/NCH) B/N<H) B/HCfl)
unknown at RT 20.74, 20.30, MW 226 or 127 (similar to CT 16.28) 3-ethy I -4-iiiethy 1-1 H-pyrro 1 e-2,5-d i one?
unknown at RT 20.95
unknown at RT 21.49, MW 246 or 244 3-br oiiiocyc 1 ohexene
a phthalate at RT 45.48 a phthalate at RT 47.18
unknown at RT 5.82
dihydro-5,5-dimethy1-C3H>-furanone
unknown at RT 13.48, isomer of dihydro-dimethyl-furanone?
unknown at RT 15.89
3—nonyn-2—o17
unknown at RT 19.97, MW 145, 1 chlorine a phthalate at RT 36.32
O, IX, 4-tr i methy 1 -3-cyc I ohexene-1 -methano I Co(-terp i neo 1 > dimethylbenzene (late RT> (xylene)
hexahydro-2H-azepin-2-on© M,N-d i methy1benzenemethanam i ne M,N-dimethy1eye1ohexanamine
octadecanoic acid, butyl ester (late RT)
phenyl carbamic acid, methyl ester or IH-benzotriazole
phthalate RT 45.2
1,2-benzenedicarboxylic acid, diisooctyl or dioctyl ester 30 (diisooctyl or dioctyl phthalate)
1,2-benzenedicarboxylic acid, dimethyl ester (dimethylphthalate) 1,2-berizenedicarboxylic aicd, dipentyl ester (dipentylphthalate) l-chloro-2—, 3-, or 4-methylbenzene (chlcrotoluene) or
(chloromethyl)benzene
4-(l-methylethyl)benzoic acid, methyl ester
caffeine
1,2,3- or 1,3,5-trichlorobenzene (late RT) 350 1,2,4-trichlorobenzene 770 1,2-dichlorobenzene (IS) 60 l-(methoxy-methylethoxy)-2-propanol (earlij RT) 30 i-(m6thoxy-methyiethoxy)-2-propa.-iol (late RT) 25
400 20 30 300 60 50 47 3 3 6 6 3 12 2 1.5 1.5 3.5 13 5 5 3 2 6.5 1.5 3 2 9 52.5 3 2 3 4 15 12 6 4 4 4 6 4 144 4 10 5 18 6 54 36 7 6 3 65 8 202 22 52 25 36 19 20
4.5 7(47) 4 16.5(11)