Consumer Views on Nutrition Labels that Contextualize Energy Content with Physical Activity and Calorie Labeling on Quick-Service Restaurant Menu Boards
By Jonas Swartz
A Master’s Paper submitted to the faculty of the University of North Carolina at Chapel Hill
in partial fulfillment of the requirements for the degree of Masters of Public Health in
the Public Health Leadership Program
Chapel Hill 2011
--- Advisor:
--- Date
---
Second Reader:
1 Abstract
Nutrition labels are one strategy being used to combat the increasing prevalence of overweight and obesity in the United States. The Patient Protection and Affordable Care Act of 2010 mandates that calorie labels be added to menu boards of chain restaurants with 20 or more locations. This research design includes a systematic review of observational and experimental studies testing calorie menu labels, with a focus on studies published since the last review on the topic in 2008. This review includes six studies, two of which were judged to be of good quality, and four of which were judged to be of fair quality. The evidence suggests that calorie labeling does not have the intended effect of decreasing calorie purchasing or consumption.
2 Table of Contents
Abstract………. 1
Systematic Review Manuscript………. 3
Search Flow Chart (Figure 1)……….. 21
Evidence Table (Table 1)……… 22
Quality Table (Table 2)……….. 24
Research Design Manuscript………... 25
Sample Nutrition Lables (Figures 1&2)……… 40
Demographic Table (Table 1)……… 43
Health Literacy Table (Table 2)……….. 44
Focus Group Guide (Appendix 1)………. 45
3
Calorie menu labeling on quick service restaurant menus: an updated systematic review of the literature
As part of the Patient Protection and Affordable Care Act of 2010 lawmakers passed a
requirement for calorie labeling for all chain restaurants with 20 or more locations. If enacted, the policy will require these restaurants to list at the very least the calorie information in the foods and beverages they serve. This new legislation builds upon efforts already underway in some states to give consumers more information about the foods they purchase away from the home.1 Theoretically, if consumers have more complete information, they will make healthier choices about the foods they choose and consume (they may still purchase the same foods but eat less). Restaurants and manufacturers might also respond in a favorable manner by improving the nutritional content of their foods to satisfy consumer demand for healthier options.2, 3
Nutrition labeling is one of many policy approaches that has been proposed to address the increasing prevalence of overweight and obesity in the United States.4, 5 In particular, researchers and policymakers have begun to focus on how the increasing reliance on food away from home in the US diet2, 6 may be contributing to poor health.3, 7 Food away from home now accounts for over 30% of daily caloric intake and 50% of yearly food spending.2, 3, 6
This trend is concerning because foods consumed away from home typically have more calories, fat and sodium than foods prepared in the home.2
Frequent consumption of food away from home has also been linked to higher rates of overweight and obesity.8, 9
4
menus. After several legal challenges, the city began enforcing mandatory labeling with fines in 2008. Shortly thereafter, in 2010, Congress passed the Patient Protection and Affordable Care Act which included a national menu labeling law for all restaurants with 20 or more locations.1, 10
Though momentum has gathered behind menu labeling policies as a tool for combatting overweight and obesity, evidence to support its efficacy is less robust. In a 2008 review, Harnack and French were able to identify only six studies that tested the effects of calorie labeling on consumer choice.6
They concluded that from the current evidence, the effects of calorie labeling appeared to be weak or inconsistent.6 However, they also noted major methodological flaws in each of the studies.6
In this systematic review, we update Harnack and French’s findings with more recent evidence. The purpose of this paper is to use current literature to answer the question of whether calorie labeling on menus at restaurants and cafeterias has an effect on consumer purchasing and eating behaviors.
METHODS
Search strategy
5
labeling”. We supplemented our findings with hand searches from the reference lists of articles and reviews.7, 11-15
Article selection
To be included, studies must have used an experimental or quasi-experimental design comparing a calorie-labeled menu with a no-calorie menu. This review includes studies conducted in multiple settings including laboratories, college cafeterias, and fast food restaurants. Only studies that measured purchasing behavior or consumption of ready-to-eat meals were included. We excluded studies of consumer preferences and awareness of menu labels, as well as studies that evaluated non-calorie menu labels (e.g. menus that labeled healthy choices, menus that included nutritional information besides calories) and those that did not publish numerical data on calories purchased or consumed. Our search was restricted to English-language studies (regardless of country where the research was conducted) in peer reviewed publications.
Data extraction
One author (JS) extracted standardized information including study aims, study type, sample population, and outcomes in a spreadsheet to facilitate comparison and synthesis. The table included information about methodological strengths and weaknesses of the studies.
Quality assessment
6
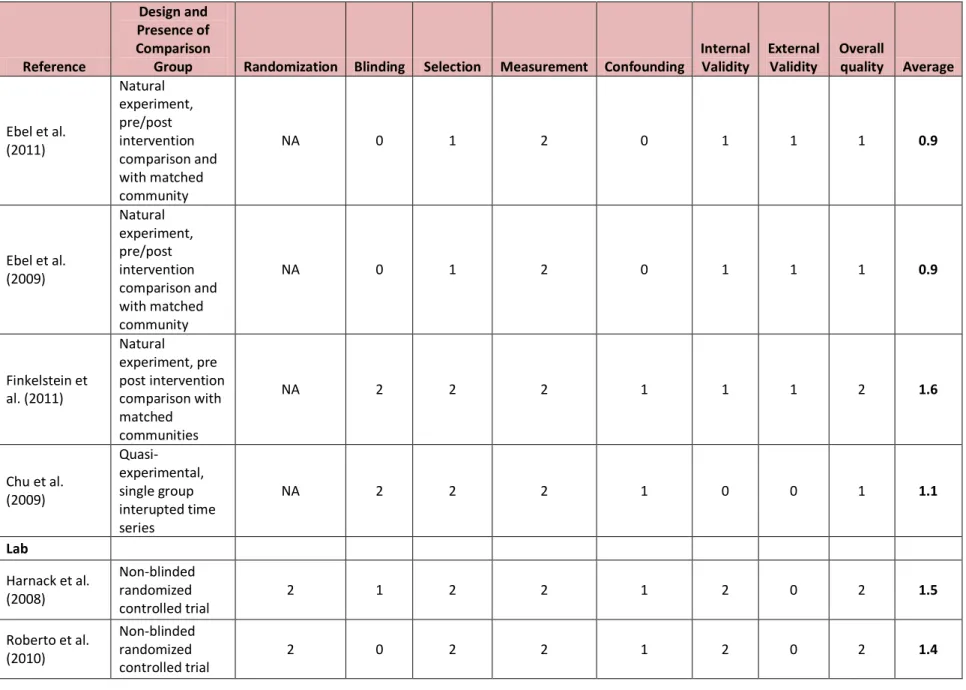
minimization of selection bias, minimization of measurement bias, minimization of confounding bias, internal validity, external validity and overall study quality. For each applicable variable, one author (JS) assigned scores of 2 for good, 1 for fair and 0 for poor. We then computed an average score for an overall quality measure. An average score greater than or equal to 1.5 was deemed to indicate a study of good quality, and an average score less than or equal to 0.5 was poor quality. Scores in between were considered fair quality. We excluded the randomization category for observational studies.
RESULTS
Search results
The initial search produced 150 citations on PUBMED. One author (JS) screened titles for relevance and further examined 28 abstracts. Seventeen articles underwent full text review, after which 12 articles were excluded. One article was included from a hand search. Six articles met the inclusion and exclusion criteria described above (Figure 1).
Study design
Included articles reported on studies conducted in two different types of settings; four articles reported on natural experiments of calorie menu label implementation in real world settings and two involved researcher manipulated variables in laboratory settings (Table 1). Natural experiments were conducted in cities that were early adopters of calorie labels and a college dining hall.3, 16-18
7
In the two laboratory studies, researchers randomized participants to different labeling conditions including or excluding calorie information.19, 20
Excluded studies
Several studies met some but not all inclusion criteria (Figure 1). Two recent studies were excluded because they reported only on intended behavior21, 22
which is likely to differ significantly from actual behavior and thus serves as a weak proxy. Even measuring calories purchased could be an inadequate proxy for calories consumed. In addition these studies were susceptible to a social desirability bias on the part of participants due to the nature of the study settings (a pediatrician’s office and a psychology lab).21, 22
Four studies had interventions or menu types that did not meet study criteria or did not publish calorie data.23-26
Finally, four studies assessed consumer attitudes, understanding and awareness of calorie information on menu boards,13, 27-29 factors important to the success of calorie labeling, but not measures of behavior.
Study quality
All studies included in this review had methodological shortcomings. Despite these limitations, two studies were judged to be of good quality18, 19
and four to be of fair quality3, 16, 17, 20
(Table 2).
The effect of calorie menu boards on calorie ordering and purchasing
8 purchased,3, 20
three reported no effect on calories purchased16, 17, 19
and one reported a slight increase in calories purchased.18
Among the observational studies, Ebel et al. found that in New York City, purchasing behavior of children and adolescents did not differ before and after calorie labels were
implemented on menu boards, with patrons purchasing a mean of 643 calories before labeling and 652 calories (p=0.82) after restaurants introduced menu labels. The authors also observed a non-significant change in purchasing behavior over the same time period among children and adolescents in Newark, NJ, where calorie labels were not introduced (pre-labeling time period 611 calories, post-labeling time period 673 calories, p=0.37).16
A companion study of adults also showed a non-significant difference in New York City. Adults purchased a regression-adjusted mean of 825 calories (95% CI: 779, 870) before calorie labeling and 846 calories (95% CI: 758, 889) after calorie labeling. There was also a non-significant trend among adults in Newark, NJ with 823 calories (95% CI: 802, 890) in the pre-labeling time period and 826 calories (95% CI: 746, 906) in the post-labeling time period.17
Though it was a small change, Finkelstein et al. did observe a small, statistically significant (but we do not think clinically significant) increase in calories purchased per
9
In a study of entrée purchasing in a college dining hall, Chu et al. reported a significant but modest decrease in calories per entrée sold during the two weeks that calorie labels were posted on menu boards (treatment). They calculated average calories per sale using sales data furnished by the cafeteria. In the two weeks before posting calorie information (pretreatment), the average energy content was 646.5 calories per entrée. This average dropped 12.4 calories per entrée sold on the first day of calorie posting (p=0.007). Of note, a linear regression analysis between pretreatment and treatment showed a reduction of -0.3 calories per day per entrée sold (p=0.56) during the treatment period. Average calories purchased per entrée increased at a rate of 1.5 calories per day per entrée (p=0.013) between the treatment and post-treatment period. Though statistically significant, an average reduction of 12.4 calories may not be clinically significant.
In contrast to studies utilizing only purchasing behavior, the two experimental studies conducted in laboratory settings allowed researchers to measure both calories ordered and calories consumed.19, 20
Harnack et al. found no significant difference in calories ordered among four different menu labeling groups. Participants given menus including calorie information ordered a mean of 873.6 calories, while participants with no calorie labels but prices altered to remove value pricing ordered a mean of 881.7 calories, participants with calorie labels and altered prices ordered a mean of 842.3 calories, and participants with control menus (no calorie information or price manipulation) ordered a mean of 827.5 calories (p=0.62).19
10
between the no label menus (2189 calories ordered) and the calorie label menus (1862 calories ordered, p=0.03), and also a significant difference between the no label menus and the calorie + information menus (1860 calories ordered, p=0.03). The difference between the calorie menus and calorie + information menus was not statistically significant (p=0.99). It is not clear why the difference in calories ordered between the groups appears to be much more clinically significant than differences noted in other studies.20
The average number of calories ordered was also very high for a single meal.
The effect of calorie menu labels on calorie consumption
As noted above, two studies measured calories consumed in addition to calories ordered or calories purchased. The distinction is an important one since consumers might theoretically respond to calorie posting on menus by changing the amount they eat rather than the amount they order. Harnack et al. found, however, that participants did not differ significantly in the number of calories they consumed by menu type (p=0.25), with participants with control menus
11 Sales volume
Two studies reported measures of sales volume. Finkelstein et al. and Chu et al. each found no significant difference in sales volume between periods with and without calorie posting. The two studies differed, however, in their findings about the influence of calorie posting on selecting healthier menu items. Finkelstein et al. found no significant differences in the rate of ordering healthy or unhealthy menu items before and after calorie posting.18
They used the company website to identify “healthy” items which were listed in a “Healthy
Highlights” area of the menu. Chu et al. reported a significant decrease in the sale of entrées with the highest energy content during the treatment period (slope=-0.766 entrees/day, p=0.007) and an increase in sale of entrées with the highest energy content after the treatment period (slope =1.541 entrees/day, p=0.005).3
DISCUSSION
Overall, the studies included in this review suggest that in both real world and experimental settings, calorie menu labeling has no effect or only a modest effect on calorie ordering and consumption. These results do not provide strong support for arguments that national expansion of calorie menu labeling will have any effect on reducing overweight and obesity. This supports the findings of the previous review from 2008.6
However, we should consider limitations of the current evidence as well as other important caveats before judging these policies.
12
As noted above each study included in this review had methodological limitations. Finkelstein et al. provides the best evidence regarding implementation of calorie menu labeling in a real world setting and was the study with the highest quality overall included in this review (Table 2). The researchers analyzed complete sales data furnished by a chain of restaurants in and surrounding King County, WA in a 13-month period during which the county implemented a calorie menu labeling requirement. The study provided more compelling data than two studies conducted in New York City, largely because researchers were able to track total monthly transactions and had complete sales data. In New York City, although researchers gathered data from multiple restaurants, they had no measure of overall volume of sales. This is important because one possible effect of calorie menu labeling is that consumers choose not to patronize restaurants where unhealthy choices dominate.
Researchers gathered data on purchasing behavior in two different ways. In the two studies from New York City, consumers were asked for their receipts and to fill out surveys as they exited the restaurant. This procedure was a strength of the studies because they were also able to gather demographic data and information about consumer values. In contrast, Finkelstein et al. and Chu et al. used electronic sales data furnished by the restaurants and cafeteria. This strategy was advantageous in that it allowed comparison of overall sales and potential changes in ordering patterns. However, they were not able to measure changes in the demographic
composition of the consumer population, or do subanalysis of demographic groups.
13
commented on environmental factors, such as public education campaigns accompanying the policy implementation, that might have contributed to behavior change over the course of the study. Since three of four studies showed that calorie labels did not lead to decreased calorie ordering, we can feel comfortable that results are not skewed toward a positive result.
In general, experimental studies, particularly randomized trials, are considered stronger designs because they have the potential to minimize confounding and selection bias. This may not be true in the calorie menu label studies to date. Though they employed randomized controlled design, the two experimental studies included in this review cannot easily be generalized to real world behavior and do not provide more compelling data than the observational research.
Both experimental studies have strong internal validity, indicating that they measure the effects of menu manipulation in a laboratory setting. However, the external validity of these laboratory studies is poor. Laboratory ordering and eating behavior cannot be generalized to real world food choices. Regardless of efforts to improve real world applicability or conceal study aims, participants are likely to order and eat differently when they are being monitored and eating in groups. Moreover, participants in both the studies were required to order from quick-service restaurants. In the real world, people have the choice to forgo such meals in favor of those prepared at home (though we are doing so less frequently as a nation).2, 15
Calorie menu labeling might encourage consumers to seek out alternative eating options if they find quick-service restaurants to be too unhealthy, an eventuality unaccounted for in these studies.
14
effect from calorie labeling of any study in this review, it deserves particular attention. Participants in the Roberto et al. research ordered over twice as many calories and consumed several hundred more calories than those in any other study.20 The authors offer no explanation for the increased caloric consumption, but it may indicate that ordering and eating habits deviated from the norm. Eating at a different time of the day (evening meal versus lunch) and menus including higher calorie options could also account for the difference, as could a higher percentage of male participants (49.8% versus 40.6%). Roberto et al. also appears to have included more participants who were overweight and obese, though summary variables of body mass index are not easy to compare between the two studies because one study reports average BMI while the other reports percentage of participants who were normal weight, overweight and obese.19, 20
Finally, Roberto et al. found a statistically significant difference in calories consumed between the calorie labeling and no calorie labeling conditions after their initial analysis of variance produced a non-significant result.20 Though the result is compelling, the technique is analytically questionable and deserves scrutiny.
Neither Roberto et al. nor Harnack et al. note whether study staff who interacted with participants and measured leftover food were blinded to menu conditions.19, 20
Blinded staff would do much more to allay concerns of potential differential measurement bias.
Directions for future research
Current research on calorie menu labeling suffers from two basic deficiencies.
Observational studies are insufficient for drawing causal inferences and experimental studies conducted in laboratory settings cannot simulate real world behavior, particularly when repeated exposure to menu labels may be required to influence choice.6, 14, 15, 19
15
governmental participation, large scale randomized trials could be conducted by gradually staging calorie menu label implementation on a state or county level in a randomized fashion. Researchers could then monitor ordering patterns, sales volume and even trends in overweight and obesity during parallel time periods in areas with and without labeling.15
However, both funding and lack of industry cooperation would likely constitute significant barriers to this sort of research.18, 19
Several of the studies in this review indicated that not all consumers or participants were aware of calorie labels.16, 17, 19 Accompanying labels with educational materials to increase awareness and explain their use improves effects on food choice.6
Future research should examine whether such efforts could also improve efficacy of calorie menu labeling.
16
and clarity of new labels. Future research should also explore understanding of various label formats to make sure that responses correspond to intended meaning.
Limitations of the current review
This review was limited in scope, in particular by restricting eligibility to studies published after 2006. In their previous review, Harnack and French concluded that calorie labeling might have a small effect on choice behavior.6
The search was also limited to PUBMED and Google Scholar and did not include other sources of peer reviewed or grey literature (a recent issue brief sites several unpublished studies of calorie menu labels).15
Finally, several excluded studies published since 2006 measure behavioral intent using calorie menu labels. That literature may provide an additional perspective on the potential for calorie menu labels to influence food choices.
CONCLUSION
From the evidence included in this review, it appears that calorie menu labeling does not have the intended effect of decreasing calorie ordering and consumption from quick-service restaurants. Large-scale studies are lacking, particularly those powered and designed to detect small changes in calorie consumption or varied response to labels among demographic groups. We also need longer-term, scientifically rigorous studies to determine whether prolonged exposure to calorie labels has an effect on rates of overweight or obesity, the health outcome of interest.15
17
18
REFERENCES
1. Nestle M. Health care reform in action--calorie labeling goes national. N Engl J Med. 2010;362(25):2343-2345.
2. Variyam JN. Nutrition labeling in the food-away-from-home sector: An economic assessment. Economic Research Service, United States Department of Agriculture; 2005;Economic Research Report Number 4.
3. Chu YH, Frongillo EA, Jones SJ, Kaye GL. Improving patrons' meal selections through the use of point-of-selection nutrition labels. Am J Public Health. 2009;99(11):2001-2005.
4. Mokdad AH, Serdula MK, Dietz WH, Bowman BA, Marks JS, Koplan JP. The spread of the obesity epidemic in the united states, 1991-1998. JAMA. 1999;282(16):1519.
5. Mokdad AH, Serdula MK, Dietz WH, Bowman BA, Marks JS, Koplan JP. The continuing epidemic of obesity in the united states. JAMA. 2000;284(13):1650.
6. Harnack LJ, French SA. Effect of point-of-purchase calorie labeling on restaurant and cafeteria food choices: A review of the literature. Int J Behav Nutr Phys Act. 2008;5:51. 7. Berman M, Lavizzo-Mourey R. Obesity prevention in the information age: Caloric information at the point of purchase. JAMA. 2008;300(4):433-435.
8. Jeffery RW, Baxter J, McGuire M, Linde J. Are fast food restaurants an environmental risk factor for obesity? Int J Behav Nutr Phys Act. 2006;3:2.
9. Pereira MA, Kartashov AI, Ebbeling CB, Van Horn L, Slattery ML, Jacobs DR. Fast-food habits, weight gain, and insulin resistance (the CARDIA study): 15-year prospective analysis. The Lancet. 2005;365(9453):36-42.
10. Patient protection and affordable care act of 2010. HR3590, 111th Cong. 2010;148(111):1001-10909. Available from:
http://frwebgate.access.gpo.gov.libproxy.lib.unc.edu/cgi-bin/getdoc.cgi?dbname=111_cong_public_laws&docid=f:publ148.111.pdf. Accessed 11/7/2010. 11. Blumenthal K, Volpp KG. Enhancing the effectiveness of food labeling in restaurants.
JAMA. 2010;303(6):553.
12. Dumanovsky T, Huang CY, Bassett MT, Silver LD. Consumer awareness of fast-food calorie information in new york city after implementation of a menu labeling regulation. Am J Public Health. 2010;100(12):2520.
19
14. Larson N, Story M. Menu labeling: Does providing nutrition information at the point of purchase affect consumer behavior. Healthy Eating Research, A National Program of the Robert Wood Johnson Foundation; 2009. Available from:
http://www.rwjf.org/files/research/20090630hermenulabeling.pdf. Accessed Accessed 10 April 2011.
15. Allison D. Evidence, discourse and values in obesity-oriented policy: Menu labeling as a conversation starter. Int J Obes. 2011.
16. Elbel B, Gyamfi J, Kersh R. Child and adolescent fast-food choice and the influence of calorie labeling: A natural experiment. Int J Obes (Lond). 2011.
17. Elbel B, Kersh R, Brescoll VL, Dixon LB. Calorie labeling and food choices: A first look at the effects on low-income people in new york city. Health Aff (Millwood). 2009;28(6):w1110-21.
18. Finkelstein EA, Strombotne KL, Chan NL, Krieger J. Mandatory menu labeling in one fast-food chain in king county, washington. Am J Prev Med. 2011;40(2):122-127.
19. Harnack LJ, French SA, Oakes JM, Story MT, Jeffery RW, Rydell SA. Effects of calorie labeling and value size pricing on fast food meal choices: Results from an experimental trial. Int J Behav Nutr Phys Act. 2008;5:63.
20. Roberto CA, Larsen PD, Agnew H, Baik J, Brownell KD. Evaluating the impact of menu labeling on food choices and intake. Am J Public Health. 2010;100(2):312-318.
21. Tandon PS, Wright J, Zhou C, Rogers CB, Christakis DA. Nutrition menu labeling may lead to lower-calorie restaurant meal choices for children. Pediatrics. 2010;125(2):244-248.
22. Gerend MA. Does calorie information promote lower calorie fast food choices among college students? J Adolesc Health. 2009;44(1):84-86.
23. Temple JL, Johnson K, Recupero K, Suders H. Nutrition labels decrease energy intake in adults consuming lunch in the laboratory. J Am Diet Assoc. 2010;110(7):1094-1097.
24. Vyth EL, Steenhuis IH, Heymans MW, Roodenburg AJ, Brug J, Seidell JC. Influence of placement of a nutrition logo on cafeteria menu items on lunchtime food choices at dutch work sites. J Am Diet Assoc. 2011;111(1):131-136.
25. Lowe MR, Tappe KA, Butryn ML, et al. An intervention study targeting energy and nutrient intake in worksite cafeterias. Eating Behav. 2010;11(3):144-151.
20
27. Dumanovsky T, Huang CY, Bassett MT, Silver LD. Consumer awareness of fast-food calorie information in new york city after implementation of a menu labeling regulation. Am J Public Health. 2010;100(12):2520.
28. Lando AM, Labiner-Wolfe J. Helping consumers make more healthful food choices:
21 Figure 1
Flow Chart
150 Titles identified
127 Titles excluded:
- 62 Published before 2006
- 65 Unrelated
28 Abstracts pulled for review
11 Abstracts excluded:
- 6 Non-experimental
- 4 Assessing consumer knowledge or
preferences
- 1 Assessing consumer awareness
17 Full text articles pulled for in-depth review
1 Article included from bibliography search
6 Articles included in review
12 Articles excluded:
- 2 Non-experimental
- 4 Assessing consumer knowledge or
preferences
- 2 Simulated meal choices
- 4 Wrong menu type 5 Articles included
Table 1
22 Reference
Design and Presence
of Comparison Group Intervention/ Measures Setting
Number of Subjects/
Restaurants Result
Evidence grade
Ebel et al. (2011)
Natural experiment, pre/post intervention comparison and with matched community
Calorie labels added to chain restaurant labels in New York City. Survey administered outside fast food restuarants.
New York City and Newark, NJ (as comparitor). Fast food restaurants in low-income neighborhoods
349 children and adolescents
Mean calories purchased in NYC pre and post labeling 643 v 652 (p= 0.82), Newark 611 v 673 (p=0.37).
0.9
Ebel et al. (2009)
Natural experiment, pre/post intervention comparison and with matched community
Calorie labels added to chain restaurant labels in New York City. Survey administered outside fast food restuarants.
New York City and Newark, NJ (as comparitor). Fast food restaurants in low-income neighborhoods
1156 adults over 18
Regression-Adjusted nutrient content in NYC and Newark before and after with 95% CI. NYC: 825 (779, 870) post 846 (758, 889). Newark 823 (802, 890) post 826 (746, 906).
0.9
Finkelstein et al. (2011)
Natural experiment, pre post intervention comparison with matched communities
Calorie labels added to chain restaurant labels in King County Seattle, then drive-thru lanes. Total monthly transactions and calories per transaction.
King County, WA and several stores from surrounding area
21 randomly selected Taco Time locations and 7 locations outside King County
Calories per transaction King County pre-period 1,211 v post-period 1 1,217 v post-period 2 1,214. Calories per transaction Non-King County pre-period 1,391 v. post-period 1 1,392 v post-period 2 1,376.
1.6
Chu et al. (2009)
Quasi-experimental, single group
interupted time series
Calorie labels added to entrees in college dining hall. Used electronic sales data to track calories of entrees sold
Dining hall, Ohio State
University NA
Calories per entrée sold at pre 645.5, First day of tx period -12.4, decreased of 0.298 calories/day), post treatment increases 1.512/day
Table 1
23 Reference Design and Presence
of Comparison Group Intervention/ Measures Setting
Number of Subjects/ Restaurants
Result Evidence grade
Lab
Harnack et al. (2008)
Non-blinded randomized controlled trial
Participants order from 4 menu labeling conditions, control that lists items with standard pricing scheme, Item + Calorie menu, Item + Non-value menu pricing, Calorie + Non-Value menu pricing. Measured calories ordered and calories consumed
Conference room of suburban hotel and church basement in Minneapolis St. Paul, MN
594 adolescents and adults 16 or older
Mean calories ordered: Calorie 873.6, Price 881.7, Calorie+Price 842.3, Control 827.5 (p=0.62); Mean calories consumed: Calorie 804.7 Price 813.3 Calorie+Price 761.0 Control 739.0 (p=0.25)
1.5
Roberto et al. (2010)
Non-blinded randomized controlled trial
Participants order from 3 menu labeling conditions, one that lists the items, one that lists items and calories, one that lists items, calories and daily guideline calories.
Measured calories ordered and calories consumed
Laboratory in New Haven, CT
303 adults 18 and older
Mean calories ordered: Control 2189 calories, label condition 1862 calories (p=0.03), label + info condition (1860 calories ordered) (p=0.03), no significant difference between two label conditions. No significant difference in calories consumed overal (p=0.12), significant difference between no label, 1466 and combined label condition 1289 (p=0.04).
Table 2 24 Reference Design and Presence of Comparison
Group Randomization Blinding Selection Measurement Confounding
Internal Validity
External Validity
Overall
quality Average
Ebel et al. (2011) Natural experiment, pre/post intervention comparison and with matched community
NA 0 1 2 0 1 1 1 0.9
Ebel et al. (2009) Natural experiment, pre/post intervention comparison and with matched community
NA 0 1 2 0 1 1 1 0.9
Finkelstein et al. (2011) Natural experiment, pre post intervention comparison with matched communities
NA 2 2 2 1 1 1 2 1.6
Chu et al. (2009) Quasi-experimental, single group interupted time series
NA 2 2 2 1 0 0 1 1.1
Lab
Harnack et al. (2008)
Non-blinded randomized controlled trial
2 1 2 2 1 2 0 2 1.5
Roberto et al. (2010)
Non-blinded randomized controlled trial
25
Simplifying Healthful Choices at Quick-Service Restaurants: Consumer Views on Nutrition Labels That Contextualize Energy Content with Physical Activity
Introduction
As part of the Patient Protection and Affordable Care Act of 2010 lawmakers passed a calorie labeling requirement for all chain restaurants with 20 or more locations. If enacted, the policy will require these restaurants to list the calorie information in the foods and beverages they serve. This new legislation builds upon efforts already underway in some states to give consumers more information about the foods they purchase away from the home.1 Theoretically, if consumers have more complete information, they will make healthier choices about the foods they choose and consume (they may still purchase the same foods but eat less). Restaurants and manufacturers might also respond in a favorable manner by improving the nutritional content of their foods to satisfy consumer demand for healthier options.2, 3
Nutrition labeling is one of many policy approaches proposed to address the increasing prevalence of overweight and obesity in the United States.4, 5 In particular, researchers and
policymakers have begun to focus on how the increasing reliance on food away from home in the US diet2, 6 may be contributing to poor health.3, 7 Food away from home now accounts for over 30% of daily caloric intake and 50% of yearly food spending.2, 3, 6 This trend is concerning because foods consumed away from home typically have more calories, fat and sodium than foods prepared in the home.2 Frequent consumption of food away from home has also been linked to higher rates of overweight and obesity.8, 9
26
York City in 2006. The New York City law required restaurants with 15 or more locations to list calorie information for each item on the menu in prominent view both on menu boards and menus. After several legal challenges, the city began enforcing mandatory labeling with fines in 2008. Shortly thereafter, in 2010, Congress passed the Patient Protection and Affordable Care Act which included a national menu labeling law for all restaurants with 20 or more locations.1, 10
Though momentum has gathered behind menu labeling policies as a tool for combatting overweight and obesity, evidence to support its efficacy is less robust. In a 2008 review, Harnack and French were able to identify only six studies that tested the effects of calorie labeling on consumer choice.6 They concluded that from the current evidence, the effects of calorie labeling appeared to be weak or inconsistent.6 Since the publication of that review, new evidence on calorie labeling has had conflicting results,3, 11, 11-15 but supports Harnack and French’s conclusion that the effect of calorie menu labels on choice behavior remains uncertain.
27 METHODS
Study design
We used focus groups to explore preference regarding candidate labels, gauge understanding of their content, and assess their potential for influencing food decisions. We chose to field three focus groups as we anticipated achieving saturation after three sessions. Study procedures and the focus group guide received approval from the Institutional Review Board at the University of North Carolina at Chapel Hill (UNC). We received funding through the University Research Council at UNC.
Study location
We conducted three focus groups in Chapel Hill, North Carolina. The site provided good access to a socially, ethnically and demographically diverse population.
Participants
Participants were recruited through convenience sampling. We contacted healthy volunteers from an IRB-approved list of previous research participants maintained by one investigator (AV). We also sent campus-wide invitational emails to UNC students, faculty and staff, and posted flyers at the UNC Family Medicine Center, the UNC Clinical and Translational Research Center and community locations including grocery stores, gyms and churches.
To qualify, participants had to be 25 years or older. We wanted feedback from participants who had experience shopping in grocery stores and eating at quick-service
28
food from a restaurant in the past two weeks. Exclusion criteria included living in a dormitory, non-English speaking and prior special training in nutrition. A questionnaire administered by phone was used to establish eligibility.
We invited 10 participants for each focus group session under the assumption that 20% could fail to show. All participants who arrived for the focus group received a $20 gift card. We included the first eight to arrive in the focus group discussion and served lunch to participants.
Focus group discussions
The focus groups were facilitated by two investigators (JS and SD) with JS acting as moderator and SD observing and taking detailed notes. The moderator’s guide (Appendix 1) was developed through collaboration of the study investigators, who sought additional feedback from colleagues with expertise in qualitative research methods. On arrival, participants completed a questionnaire on demographic information and the Newest Vital Sign, a rapid health literacy assessment.18
After an icebreaker, participants were asked to describe how they make decisions about which foods to choose, and whether they pay attention to nutrition or healthfulness of their diets. They then were asked specifically to “walk the group” through their rationale for making a food choice in a quick-service restaurant.
29
to and contextually appropriate. We asked consumers to compare two energy balance labels and a label stating the number of calories and their contribution (%) of the recommended daily allowance. Participants were asked to describe what each of the label formats meant. They were also asked how they might change the label. In the context of the discussion on label
refinements, participants were shown iterations of labels with slight variations, for example expressing the amount of physical activity in mileage rather than time, changing the picture on the label, changing the font, and altering the wording (Figure 2).
Next, participants were asked whether and how they thought the labels might influence their food choices when at a quick-service restaurant. They were then asked to talk about the potential role for these labels for prepackaged food products like cereal, and whether they would use them. Finally, participants had the opportunity to talk about any food labeling issues we had not covered in the focus groups.
Label design
We designed a variety of menu labels in consultation with experts in nutrition and medical illustration. Many variables including body weight and basal metabolic rate affect energy expenditure for individuals. To calculate average energy expenditure for labels depict ing running or walking, we used an average body weight of 160 pounds. We used an energy
30
the energy expenditure rate. To calculate the number of miles that would be required to expend the calories in a food item, we divided the total time required by the running or walking pace. Sample calculations are included (Appendix 2). We obtained information on the caloric content of food and beverage items from the company websites.20, 21
Analysis
Focus group conversations were recorded using a digital voice recorder and transcribed into a Microsoft Word file. Transcripts were compared with detailed notes taken by the assistant moderator during the sessions to verify their accuracy and clarify any instances where the
transcriber was not able to identify the speaker. The moderator and assistant moderator reviewed the transcripts together. The transcripts were then independently reviewed by two other
investigators to identify any problems.
Once the transcripts were finalized, we used Atlas.ti Qualitative Data Analysis software in consultation with a qualitative data analysis expert who did not take part in the planning or focus groups. We systematically analyzed the discussions and classified comments by coding? common themes and attitudes. We then extracted representative verbatim statements where available. Quantitative data including group demographic characteristics were analyzed using STATA.
ANTICIPATED RESULTS
31 Food choices and nutritional information
Participants will likely say that a number of factors influence their food choices including personal preferences, family preferences, convenience, price, taste, experience and nutrition or health concerns. We do not anticipate nutrition and health to be the primary concerns for most participants, but they may be factors that some of the participants consider important. They may use information from parents, children, teachers, health care professionals, television, books, magazines and nutrition labels to help decide what foods are healthy or nutritious.
We expect that people will have different strategies to choose food for meals that they plan with anticipation versus those that they purchase or make without planning. People may pay less attention to nutritional content of unplanned meals. Accordingly, we expect that participants will say that they make food choices in a quick-service restaurant by considering price, taste, and cravings more than nutritional content of the foods. Since participants know this is a study on nutrition labels, they may be primed to discuss nutrition in their responses, so our groups may focus more on nutrition and health factors than has been seen in other studies.
Participant understanding of labels
32
item,” we expect that the labels will need to be refined to convey this information. Responses about the meaning of various labels will likely convey some but not all the information we intend to convey. They also could be misinterpreted completely.
Participant preferences for label types
In designing the labels, we expect that more participants will identify with icons that depict walking than those that depict running. Walking is an activity that more people can do, so people may find the information more applicable to their lives. We also expect that information on mileage may be easier to understand and less discouraging than information presented in minutes or hours.
Unintended effects of labels
In addition to misinterpreting the meaning of our labels, participants may also be confused about what the labels imply about the recommended balance of diet and exercise. We do not want to imply that all calories consumed must be expended with physical activity to maintain a healthy energy balance. Our objective is to provide a better format than simple calorie counts for contextualizing energy content of different foods. Through this study, we hope to gather qualitative data to guide effective application of our labels either as an addition to or replacement for numerical calorie information.
Participants may also report that they find the labels discouraging because they would not be able to carry out a particular physical activity, because the depicted activity is more than they do habitually, or because the time to burn off an item is so great that it is not worth doing
33
influence consumer choice than consumer satisfaction with a label. Once developed, we can test whether consumers choose lower calorie meals and eat fewer calories when using our label.
DISCUSSION
This is the first qualitative study assessing consumer understanding of a label that presents calories in terms of a physical activity equivalent. Our study provides a foundation for further development and testing of such labels in future research.
Nutrition labels and point-of-purchase menu labeling have the potential to influence consumer choice provided that consumers value the nutritional content of what they eat and have the literacy and numeracy skills to understand and utilize the information. Stated differently, their efficacy depends on relevance and comprehension. The Affordable Care Act mandated implementation of calorie menu labels as one strategy to help reduce the prevalence of
overweight and obesity. Current evidence suggests calorie menu labels are insufficient to achieve this goal,3, 6, 11-15, 24, 25 which may be a problem of relevance, comprehension or both.
A functional label format must overcome some of the barriers that limit effectiveness of current labeling strategies. Several strategies being put into practice include calorie menu labels, front-of-the-pack nutrition labels on prepackaged foods in grocery stores, and universal symbols designating healthy foods. Research on nutrition label use and understanding indicates that both vary considerably among different demographics.26 In particular, consumers have difficulty contextualizing individual food choices within the total diet.24, 27-29 Even when nutrition
34
consumers concerned with nutrition may lack the self-control required to make the individual healthy choices necessary to achieve lifestyle change.24
A few publications have suggested nutrition labels with a physical activity equivalent might help consumers make lower calorie choices,2, 24 and two studies have assessed
acceptability of a physical activity label format.16, 17 Bleich and Pollack found respondents to be equally divided in their preference for standard calorie labels, physical activity equivalent labels and percentage of total daily calories.16 Fitch et al. piloted a physical activity equivalent label beside calorie information and found that a majority of participants preferred calorie
information.17 Neither of these studies assessed consumer understanding of different formats or tested comprehension and usability of different designs.
Strengths of the current study
Strengths of this study include the format and label design process. Focus groups are a valuable tool for gathering the breadth of opinions on a subject.30 Through open-ended
questioning, we were able to gather verbatim interpretation of various labels without prompting and report conveyed meaning. This helped us improve the label design and create labels that could be widely understood. We refined the labels in an iterative process, using feedback from early focus groups to guide label development throughout the study.
Limitations of the current study
35
Our recruitment was in a limited geographic area, and consumers might respond differently to our labels in different parts of the state or country. Likewise, those likely to respond to
recruitment flyers, emails and calls might have different opinions of the labels than those less motivated to participate. We also required participants to be over 25 years of age. We targeted this population because we thought people over 25 would be more likely to make food choices for themselves and others, and therefore consider more variables. We also wanted participants who made food choices in a variety of settings and thought younger participants, particularly college students, might rely disproportionately on food away from home for their total diet. This study may not accurately portray how consumers under 25 might view physical activity
equivalent labels.
In using focus groups, our study goal was not to provide a quantitative assessment of these labels. Thus we did not test label performance or compare our labels to other formats. We are interested in designing a physical activity equivalent label to compliment or replace calorie information on quick-service restaurant menus. But our study does not provide information on whether or how consumers might use physical activity equivalent labels. Moreover, it cannot predict whether these labels positively affect consumer choice behavior or the prevalence of overweight and obesity.
Directions for future research
36
the format, and test our physical activity equivalent labels alongside calorie information. The survey will give us quantitative data to strengthen the label format. Once the format is finalized, we can perform laboratory-based, randomized studies of consumer behavior using menus with a variety of label types, like those that have been used to test calorie menu labels.11, 15 Because laboratory-based studies are poorly generalizable to real world behavior, large-scale studies implementing different label types in quick-service restaurants will be necessary to fully measure their effects on the prevalence of overweight and obesity. Such studies would require
governmental and industry participation.
CONCLUSION
Public health advocates and policy-makers need more and better information as they promote and implement various tools to combat overweight and obesity. Calorie menu labeling is an attractive option in that it provides information a majority of consumers want.16, 31 To have a positive effect on the prevalence of obesity, consumers would have to respond to new menu labels by purchasing and consuming fewer calories, eating more at home, or patronizing
restaurants that provide lower-calorie options. The food service industry might also respond, as it did when the government expanded nutrition labeling laws on packaged products in the 1990s, by improving the nutritional profile of its offerings.2 Early studies of calorie menu labels indicate they may not be having their intended effect.3, 6, 11-15, 25
37
overweight and obesity than labels that only address nutritional content. More research is needed to establish whether consumers can and will apply such information in a way that leads to
healthier living.
REFERENCES
1. Nestle M. Health care reform in action--calorie labeling goes national. N Engl J Med. 2010;362(25):2343-2345.
2. Variyam JN. Nutrition labeling in the food-away-from-home sector: An economic assessment. Economic Research Service, United States Department of Agriculture; 2005;Economic Research Report Number 4.
3. Chu YH, Frongillo EA, Jones SJ, Kaye GL. Improving patrons' meal selections through the use of point-of-selection nutrition labels. Am J Public Health. 2009;99(11):2001-2005.
4. Mokdad AH, Serdula MK, Dietz WH, Bowman BA, Marks JS, Koplan JP. The spread of the obesity epidemic in the united states, 1991-1998. JAMA. 1999;282(16):1519.
5. Mokdad AH, Serdula MK, Dietz WH, Bowman BA, Marks JS, Koplan JP. The continuing epidemic of obesity in the united states. JAMA. 2000;284(13):1650.
6. Harnack LJ, French SA. Effect of point-of-purchase calorie labeling on restaurant and cafeteria food choices: A review of the literature. Int J Behav Nutr Phys Act. 2008;5:51. 7. Berman M, Lavizzo-Mourey R. Obesity prevention in the information age: Caloric information at the point of purchase. JAMA. 2008;300(4):433-435.
8. Jeffery RW, Baxter J, McGuire M, Linde J. Are fast food restaurants an environmental risk factor for obesity? Int J Behav Nutr Phys Act. 2006;3:2.
9. Pereira MA, Kartashov AI, Ebbeling CB, Van Horn L, Slattery ML, Jacobs DR. Fast-food habits, weight gain, and insulin resistance (the CARDIA study): 15-year prospective analysis. The Lancet. 2005;365(9453):36-42.
10. Patient protection and affordable care act of 2010. HR3590, 111th Cong. 2010;148(111):1001-10909. Available from:
38
12. Elbel B, Gyamfi J, Kersh R. Child and adolescent fast-food choice and the influence of calorie labeling: A natural experiment. Int J Obes (Lond). 2011.
13. Elbel B, Kersh R, Brescoll VL, Dixon LB. Calorie labeling and food choices: A first look at the effects on low-income people in new york city. Health Aff (Millwood). 2009;28(6):w1110-21.
14. Finkelstein EA, Strombotne KL, Chan NL, Krieger J. Mandatory menu labeling in one fast-food chain in king county, washington. Am J Prev Med. 2011;40(2):122-127.
15. Harnack LJ, French SA, Oakes JM, Story MT, Jeffery RW, Rydell SA. Effects of calorie labeling and value size pricing on fast food meal choices: Results from an experimental trial. Int J Behav Nutr Phys Act. 2008;5:63.
16. Bleich SN, Pollack KM. The publics' understanding of daily caloric recommendations and their perceptions of calorie posting in chain restaurants. BMC Public Health. 2010;10:121. 17. Fitch RC, Harnack LJ, Neumark-Sztainer DR, et al. Providing calorie information on fast-food restaurant menu boards: Consumer views. Am J Health Promot. 2009;24(2):119-132. 18. Weiss BD, Mays MZ, Martz W, et al. Quick assessment of literacy in primary care: The newest vital sign. Ann Fam Med. 2005;3(6):514-522.
19. Blair S, Dunn A, Marcus B, Carpenter R, Jaret P. Active Living Every Day. Champaign, IL: Human Kinetics; 2001.
20. The Coca Cola Company. Nutritional information (U.S.). http://www.thecoca-colacompany.com/us_nutrition.html. Accessed May 12, 2011.
21. Subway. Nutritional information.
http://www.subway.com/applications/NutritionInfo/index.aspx. Accessed May 12, 2011. 22. Goldsworthy RC, Schwartz NC, Mayhorn CB. Interpretation of pharmaceutical warnings among adolescents. Journal of Adolescent Health. 2008;42(6):617-625.
23. Daniel KL, Goldman KD, Lachenmayr S, Erickson JD, Moore C. Interpretations of a teratogen warning symbol. Teratology. 2001;64(3):148-153.
24. Blumenthal K, Volpp KG. Enhancing the effectiveness of food labeling in restaurants. JAMA. 2010;303(6):553.
25. Allison D. Evidence, discourse and values in obesity-oriented policy: Menu labeling as a conversation starter. Int J Obes. 2011.
39
27. Cowburn G, Stockley L. Consumer understanding and use of nutrition labelling: A systematic review. Public Health Nutr. 2005;8(01):21-28.
28. Grunert KG, Wills JM, Fernández-Celemín L. Nutrition knowledge, and use and
understanding of nutrition information on food labels among consumers in the UK. Appetite. 2010;55(2):177-189.
29. Grunert KG, Wills JM. A review of european research on consumer response to nutrition information on food labels. Journal of Public Health. 2007;15(5):385-399.
30. Krueger RA. Focus Groups : A Practical Guide for Applied Research. Los Angeles: SAGE; 2009.
31. Larson N, Story M. Menu labeling: Does providing nutrition information at the point of purchase affect consumer behavior. Healthy Eating Research, A National Program of the Robert Wood Johnson Foundation; 2009. Available from:
40 Figure 1
90 min
Ham Sandwich………
Turkey Sandwich………
Veggie Delight….………
88 min
41 Figure 2
23 min
Ham Sandwich………
Turkey Sandwich………
Veggie Delight….………
22 min
42
1.5 hrs
Ham Sandwich………
3 miles
Ham Sandwich………
Table 1: Demographic characteristics of focus group participants
43
% N
Gender Female Male Race African-American American Indian Asian/Pacific Islander Caucasian Latino/Hispanic Other Age 25-40 41-60 >60 Education
< High school High school graduate Some college
College graduate or higher Household Income <$20,000 $20,000-$49,999 $50,000-$74,999 $75,000-100,000 >$100,000
Live with significant other Yes
No
Live with children Yes
No
Weekly visits to grocery store 0-1
2-3 >3
Weekly visits to fast food restaurant
Table 2: Health Literacy of focus group participants
44
% N
Health Literacy
>50% chance of marginal or limited literacy
45 Appendix 1: Focus Group Guide
Project: Design nutrition labels that use physical activity to contextualize energy information. For example, we will have a picture of a running person with a statement "You would have to run 50 minutes to burn the calories in this sandwich." The focus group will be used to get consumer reactions to label design, refine the design, and get an idea of whether consumers understand the labels.
Questions:
1. Icebreaker : Where do you get your groceries?
2. How do you pick what food you eat?
3. How do you decide what foods are healthy or nutritious?
4. Think back to the last time you were at a fast food restaurant like (McDonalds, Burger King or Subway) ordering from the menu. How did you decide what to order?
At this point, we will distribute the labels to the group. We may have a large poster of the labels so that we can talk about them. We also may put them on actual packaged food items. We will include several of our exercise label formats and one modeled after current calorie labels on menus.
5. a. Describe what symbol A means. b. Describe what symbol B means. c. Describe what symbol C means.
6. Would you change anything on this label?
- Which label do you like better? SHOW EXAMPLE OF LABEL THAT EXPRESSES ENERGY INFORMATION IN DISTANCE (MILEAGE) RATHER THAN TIME - Which label do you like better? SHOW EXAMPLE OF LABEL WITH DIFFERENT
FONT
- Which label do you like better? SHOW EXAMPLE OF LABEL WITH DIFFERENT PICTURE
- Which label do you like better? SHOW EXAMPLE OF LABEL THAT HAS AVERAGE RECOMMENDED DAILY EXERCISE
7. Imagine yourself back at a fast food restaurant. If you had one of these labels in front of you, how would it affect what you ordered?
46
47
Appendix 2: Sample calculations for menu labels
Example: Subway Ham Sandwich = 290 kcal Energy expenditure for walking labels:
Walking at 30 min/mile pace = 3.2 kcal/min (for 160 lbs adult)
Energy expenditure for running labels:
Running at 10 min/mile pace = 12.8 kcal/min (for 160 lbs adult)