Vol. 3, No. 2, pp 140-151 Summer 2009
Performance Analysis of Screening Unit in a Paper Plant Using Genetic
Algorithm
Rajiv Khanduja1, P. C. Tewari 2, R.S. Chauhan3 1
Asstt. Professor, Department of Mechanical Engineering, SKIET, Kurukshetra-136118, Haryana, India. [email protected]
2
Asstt. Professor, Department of Mechanical Engineering, NIT, Kurukshetra-136119, Haryana, India. [email protected]
3
Asstt. Professor, Department of Electronic and Communication Engineering, JMIT, Radaur, Yamuna Nagar-135133, Haryana, India
[email protected] ABSTRACT
This paper deals with the performance analysis of the screening unit in a paper plant using Genetic Algorithm. The screening unit in the paper plant has four main subsystems. These subsystems are arranged in series and parallel configurations. Considering exponential distribution for the probable failures and repairs, the mathematical formulation of the problem is done by Markov birth-death process. Using probabilistic approach, the differential equations are developed. These equations are then solved using normalizing conditions to determine the steady state availability of the screening unit. The performance behavior of each subsystem of the screening unit has also been analyzed using Genetic Algorithm. So, the findings of the present paper will be highly useful to the plant management for the timely execution of proper maintenance decisions and hence to enhance the system performance.
Keywords: Performance Modeling, Screening Unit, Genetic Algorithm. 1. INTRODUCTION
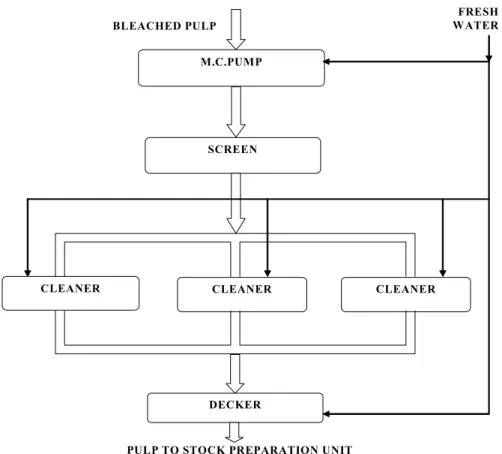
The paper industry comprises of large complex engineering systems arranged in series, parallel or a combination of both the configurations. Some of these systems are chipping, cooking, washing, bleaching, screening, stock preparation and paper production. These systems are normally arranged in hybrid configuration. The important process of a paper industry, upon which the quality of paper depends, is the screening process. In the process of paper formation, the chips from storage are fed in to a digester to form the pulp which is processed through various subsystems called knotter, decker, opener and washing. These systems have been discussed in detail by Kumar. (1988, 1989, 1993). The washed pulp is kept in a chamber where chlorine, at a controlled rate, is pressed through the pulp for a few hours. The pulp is passed over a filter and washer in four stages to get chlorine free white pulp. The white bleached pulp so obtained, is first passed through a screen to separate out
oversize and odd shape particles. It is then processed through a cleaner and finally sent to paper making machine. The schematic flow diagram of screening unit is shown in figure1.
SCREEN M.C.PUMP
CLEANER
DECKER CLEANER BLEACHED PULP
PULP TO STOCK PREPARATION UNIT CLEANER
FRESH WATER
Figure 1 Schematic flow diagram of screening unit
Due to the continuous advancement in technology and automation in manufacturing, the complexity of equipment increases so rapidly that the reliability of the equipment has come in focus and emerged as a thrust area especially for the mass production and process industries. So, it is almost impossible to survive without reliable systems. Thus, all the working engineering systems are expected to remain operative with maximum efficiency for the maximum duration i.e. reliable operation. The importance of reliable operation has been realized in large complex process industries such as chemical, fertilizer, sugar, paper, oil refinery, textile etc. The goal of high productivity with minimum parallel/standby units, minimum storage capacity, minimum losses and minimum cost of failures is difficult to achieve in these industries.
Such industries have continuous operation and hazardous work environment. So the high system availability can be achieved by quantitative analysis method using various concepts of industrial engineering and operation research. These analyses performed for the system availability give the factual knowledge in the form of failure and repair rates of various systems/subsystems. However, such systems / subsystems are subjected to random failures due to poor design, lack of operative skills and wrong manufacturing techniques etc. causing heavy production losses. The failed systems can be brought back to the working states after repairs and / or replacement of some components in minimum possible down time through effective maintenance planning and control.
The factory operating conditions and the repair strategies play an important role in keeping the system operative with full capacity for maximum duration. This can be accomplished only through performance evaluation and analysis of each working subsystem of the plant concerned. The system performance can be quantified in terms of the availability if the real system is modeled mathematically and analyzed in real working conditions. It can be further optimized using some advanced optimization techniques such as fuzzy approach, ant colony optimization, genetic algorithms etc.
2. LITERATURE REVIEW
The available literature reflects that several approaches have been used to analyze the steady state behavior of various systems. Dhillon et al. (1981) have frequently used the Markovian approach for the availability analysis, using exponential distribution for failure and repair times. Kumar et al. (1988, 1989 and 1993) dealt with reliability, availability and operational behavior analysis for different systems in the paper plant. Srinath (1994) has explained a Markov model to determine the availability expression for a simple system consisting of only one component Gupta et al. (2005) have evaluated the reliability parameters of butter manufacturing system in a diary plant considering exponentially distributed failure rates of various components. The reliability of the system is determined by forming the differential equations with the help of transition diagram using Markovian approach and then solving these differential equations with the help of fourth order Runge-Kutta method. They applied the recursive method for calculating long run availability and MTBF using numerical technique.
Sunand et al. (1999) dealt with maintenance management for ammonia synthesis system in fertilizer plant. Shooman (1996) suggested different methods for the reliability computations of systems with dependent failures. Sunand et al. (2007) discussed simulated availability of CO2 cooling system in a fertilizer plant. Rajiv et al. (2008) have developed decision support system for stock preparation system of paper plant. They also dealt with availability of bleaching system of paper plant. Gupta et al. (2008) developed the performance models and decision support system for a feed water unit of thermal power plant with the help of mathematical formulation based on Markov Birth-Death process using probabilistic approach. In this the decision matrices are developed which provide the various performance levels for different combinations of failure and repair rates for all subsystems. The model developed helps in to decide about correct and orderly execution of proper maintenance in order to enhance the performance of the feed water unit of the thermal power plant. Kalyanmoy Deb (1995) has explained the optimization techniques and how they can be used in the engineering problems.
Goldberg (2001) made a systematic study on G.A. mechanism, and identified three basic operators: reproduction, crossover and mutation. So that the G.A. has higher opportunity for obtaining near optimal solutions. Tewari et al. (2003, 2005) dealt with development of decision support system of refining system of sugar plant. They determined the availability for the refining system with elements exhibiting independent failures and repairs or the operation with standby elements for sugar industry. They also dealt with mathematical modeling and behavioral analysis for a refining system of a sugar industry using Genetic Algorithm.
Castro and Cavalca (2003) presented an availability optimization problem of an engineering system assembled in series configuration which has the redundancy of units and teams of maintenance as optimization parameters. Genetic Algorithm was used to reach the objective of availability, considering installation and maintenance costs. Chales and Kondo (2003) tackled a multi objective combinatorial optimization problem. They used Genetic Algorithm to optimize the availability and
cost of a series and parallel repairable system. Ying-Shen Juang et al. (2008) proposed a genetic algorithm based optimization model to optimize the availability for a series parallel system. The objective is to determine the most economical policy of component’s mean time between failure (MTBF) and mean time to repair (MTTR). Wang et al. (2009) performed the reliability optimization of a series-parallel system with fuzzy approach.
From the literature review, it has been observed that most of the researchers have confined their work to the development and analysis of theoretical models only. Such works are of little practical significance. Only a few researchers have developed real models for actual plant conditions and those too have not given any useful suggestions regarding performance enhancement of industrial systems. Now in order to fulfill this deficiency, efforts have been made in the present research paper to develop performance model based on real situation for the screening unit. The performance in terms of availability has been evaluated on the basis of Markov birth-death process. After that, the performance optimization using Genetic Algorithm Technique (G.A.T.) is done, which gives the optimum unit availability levels for different combinations of failure and repair rates of the subsystems of screening unit for enhancing the overall performance of the paper plant. So, the findings of the present paper will be highly useful to the plant management in futuristic maintenance planning and control.
3. PROBLEM FORMULATION
The screening unit consists of four subsystems in series and parallel configuration with the following description:
Subsystem A : It consists of a Medium Consistency (M.C.) Pump unit used to flow the pulp from washer with consistency 4 -5% with fresh water. Its failure can cause a sudden and complete failure of the system.
Subsystem B : It consists of a Screen unit used for removing the knots and other undesirable foreign materials from the pulp. Its failure can cause a sudden and complete failure of system. Subsystem CI : It consists of three Cleaner units connected in parallel to mix the water with
pulp by centrifugal action .Failure of anyone cleaner results in poor quality of paper. Complete failure of this system reduces the efficiency of plant but system remains operative.
Subsystem D : It consists of a Decker unit used to reduce the blackness of the pulp if any by controlling the water contents . Its failure causes complete failure of the system.
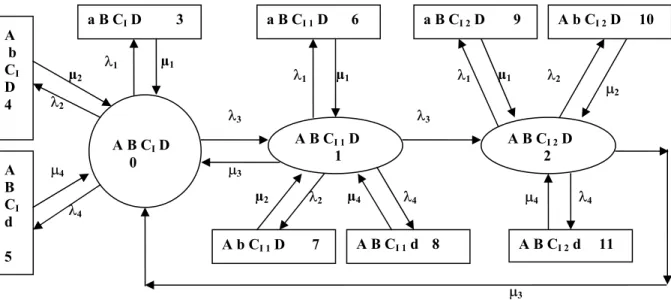
The transition diagram (figure-2) of screening unit shows the three states i.e. full working state, reduced working and failed state. Based on the transition diagram, a performance-evaluating model has been developed. The following assumptions and notations are addressed in developing the probabilistic models for screening unit of the paper plant concerned:
3.1. Assumptions
i. Failure/repair rates are constant over time and statistically independent. ii. A repaired unit is as good as new, performance wise for a specified duration. iii. Sufficient repair facilities are provided, i.e. No waiting time to start the repairs.
iv. Standby units (if any) are of the same nature and capacity as the active units. v. System failure /repair follow exponential distribution.
vi. Service includes repair and /or replacement.
vii. System may work at a reduced capacity / efficiency.
viii. There are no simultaneous failures among system. However, simultaneous failure may occur among various subsystems in a system/unit.
Figure 2 3.2. Notations
A,B,CI, D Represent good working states of M C pump, screen, cleaner and decker. a,b,cI,d Represent failed states of respective M C pump, screen, cleaner and decker.
Ȝ1,Ȝ2,Ȝ3Ȝ4 Respective mean constant failure rates of A,B,CI, D µ1, µ2,µ3, µ4 Respective mean constant repair rates of a,b,cI.d Pic(t) Derivative of probability function Pi(t).
Pi(t) Represents probability function that the unit is in a particular state at time ’t’. Indicates the unit in operating state.
Indicates the unit in failed state.
A b CI D 4
A B CI D 0 A
B CI d 5
a B CI D 3
A B CI 1 D 1
a B CI 1D 6 a B CI 2D 9
A b CI 1 D 7 A B CI 1d 8
A B CI 2 D 2
A b CI 2D 10
A B CI 2d 11 P4
O1 O1
O2
P4 P3
P3 O1
P2 O2
O4 O4
O2 O4
O3 O3
μ1
μ1 μ1
μ2 μ4
Indicates the unit in reduced capacity state. 3.3. Performance Modeling
The performance modeling is carried out using simple probabilistic considerations and differential equations associated with the transition diagram (figure-2) are developed on the basis of Markov birth-death process. These equations are further solved for determining the steady state availability of the screening unit. Various probability considerations give the following differential equations associated with the screening unit:
P0c(t)+
¦
41 i
i
O
P0(t)=¦
21 i
i
P
Pi+2(t)+µ3 P1(t)+ µ4 P5(t)+ µ3 P2(t) (1)P1c(t)+
¦
41 i
i
O
P1(t) +µ3P1(t) =¦
21 i
i
P
Pi+5(t)+µ4 P8(t)+Ȝ3 P0(t) (2)P2c(t)+
¦
21 i
i
O
P2(t) +Ȝ4 P2(t) +µ3P2(t)=¦
21 i
i
P
Pi+8(t)+ µ4 P11(t)+Ȝ3P1(t) (3)Pic(t)+µ1Pi(t)=Ȝ1Pj(t) where i=3,6,9 j = 0,1,2 (4) Pic(t)+µ2Pi(t)=Ȝ2Pj(t) where i=4,7,10 j = 0,1,2 (5) Pic(t)+µ4Pi(t)=Ȝ4Pj(t) where i=5,8,11 j = 0,1,2 (6) With initial conditions at time t = 0
Pi (t) = 1 for i = 0 = 0 for i 0
Since the paper plant is a process industry, its every unit should be available for long period. Therefore, steady state behavior of the system is analyzed by substituting d/dtĺ0
astĺ for equations (1)-(6) and solving them recursively.
P1=BP0 P2=B3BP0 P3=B1P0 P4=B2P0 P5=B4P0 P6=B1BP0 P7=B2BP0 P8=B4BP0 P9= B1B3BP0 P10= B2B3BP0 P11= B4B3BP0
Where Bi = Ȝi/µi i= 1,2,3,4 and B= Ȝ3/(Ȝ3+µ3) Using normalizing condition i.e. sum of all the state probabilities is equal to one [
¦
11
0 i
Pi=1], we get:
P0+BP0+B3BP0+B1P0+B2P0+B4P0+B1BP0+B2BP0+B4BP0+B1B3BP0+B2B3BP0+B4B3BP0=1 P0[1+B+B3B+B1+B2+B4+B1B +B2B+B4B+B1B3B+B2B3B+B4B3B] =1
P0= 1/ [1+B+B3B+B1+B2+B4+B1B +B2B+B4B+B1B3B+B2B3B+B4B3B] P0= 1/ [(1+B1+B2+B4)(1+B +B3B)]
The steady state availability (Av.) of this screening unit is given by summation of all the full working and reduced capacity states.
Av. = P0+P1+P2
Av. = [1+B+B3B] / [(1+B1+B2+B4)(1+B +B3B)]
Availability (Av.) = 1/ [1+B1+B2+B4] (7)
Here, the unit performance has been evaluated in terms of availability. 4. PERFORMANCE ANALYSIS
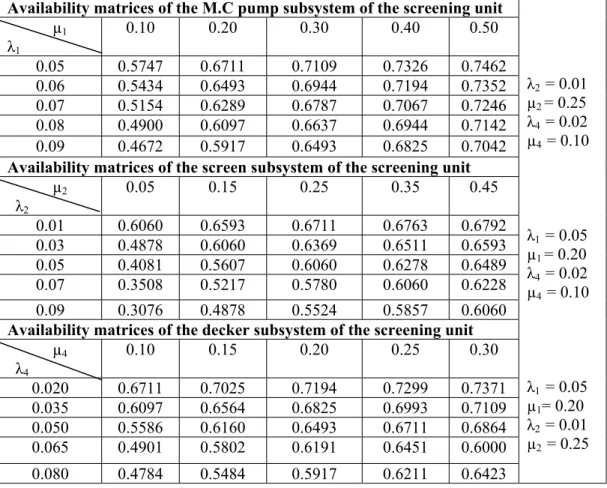
From maintenance history sheet of screening unit of paper plant and detailed discussions with the plant personnel, appropriate failure and repair rates of all the subsystems are selected. Then availability matrices (performance values) are prepared accordingly by putting these failures and repair rates values in the expression of availability. This deals with the quantitative analysis of all
Table 1 Availability matrices of the subsystems the screening unit Availability matrices of the M.C pump subsystem of the screening unit µ1
Ȝ1
0.10 0.20 0.30 0.40 0.50
0.05 0.5747 0.6711 0.7109 0.7326 0.7462
0.06 0.5434 0.6493 0.6944 0.7194 0.7352
0.07 0.5154 0.6289 0.6787 0.7067 0.7246
0.08 0.4900 0.6097 0.6637 0.6944 0.7142
0.09 0.4672 0.5917 0.6493 0.6825 0.7042
Availability matrices of the screen subsystem of the screening unit µ2
Ȝ2
0.05 0.15 0.25 0.35 0.45
0.01 0.6060 0.6593 0.6711 0.6763 0.6792
0.03 0.4878 0.6060 0.6369 0.6511 0.6593
0.05 0.4081 0.5607 0.6060 0.6278 0.6489
0.07 0.3508 0.5217 0.5780 0.6060 0.6228
0.09 0.3076 0.4878 0.5524 0.5857 0.6060
Availability matrices of the decker subsystem of the screening unit µ4
Ȝ4
0.10 0.15 0.20 0.25 0.30
0.020 0.6711 0.7025 0.7194 0.7299 0.7371
0.035 0.6097 0.6564 0.6825 0.6993 0.7109
0.050 0.5586 0.6160 0.6493 0.6711 0.6864
0.065 0.4901 0.5802 0.6191 0.6451 0.6000
0.080 0.4784 0.5484 0.5917 0.6211 0.6423
Ȝ2 = 0.01 µ2= 0.25
Ȝ4 = 0.02 µ4= 0.10
Ȝ1 = 0.05 µ1= 0.20
Ȝ4 = 0.02 µ4= 0.10
Ȝ1 = 0.05 µ1= 0.20
Ȝ2 = 0.01 µ2= 0.25
the factors viz. courses of action and states of nature, which influence the maintenance decisions associated with the screening unit. These availability models are developed under the real decision making environment i.e. decision making under risk (probabilistic model) and used to implement the proper maintenance decisions for the screening unit of paper plant.
Table1 represents the availability matrices for various subsystems of the screening unit. These matrices simply reveal the various performance levels for different combinations of failure and repair rates. It also depicts the effect of failure and repair parameters of all the subsystems on screening unit performance. The performance of screening unit may be further analyzed and optimized by using Genetic Algorithms Technique.
5. PERFORMANCE OPTIMIZED USING GENETIC ALGORITHM
Genetic Algorithms are computerized search and optimization algorithms based on the mechanics of natural genetics and natural selection. Genetic Algorithms have become important because they are found to be potential search and optimization techniques for complex engineering optimization problems. The performance analysis of the screening unit is highly influenced by the failure and repair parameters of each subsystem. These parameters ensure high performance of the screening unit. Genetic Algorithm is hereby proposed to coordinate the failure and repair parameters of each subsystem for stable unit performance i.e. high availability. Here, number of parameters is six (three failure parameters and three repair parameters). The design procedure is described as follows: To use Genetic Algorithm for solving the given problem, the chromosomes are to be coded in real structures. Unlike, unsigned fixed point integer coding parameters are mapped to a specified interval [Xmin , Xmax], where Xmin and Xmax are the maximum and minimum values of system parameters . The maximum value of the availability function corresponds to optimum values of system parameters. These parameters are optimized according to the performance index i.e. desired availability level. To test the proposed method, failure and repair rates are determined simultaneously for optimal value of unit availability. Effect of number of generations and crossover probability on the availability of the screening unit is shown in Tables 2 and 3. To specify the computed simulation more precisely, trial sets are also chosen for Genetic Algorithm and system parameters. The performance [availability] of the screening unit is evaluated by using the designed values of the unit parameters.
Failure and repair rate parameter constraints are (Ȝ1, µ1,Ȝ2, µ2,Ȝ4, µ4)
Parameters Ȝ1 µ1 Ȝ2 µ2 Ȝ4 µ4
Minimum 0.05 0.10 0.01 0.05 0.02 0.10
Maximum 0.09 0.50 0.09 0.45 0.08 0.30
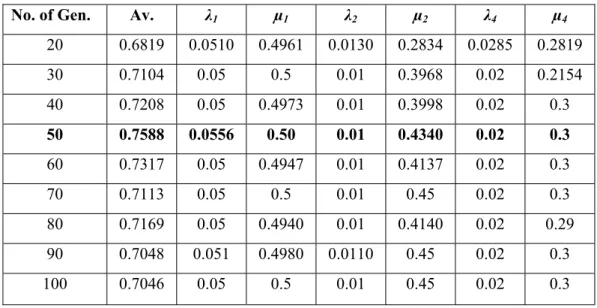
Here, real-coded structures are used. The simulation is done to maximum number of generations, which is varying from 20 to 100. The effect of number of generations on availability of the screening unit is shown in Figure 3. The optimum value of unit’s performance is 75.88%, for which the best possible combination of failure and repair rates is Ȝ1 =0.0556, µ1 =0.50, Ȝ2 =0.01 µ2 =0.4340, Ȝ4 =0.02, µ4=0.3 at number of generations 50, as shown in Table 2.
0.67 0.68 0.69 0.7 0.71 0.72 0.73 0.74 0.75 0.76
0 20 40 60 80 100 120
Ge ne rations Size
A
v
a
ila
b
ilit
y
Availability Vs Number of Generations
Figure 3 Effect of Number of Generation on Fitness (Screening Unit Availability)
Again, the simulation is done for maximum number of crossover probability, which is varying from 0.20 to 0.90. Crossover and mutation function performed through their selection with stochastic universal sampling. This function also performed through the double point crossover. The effect of crossover probability on availability of the screening unit is shown in Figure 4.The optimum value of system’s performance is 76.31%, for which the best possible combination of failure and repair is
Ȝ1 = 0.05, µ1=0.50, Ȝ2 = 0.01, µ2= 0.4412, Ȝ4 = 0.02, µ4= 0.2712 at crossover probability 0.50 as given in Table 3.
0.64 0.66 0.68 0.7 0.72 0.74 0.76 0.78
0 0.1 0.2 0.3 0.4 0.5 0.6 0.7 0.8 0.9 1
Crossove r Probability
A
v
a
ila
b
ilit
y
Availability Vs Crossover Probability
Table 2 Effect of number of generations on availability of the screening unit using genetic algorithm. (Mutation Probability = 0.015, Population Size = 40, Crossover Probability = 0.85)
Table 3 Effect of crossover probability on availability of the screening unit using genetic algorithm. (Mutation Probability = 0.015, Population Size = 40, No. of Generations = 40)
6. CONCLUSIONS
The performance analysis of the screening unit of a paper plant has been carried out in this paper. Further, performance of the screening unit has also been optimized using G.A.T. Genetic Algorithm Technique (G.A.T.) is hereby proposed to select the best feasible values of the unit failure and repair parameters along with unit availability levels. Finally, this technique is successfully applied to coordinate simultaneously these parameters for determining an optimum level of unit availability. Besides, the effect of Genetic Algorithm parameters such as number of generations and crossover probability on the unit performance i.e. availability has also been analyzed. By varying the above mentioned parameters of Genetic Algorithm the optimum unit availability achieved is about 76% with best possible combinations of the failure and repair rates of all the subsystems of the screening
No. of Gen. Av. Ȝ1 µ1 Ȝ2 µ2 Ȝ4 µ4
20 0.6819 0.0510 0.4961 0.0130 0.2834 0.0285 0.2819
30 0.7104 0.05 0.5 0.01 0.3968 0.02 0.2154
40 0.7208 0.05 0.4973 0.01 0.3998 0.02 0.3
50 0.7588 0.0556 0.50 0.01 0.4340 0.02 0.3
60 0.7317 0.05 0.4947 0.01 0.4137 0.02 0.3
70 0.7113 0.05 0.5 0.01 0.45 0.02 0.3
80 0.7169 0.05 0.4940 0.01 0.4140 0.02 0.29
90 0.7048 0.051 0.4980 0.0110 0.45 0.02 0.3
100 0.7046 0.05 0.5 0.01 0.45 0.02 0.3
Crossover Probability Av. Ȝ1 µ1 Ȝ2 µ2 Ȝ4 µ4 0.20 0.6550 0.0525 0.4137 0.0117 0.4276 0.0224 0.2970 0.30 0.7007 0.0583 0.4871 0.0110 0.4403 0.0306 0.2563 0.40 0.6982 0.0504 0.3848 0.0104 0.3422 0.0249 0.2693
0.50 0.7631 0.05 0.5 0.01 0.4412 0.02 0.2712
0.60 0.7154 0.0513 0.5 0.01 0.45 0.0201 0.3
0.70 0.7238 0.05 0.5 0.01 0.45 0.02 0.2764
0.80 0.6953 0.05 0.5 0.01 0.45 0.0258 0.2781
unit. Whereas, the best possible availability level obtained with the help of Markov birth-death process was about 74%. Then, the findings of this paper have been discussed with the concerned plant management. Such results might be highly beneficial for the purpose of performance optimization of the screening unit in the paper plant concerned.
REFERENCES
[1] Castro H.F., Cavalca K. (2003), Availability optimization with Genetic Algorithm; International Journal of Quality and Reliability Management 20(7); 847-863.
[2] Chales C., Kondo A. (2003), Availability allocation to repairable systems with Genetic Algorithms: a multi-objective formulation; Reliability Engineering and System Safety 82(3); 319-330.
[3] Dhillon B.S., Singh C. (1981), Engineering Reliability - New Techniques and Applications; John Willey and Sons; New York.
[4] Goldberg D.E. (2001), Genetic Algorithm in Search; Optimization and Machine Learning, Pearson Edition; Asia.
[5] Gupta P., Lal A., Sharma R., Singh J. (2005), Numerical analysis of reliability and availability of the series processes in butter oil processing plant; International Journal of Quality and Reliability Management 22(3); 303-316.
[6] Gupta S., Kumar A., Sharma R., Tewari P.C. (2008), A performance modeling and decision support system for a feed water unit of a Thermal Power Plant; South African Journal of Industrial Engineering 19(2); 125-134.
[7] Juang Ying-Shen, Lin Shui-Shun, Kao Hsing-Pei (2008), A knowledge management system for series-parallel availability optimization and design; Journal of Expert System with Application 34; 181-193. [8] Kalyanmoy Deb (1995), Optimization for Engineering Design: Algorithms and examples; Prentice Hall
of India, New Delhi; India.
[9] Khanduja Rajiv, Tewari P. C., Dinesh Kumar (2008), Availability analysis of bleaching system of paper plant; Journal of Industrial Engineering, Udyog Pragati, N.I.T.I.E. Mumbai (India) 32(1); 24-29.
[10] Khanduja Rajiv, Tewari P.C., Dinesh Kumar (2008), Development of performance evaluation system for screening unit of paper plant; International Journal of Applied Engineering Research 3(3); 451-460.
[11] Kumar D., Singh I.P., Singh J. (1988), Reliability analysis of the feeding system in the paper industry; Microelectronics Reliability 28(2);.213-215.
[12] Kumar D., Singh J., Pandey P.C. (1989), Availability analysis of the washing system in the paper industry; Microelectronics Reliability 29;.775-778.
[13] Kumar D., Singh J., Pandey P.C. (1993), Operational behavior and profit function for a bleaching and screening system in the paper industry; Microelectronics Reliability 33; 1101-1105.
[14] Shooman M.L. (1996), Reliability computation for systems with dependents failures; IEEE Annual Symposium on Reliability; 44-56.
[16] Sunand Kumar, Dinesh Kumar, Mehta N.P. (1999), Maintenance management for ammonia synthesis system in a urea fertilizer plant; International Journal of Management and System (IJOMAS) 15(3); 211-214.
[17] Sunand Kumar, Tewari P. C., Sharma Rajiv (2007), Simulated availability of CO2 cooling system in a fertilizer plant; Industrial Engineering Journal (Indian Institution of Industrial Engineering, Mumbai) 36(10); 19-23.
[18] Tewari P.C., Kumar D., Mehta N.P. (2003), Decision support system of refining system of sugar plant; Journal of Institution of Engineers (India) 84; 41-44.
[19] Tewari P.C., Joshi D., Sreenivasa Rao M. (2005), Mathematical modeling and behavioral analysis of a refining system using Genetic Algorithm; Proceedings of National Conference on Competitive Manufacturing Technology & Management for Global Marketing, Chennai; 131-134.
[20] Wang Shuming, Watada Junzo (2009), Reliability optimization of a series-parallel system with fuzzy random lifetimes; International Journal of Innovative Computing, Information and Control 5(6); 1547-1558.