Abstract
During development, disruptions in sonic hedgehog (SHH) signaling can lead to
medulloblastoma, the most common malignant pediatric brain tumor. Medulloblastoma
tumor cells arise from cerebellar granule neural progenitors (CGNPs), which rely on
SHH signaling to proliferate. Inhibiting the SHH pathway is a focus of research in
treatment of medulloblastoma. It is known that SHH is closely linked with the cell cycle,
but it was not known how SHH pathway inhibition affects gene expression in CGNPs.
To simulate SHH-deprivation, we performed microarray analysis using RNA from
wild-type progenitor cells cultured in the presence or absence of SHH. We found that in
absence of SHH, there is significant suppression of genes in all phases of the cell cycle,
confirming that CGNPs depend on SHH to proliferate. To investigate the effects of
indirect SHH inhibition on gene expression, we used vismodegib, an FDA-approved
inhibitor of the SHH ligand receptor SMOOTHENED (SMO). Wild-type mice were
injected with either vismodegib or a vehicle control and we collected RNA from CGNPs.
We performed RNA-sequencing analysis to compare expression levels of cell cycle
markers, differentiation markers, and SHH markers. Our preliminary data suggests that
vismodegib promotes differentiation and suppresses proliferation. We will use
differential gene expression analysis to identify genes of interest and validate our
findings through immunohistochemistry. These biological markers could be used to
further medulloblastoma treatment research and, more specifically, to help identify cells
Introduction
Sonic Hedgehog (SHH) Signaling Pathway
Disrupted SHH signaling is the cause of many types of cancers including basal
cell carcinoma and medulloblastoma, a tumor which arises from cerebellar granule
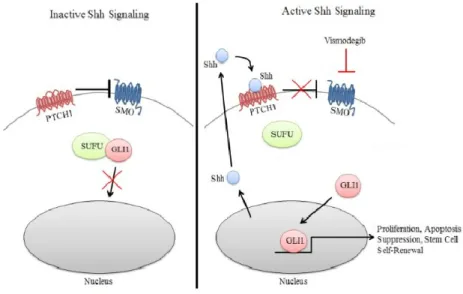
neuron progenitors (CGNPs). Activated SHH signaling induces cellular proliferation and
is the main signaling pathway driving cerebellar development (Rimkus et al, 2016). SHH
ligand binds to the Patched (PTCH1) transmembrane protein, which normally inhibits
the Smoothened (SMO) transmembrane protein. Once bound, SHH inactivates PTCH1,
allowing SMO to activate the nuclear localization of GLI transcription factors and induce
cellular proliferation (Lewis et al, 2004). In the case of medulloblastoma, over-activation
of this pathway causes excessive proliferation of progenitors that leads to cancer.
Figure 1. Visual representation of the SHH Pathway (adapted from Rimkus 2016).
CGNPs normally proliferate along the outer layer of the cerebellum, the external
granule layer (EGL). CGNPs proliferate in response to SHH signaling from neighboring
differentiating into mature granule cells. Maturing CGNPs migrate to the internal granule
layer (IGL) where they become CGNs (Lewis et al, 2004). The cerebellar granule
neurons (CGNs) are the most abundant cells in the cerebellumand account for over
50% of all neurons in the brain (Lee et al, 2009). Disruption of SHH signaling in CGNPs
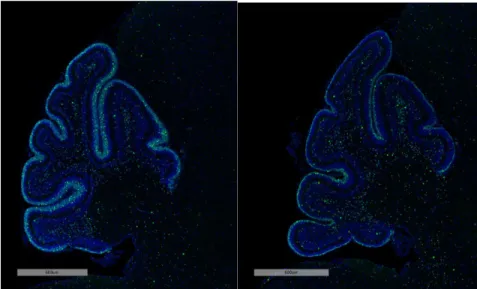
accelerates cell cycle exit and differentiation into mature granule cells. For example,
treatment with the SHH inhibitor, vismodegib, decreases phosphorylated Rb staining, a
marker for cell cycle progression (Figure 2).
Figure 2. Cerebellar tissue from mice treated with vehicle control (left) and with the SHH
inhibitor, vismodegib (right) stained with fluorescent probes specific to p-Rb+ proliferating
progenitors (Katherine Tech, unpublished data).
Vismodegib is an inhibitor of the SMO receptor, which prevents the nuclear
localization of GLI transcription factors and accelerates differentiation of CGNPs.
Vismodegib is FDA-approved treatment for basal cell carcinoma (Aditya et al, 2013). It
has also been used in treatment for medulloblastoma, however, there is a high chance
of recurrence in these patients. Identifying the source of recurrence is an important goal
of research using vismodegib. In a previous study by the lab, vismodegib was injected
into mice genetically engineered to develop medulloblastoma. Vismodegib treatment
decreased the proliferating, PCNA+ fraction of tumor cells and increased differentiating
p27+ fraction. Vismodegib was also able to dramatically reduce tumor size. (Figure 3).
Figure 3. Mice with tumors injected with A) vehicle control or B) vismodegib. B) Vismodegib
treated tumors show decreased PCNA+ cells, increased p27+ cells, and reduced tumor size as
compared to control tumors. (Katherine Tech, unpublished data)
The precise molecular mechanisms of the SHH signaling effect on the cell cycle
are not well understood (Kenney et al, 2000). Although we know that vismodegib is able
to inhibit proliferation by inhibiting the SHH pathway, we do not know all of the
molecular targets of SHH pathway inhibition. My project explores and compares how
transcription is affected by SHH deprivation in vitro in cultured cells through microarray
analysis and by SHH inhibition in vivo in vismodegib-treated mice through RNA-Seq
analysis.
Materials and Methods SHH-Deprived Cell Culture
From a previous unpublished study by Katherine Tech, who was a graduate
student in the lab, cerebellar tissue was obtained from C57BL/6 mice and the following
procedure was performed. These tissues were cultured in media that contained 0.5 mg/
mL SHH (#464SH, R&D Systems) or vehicle (0.1% BSA in 1PBS). After 24 hours, RNA
was extracted from these samples following the RNeasy MiniKit protocol and sent for
microarray analysis. We used computational tools available on Partek, R and Excel to
analyze the differential gene expression and perform Gene Set Analysis on Tech’s data.
The results will be compared to results from a vismodegib-injected mouse sample.
Vismodegib-injected Mouse Cerebellar Tissue RNA Collection
We divided two groups of C57BL/6 mice into male-female pairs in order to tease
out any possible effects of sex. Each member of the pair was injected with either 100
mg/kg vismodegib (#S1082, Selleck Chemicals) or vehicle (polyethylene glycol and
NMP mixture) at postnatal day 5 (P5). After 24 hours, cerebellar tissue was collected
from the mice. The cerebellar tissue was cleared of meninges, choroid plexus,
non-cerebellar tissue, and blood vessels and then split in half in order to use half for
RNA-Seq. The samples were immediately flash-frozen and then placed in -80ºC freezer in
order to preserve and protect the mRNA from degradation by RNAse. RNA was later
isolated and purified using the RNeasy MiniKit manufacturer’s protocol.
After quality control, RNA from the samples were converted into a cDNA library.
Sequence adaptors were added, and the 50bp paired-end reading was then aligned
with a reference transcriptome to generate a “base-resolution gene expression profile
and R to analyze the RNA-seq data and find differential gene expression patterns in
vismodegib-treated cerebella as compared to control.
Validation Studies
In order to validate our findings from the collected RNA, we collected replicate
vehicle- (polyethylene glycol and NMP mixture) and 100 mg/kg vismodegib-treated
(#S1082, Selleck Chemicals) cerebellar samples from P7 mice and fixed for 48 hours in
4% paraformaldehyde. The tissue was dehydrated and embedded in paraffin with
assistance from the Center for Gastrointestinal Biology and Disease (CGIBD) Histology
core. The samples were stained for PCNA/p27 and pRb as markers of proliferation and
CDKN1A (p21) as a marker of cell cycle cessation.Samples were stained with the
assistance of the Translational Pathology Laboratories (TPL).
Results
SHH-Deprivation in Cell Culture Causes Downregulation of Cell Cycle Genes In order to understand how SHH influences gene expression, we used
microarray analysis to look at transcript abundance in RNA collected from cultured
CGNPs. We used computational tools available on Partek and R to find differentially
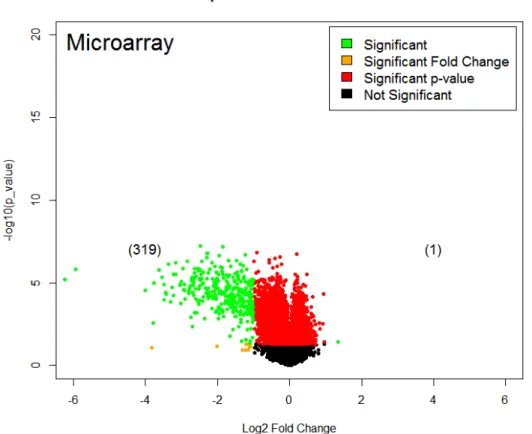
expressed genes induced or repressed by 24 hours of SHH-deprivation. There were
over 20,000 gene read outs, which were then parsed through for length >500 base-pairs
and p-value with corrected False Discovery Rate (FDR) <0.05. All genes are displayed
with their log2(fold change) values on the x-axis and –log10(p-values) on the y-axis in
upregulated gene. However, SHH deprivation significantly decreased gene expression
of about 500 genes (log2(fold change) < -1, adjusted p-value <0.05), including Aspm
(mitotic spindle regulation; associated with microcephaly), E2f1 (cell cycle transcription
factor), and Gli3 (SHH transcription factor).
Figure 4. Volcano plot displaying the log2(fold change) values of SHH-deprived vs SHH-cultured
cells with the log10(p-values) of individual genes. Significant genes (in green) were considered to
have a fold change <-1 or >1 with a p-value adjusted for FDR <0.05.
Vismodegib Causes Some Downregulation and Some Upregulation of Genes
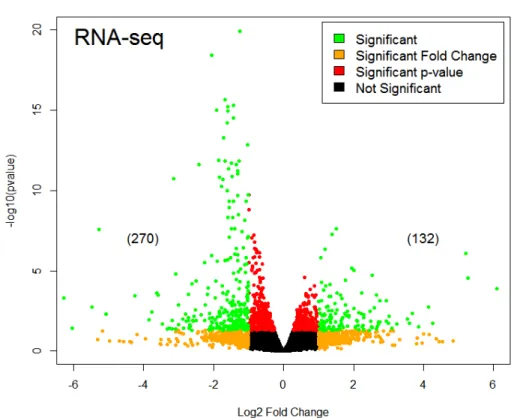
To determine the effect of pharmacological inhibition of the SHH pathway on
CGNPs, we injected P6 wild-type mice with 100mg/kg vismodegib or vehicle control and
processed for RNA-sequencing analysis. We analyzed the RNA-seq data using the
DESeq2 package in R.Our RNA-Seq analysis of the transcript abundance in RNA
collected from Vismodegib-treated cerebella revealed both upregulation and
downregulation of genes, as shown by Figure 5 (log2(fold change) > |-1| or 1, adjusted
p-value < 0.05). Downregulated genes included Mki67 (proliferation marker), Kif11
(mitotic spindle dynamics), and Atoh1 (SHH transcription factor). Upregulated genes
included Plp1 (component of myelin; axon survival), Cabp1 (calcium binding; calcium
channels), and Pcdhgc4 (calcium-depended cell-adhesion; neuronal connections).
Figure 5. Volcano plot displaying the log2(fold change) values of Vismodegib vs. Vehicle cells
with the log10(p-values) of individual genes. Significant genes (in green) were considered to
Gene Set Analysis
We used Gene Set Analysis (GSA) to determine what molecular pathways were
affected by SHH deprivation in our microarray data. GSA uses differentially expressed
genes (p-value <0.05) without a cutoff for fold change. “Eguchi Cell Cycle RB1 Targets”
and “Scian Cell Cycle Targets of TP53 and TP73” were among the pathways most
affected by SHH deprivation according to their V1 scores (Table 1), indicating that SHH
deprivation markedly decreased expression of genes related to cell cycle.
Set Name V1 Score V1 p-value V1 FDR Downregulated Genes
Cell Cycle
EGUCHI CELL CYCLE RB1 TARGETS -3.5407 0 0
CDC25C BUB1 MCM7 MCM3 FEN1 CCNE2
SCIAN CELL CYCLE TARGETS OF TP53 AND
TP73 DN -3.2717 0 0
CCNB1 CDC25C MCM7 RAN KIF22 CDKN3 KIF23 Apoptosis
WU APOPTOSIS BY CDKN1A VIA TP53 -2.5309 0 0
NPM1 MCM3 ASPM RACGAP1 MCM7 BUB1 PARP2 CCNB1 CDK1 Table 1. GSA Results with V1 Scores, p-values and FDR values.
However, the SHH pathway is known to regulate cell cycle progression (Lewis et
al, 2004). In order to explore other pathways that were affected by SHH deprivation, we
combined the cell cycle markers published from Macosko et al. 2015, with other known
cell cycle markers and removed these genes from the analysis. Exclusion of these
genes revealed an upregulation of pathways associated with differentiation of neurons,
or cell cycle exit.
Set Name V1 Score V1 p-value V1 FDR Upregulated Genes
KCNK2 KCNB1
BIOCARTA CACAM PATHWAY +1.561 0 0 CAMKK1/2, CAMK1/4/2A
Table 2. GSA Results from data without cell cycle genes with V1 Scores, p-values and FDR
values
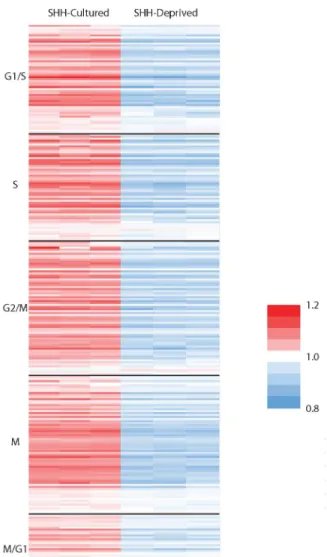
Downregulation of the Cell Cycle
To further explore the role of cell cycle regulation in SHH deprivation, we used
the cell cycle gene list from Macosko et al. 2015, which defined the phases G1/S, S,
G2/M, M and M/G1. For both data sets, the values of expression for each gene in all
samples were averaged, and the individual values were then divided by the average to
show relative upregulation or downregulation for each sample. A heat map was
produced for each data set. Overall, genes were downregulated in the SHH-deprived as
compared to the control group across all phases of the cell cycle, as shown in Figure 6
and Figure 7 in the Appendix.
Comparison of RNA-Seq and Microarray Data
In order to look at differences between the methodologies as well as between the
experiments, we compared the fold changes of significant genes from the RNA-Seq
analysis with those from the microarray data. Aurka and Aurkb are cell-cycle regulated
kinases that play a role in regulating mitosis, and both genes are significantly
downregulated in both data sets, as shown in Table 3. Ccnb2, Cep55, Mki67, Pif1,
Smc2, and Tpx2 are all genes associated with the cell cycle that were also significantly
downregulated in both data sets (Table 3). However, there were several genes that
microarray data, such as Ambra1, Lcr6 and Ecel1. Still others were detected in
RNA-Seq analysis but not detected in microarray.
Validation Studies
In order to validate the findings from the microarray and RNA-Seq data, we had
P6 cerebellar tissue from vismodegib-injected and vehicle-injected mice stained with
PCNA and p27 (Figure 8). Proliferating cell nuclear antigen (PCNA) is a protein present
in proliferating cells, while p27 (encoded by the CDKN1B gene) is an inhibitor of the cell
cycle and labels differentiating neurons. From visual examination, we found slight
decreases in PCNA and a corresponding increase in p27 staining.
Figure 8. PCNA/p27 stained cerebellar tissue from vehicle-injected and vismodegib-injected P6
mice.
We also stained samples for p-Rb, a phosphorylated form of the retinoblastoma
protein product coded by the RB1 gene. In its active, dephosphorylated form, Rb acts
as a repressor of the cell cycle. Vismodegib-treated cerebella showed significant
Figure 9. pRB stained progenitor cells in cerebellar tissue from vehicle-injected (top) and
vismodegib-injected (bottom) P6 mice.
Discussion
Cell Cycle and Differentiation Marker Analysis
Previous studies have shown that SHH is required to maintain the cell cycle and
CGNP proliferation (Kenney et al, 2000). Disruption of whether by means of
SHH-deprivation in vitro or SHH pathway inhibition through vismodegib in vivo- should
therefore reduce proliferation. The specific genes associated with the disruption of SHH
signaling and the differences between the two methodologies tell an interesting story.
In our cell culture study, all of the marker genes for all phases of the cell cycle
were downregulated in the absence of SHH, indicating that fewer CGNPs were
progressing through the cell cycle (Figure 5). We believe that the cells moving through
the G1/S phase either had to finish cycling through the rest of the cell cycle before
exiting and differentiating, or would be subject to apoptosis because the S, G2 and M
phases all contain 4N levels of DNA, and these cells would likely not survive. However,
it is not possible with our data to determine where exactly in the cycle the cells are –
only that they are no longer cycling through each phase. We also did not detect a
specific phase that was more affected by the deprivation than the others.
Supporting the hypothesis that cells exit the cell cycle to differentiation as
opposed to undergoing apoptosis is the observed downregulation of the “Wu Apoptosis
by CDKN1A via TP53 pathway” and similar apoptosis-related pathways in the absence
of SHH. This is further supported by an upregulation of several molecular pathways
associated with differentiation (Table 2). The “Lein Neuronal Markers” and “Le Neuronal
Differentiation Up” pathways both include genes associated with neuronal differentiation
and cell cycle exit such as GABBR2/1, GABA-B receptors that regulate neuronal
activity. CAM2KA is a Ca2+/Calmodulin-dependent protein kinase that regulates
calcium signaling at glutamatergic neuronal synapses. KCNAB1 is a Potassium channel
regulatory protein that regulate neurotransmitter release and neuronal excitability (Gene
– NCBI). The “Biocarta CaCam Pathway” contains mostly Ca2+/Calmodulin-dependent
kinases, including the CAMKK2 gene which codes for a kinase that is expressed mostly
in the brain and is involved with neuronal differentiation and synapse formation (Gene -
NCBI). The upregulation of differentiation pathways indicates that vismodegib actively
promotes differentiation, and gives us insight into particular markers that are affected by
SHH deprivation beyond the control of the cell cycle. A caveat to the GSA is that the
individual genes within these pathways have fold changes that we did not consider
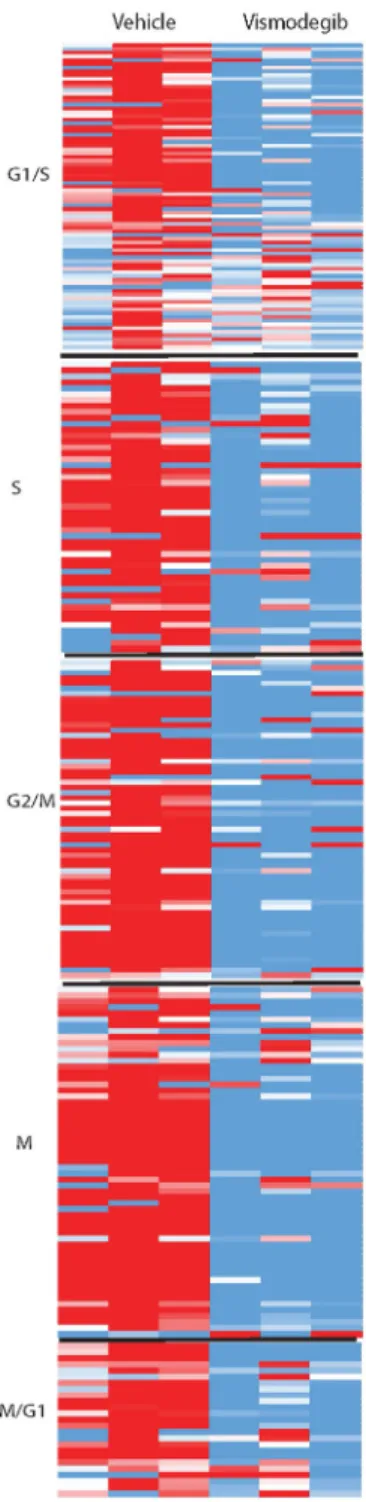
In the RNA-Seq data, there was a similar overall trend towards downregulation
across all phases of the cell cycle in the vismodegib-treated samples, as shown in
Figure 7 in the Appendix. However, this downregulation was less uniform than in the
SHH-deprived cells. There were several genes that were upregulated in all samples of
vismodegib, namely those associated with cell cycle cessation such as CDKN1A (p21).
FLAD1 (an enzyme), RAB23 (a GTPase that antagonizes SHH signaling), and SNHG10
(an RNA host gene and non-protein coding RNA) are also upregulated within the G1/S
phase in the vismodegib sample (Gene - NCBI). However, many of the cell cycle
markers according to Macosko that were upregulated were not significant.
Overall, the data indicate that both deprivation and inhibition of SHH yield a
cellular shift away from proliferation and towards neuronal differentiation. While we were
unable to determine a specific cell cycle phase that was preferentially altered by either
treatment, we were able to look more deeply at specific markers of interest.
For example, Retinoblastoma (Rb1) is a key regulator between G1 and S in the
cell cycle (Dyson et al, 2016). The downregulation of “Eguchi Cell Cycle Rb1 Targets”
from the microarray GSA and the lack of phosphorylated Rb1 in the vismodegib-injected
sample as shown in Figure 9 supports that there is less proliferation in the absence of
SHH signaling. The differential regulation of these genes and associated pathways give
us potential targets for further investigation within the cell cycle.
Comparing the RNA-Seq and Microarray Data
The main advantages of RNA-Seq as opposed to microarray analysis include
increased sensitivity, unbiased detection by using probes that are not transcript-specific,
These differences are reflected in Table 3 in the Appendix. However, differences in the
data are not likely due to differences in the type of analysis used.
Differences between the microarray data and the RNA-Seq data could be due to
differences in the experimental designs. The microarray data was in vitro, while the
RNA-Seq data was in vivo. Furthermore, the tissue cultured for the microarray analysis
consisted of CGNP cells while the tissue for the RNA-Seq analysis was a whole
cerebellum from each sample.
Future Directions
While we performed our analyses at 24 hours after vismodegib injection, it may
be helpful to look at shorter time periods after injection to better determine if it is
preferential within the cell cycle. The length of the mammalian cell cycle is
approximately 24 hours (Cooper GM) and we might be missing key phase preference
information by waiting 24 hours before collection. To determine if vismodegib is
preferentially affecting a particular phase, we can also perform Fluorescence Activated
Cell Sorting (FACS). With FACS, we can identify cells in each either G1, S, G2 or M and
determine if the proportion of cells within each phase is changed with vismodegib.
We can also inject mice with a DNA analog called bromo-ethynyl-uridine (BrdU),
which is incorporated into dividing cells. By injecting BrdU alongside vismodegib, we
can track the fates of cells that were progressing through the cell cycle when
vismodegib was injected. We are also injecting tumor mice with vismodegib over a
period of several months in order to determine the long-term effect of SHH pathway
mechanism of action of vismodegib and give us new insights into how tumor cells and
progenitors respond to SHH pathway inhibition. These experiments may help us
understand how tumors recur even with prolonged treatment so we can design new
therapies.
References
Aditya, Suruchi. “Vismodegib: A smoothened inhibitor for the treatment of advanced
basal cell carcinoma.” Indian Dermatology Online Journal, vol. 4, no. 4, Oct.
2013. PubMed Central, doi:10.4103/2229-5178.120685.
Cooper GM. The Cell: A Molecular Approach. 2nd edition. Sunderland (MA): Sinauer
Associates; 2000. The Eukaryotic Cell Cycle. Available from:
https://www.ncbi.nlm.nih.gov/books/NBK9876/
Database, GeneCards Human Gene. “CDK1 Gene(Protein Coding).” GeneCards,
www.genecards.org/cgi-bin/carddisp.pl?gene=CDK1.
Dyson, Nicholas J. “RB1: a prototype tumor suppressor and an enigma.” Genes and
Development, vol. 30, 2016. Cold Spring Harbor Laboratory Press,
doi:10.1101/gad.282145.116.
"Gene - NCBI." National Center for Biotechnology Information. Accessed March
15, 2018. https://www.ncbi.nlm.nih.gov/gene.
Greenblatt, M S. “Mutations in the p53 Tumor Suppressor Gene: Clues to Cancer
Etiology and Molecular Pathogenesis.” Cancer Research, vol. 54, 15 Sept. 1994.
American Association for Cancer Research, doi:4855-4878.
Cell Cycle Progression in Mammalian Neuronal Precursors.” Sonic hedgehog
Promotes G1 Cyclin Expression and Sustained Cell Cycle Progression in
Mammalian Neuronal Precursors, 20 Dec. 2000. National Center for
Biotechnology Information, doi:9055–9067.
Lee, Hae Young et al. “Isolation and Culture of Post-Natal Mouse Cerebellar Granule
Neuron Progenitor Cells and Neurons.” Journal of Visualized Experiments :
JoVE 23 (2009): 990. PMC. Web. 16 Mar. 2018.
Lewis, Paula M. “Sonic hedgehog signaling is required for expansion of granule neuron
precursors and patterning of the mouse cerebellum.” Developmental Biology, vol.
270, no. 2, 15 June 2004. Science Direct, doi:10.1016/j.ydbio.2004.03.007.
Macosko, E. “Highly Parallel Genome-Wide Expression Profiling of Individual Cells
Using Nanoliter Droplets.” Cell, vol. 161, no. 5, 21 May 2015,
doi:10.1016/j.cell.2015.05.002.
“RB1 gene - Genetics Home Reference.” U.S. National Library of Medicine, National
Institutes of Health, Apr. 2009, ghr.nlm.nih.gov/gene/RB1#synonyms.
Rimkus, Tadas K. “Targeting the Sonic Hedgehog Signaling Pathway: Review of
Smoothened and GLI Inhibitors.” Cancers — Open Access Oncology Journal, 15
Feb. 2016, doi:10.3390/cancers8020022.
“TP53 gene - Genetics Home Reference.” U.S. National Library of Medicine, National
Institutes of Health, October 2015, ghr.nlm.nih.gov/gene/TP53.
Wang, Z. “RNA-Seq: a revolutionary tool for transcriptomics.” Nature Reviews Genetics,
vol. 10, no. 1, Jan. 2009. PubMed, doi:10.1038/nrg2484.
RNA-Seq and Microarray in Transcriptome Profiling of Activated T Cells. PLoS ONE,
9(1), e78644. http://doi.org/10.1371/journal.pone.0078644
Acknowledgements
All members of the Gershon Lab
Dr. Tim Gershon
Jennifer Ocasio
Biology 692H classmates
Vince Rapp
Figure 6. Relative gene expression of cell cycle markers in each phase of the cell cycle
normalized to the average for each gene for SHH-cultured and SHH-deprived CGNPs.
Figure 7. Relative gene expression of cell cycle markers in each phase of the cell cycle
normalized to the average for each gene for Vismodegib and Vehicle CGNPs. Upregulation with
logFC p-value
Gene Name RNA-Seq Microarray RNA-Seq Microarray
Smc2 -8.23 -0.92 1.33E-06 0.05
Pif1 -6.28 -0.99 4.29E-02 0.05
Zfp36l1 -5.28 -1.09 9.73E-06 0.05
Myod1 -3.14 0.88 1.22E-08 43.25
Mier3 -3.09 -0.80 2.59E-03 0.14
Gm15452 -2.63 - 9.05E-03
-4631405J19Rik -2.5 - 6.34E-03
-Tpx2 -2.42 -0.99 2.19E-09 0.05
Aurkb -2.27 -1.09 6.12E-04 0.05
Hist1h2bj -2.18 - 3.18E-02
-Nop56 -2.16 -1.28 1.53E-02 1.01
Hist1h2ag -2.05 - 2.57E-04
-Mki67 -2.05 -0.89 2.72E-15 0.05
Aurka -1.97 -0.97 4.33E-02 0.05
Cabp1 1.95 -0.63 1.28E-03 43.25
C130021I20Rik 2.01 -0.85 1.65E-03 12.78
Ambra1 2.23 -2.00 2.83E-02 42.10
B3glct 2.54 - 2.90E-03
-Lgr6 2.66 -0.49 3.45E-02 12.78
Ecel1 5.21 -0.94 2.11E-04 1.86
Table 3. Log fold changes <-2 or >2 of genes from the RNA-Seq data (blue) with p-values <0.05