Maternal Weight:
An opportunity to impact infant mortality in North Carolina
By
Shannon Kellner
A Master’s Paper submitted to the faculty of the University of North Carolina at Chapel Hill
In partial fulfillment of the requirements for the degree of Master of Public Health in
the Public Health Leadership Program.
Chapel Hill
2010
___________________________ Advisor signature/printed name
________________________________
Second Reader Signature/printed name
________________________________
Table of Contents
Abstract ... 3
Introduction... 5
Methods ... 7
Results ... 10
Discussion ... 17
Conclusions and Recommendations ... 22
Figures and Tables ... 25
Figure 1. Trends in the Distribution of BMI from 1993 to 2003 among Prepregnant U.S. Women in the Total Population and by Race or Ethnicity. ... 25
Table 1. Body Mass Index (BMI) Category Comparison ... 26
Table 2. Study Characteristics ... 27
Table 3. Adverse Outcomes Associated with Increased Prepregnancy Body Mass Index (BMI) ... 30
Table 4. Adverse Outcomes Associated with Decreased Prepregnancy Body Mass Index (BMI) ... 31
Table 5. Odds Ratios for Adverse Pregnancy Outcomes ... 32
Table 6. Additional Adverse Outcomes Noted in Ineligible Articles ... 38
Table 7. 2007 Population Estimate for North Carolina Females of Childbearing Age ... 39
Table 8. 2007 North Carolina Pregnancy Risk Assessment Monitoring System Survey Results ... 42
Table 9. Measuring Association between Maternal Characteristics and Overweight: 2007 North Carolina PRAMS data ... 44
Table 10. Frequency of HCP Reported Barriers to Diagnosing and Managing Overweight/Obesity ... 45
Abstract
Preliminary data for 2008 revealed that North Carolina’s infant morality rate
ranked 44th highest amongst the 50 U.S. states (N.C. Healthy Start Foundation, 2010). Addressing issues with maternal weight may offer an opportunity to impact adverse
pregnancy outcomes.
This report focused on two objectives to: (1) determine what adverse pregnancy
outcomes could be impacted by addressing weight issues in women of childbearing age
and (2) analyze the scope of overweight women of childbearing age in North Carolina.
The most commonly noted adverse pregnancy outcomes associated with
increased prepregnancy BMI were hypertensive disorders, gestational diabetes mellitus,
c-section, and macrosomia. When compared to women entering pregnancy with a
normal or low BMI, preeclampsia, gestational diabetes mellitus, and gestational
hypertension exhibited the highest risk-ranges for women with a high prepregnancy
BMI. For many of the adverse pregnancy outcomes, the greater the deviation of the
prepregnancy BMI from normal, the greater the risk for adverse pregnancy outcomes.
Based on 2007 Pregnancy Risk Assessment Monitoring System (PRAMS) data,
maternal characteristics associated with increased risk of overweight in North Carolina
include age, race, income, WIC recipient, and Medicaid recipient.
Healthcare providers (HCP’s) report the following common barriers to discussing
weight issues with patients: lack of time to counsel, lack of knowledge/confidence,
perception of patient motivation/compliance, insurance or Medicare reimbursement
may support HCP efforts to improve maternal prepregnancy BMI and subsequently
improve pregnancy outcomes.
Four additional recommendations for applying this information to impact maternal
and child health needs in North Carolina surfaced though this research: (1) encourage
use of standard BMI categories within clinical practice and research; (2) support studies
about appropriate weight gain for women entering pregnancy with an increased BMI;
(3) create and implement overweight/obesity prevention and management programs in
North Carolina focused on preconception and the identified high risk subgroups; and (4)
Introduction
Infant mortality rates directly reflect a population’s health and well-being.
Historically, the United States’ (U.S.) infant mortality has ranked surprisingly high
among industrialized nations. Although improvements in U.S. infant mortality have occurred over the years, the country’s world ranking continues to fall. With the most
recent international ranking in 2004, the U.S. infant mortality ranked 29th, down from 23rd in 1990 and 12th in 1960 (MacDorman & Mathews, 2010). Because of the lack of progress in this area, the Healthy People 2010 objective of reducing fetal and infant
mortality is being maintained as a Healthy People 2020 objective (Office of Disease
Prevention & Health Promotion, U.S. Department of Health and Human Services, 2009).
Successfully addressing this issue requires a firm grasp of factors associated
with infant mortality. Research identifies a multitude of factors contributing to these high
infant mortality rates, including maternal health, quality of and access to medical care,
socioeconomic conditions, and public health practices (MacDorman & Mathews, 2010).
Of these factors, maternal heath has earned a recent position in the North Carolina spotlight as public health experts examine how a woman’s preconception health
impacts the health of the infant.
In looking at women’s preconception health, issues with maternal weight deserve
special attention. Concerns about pregnancy outcomes in overweight mothers have
been present since 1945 (Odell, 1945). The Institute of Medicine and National
Research Council reported in Weight Gain during Pregnancy: Reexamining the
Guidelines (Institute of Medicine and National Research Council, 2009) that ―[e]vidence
(BMI) is an independent predictor of many adverse outcomes of pregnancy. As a result women should enter pregnancy with a BMI in the normal weight category.‖ (p. 7)
Yet, obesity has reached epidemic proportion in the U.S. and the number of
women entering pregnancy overweight or obese has also increased (Kim, Dietz, England, Morrow, & Callaghan, 2007). Kim et al.’s (2007) examination of obesity in
nine U.S. states from 1993-2003 found that prepregnancy obesity increased from 13%
in 1993-1994 to 22% in 2002-2003 (see Figure 1). Essentially, one-fifth of American
women were obese when they become pregnant as of 2003, a 70% increase within one
decade. Analyzing the increases from each of the nine states separately revealed an
increase ranging from 45% to 105% for individual states. Yeh and Shelton (2005) also
analyzed trends in prepregnancy BMI in the U.S. from 1999-2003. This research
demonstrated a 9.2% increase in overweight and obese women during the study period
(Yeh & Shelton, 2005). Both Kim et al. (2007) and Yeh and Shelton (2005) analyzed
subgroups of their study populations and found consistent increases within nearly all of
the subgroups examined, including age, race/ethnicity, education level, insurance type,
and parity. Developing effective interventions for many of the factors associated with
infant mortality has proven quite challenging, yet weight control offers promise as a
method of reducing adverse pregnancy outcomes (MacDorman & Mathews, 2010). Preliminary data for 2008 revealed that North Carolina’s infant mortality rate
ranked 44th highest amongst the 50 United States (N.C. Healthy Start Foundation, 2010). By improving their infant mortality rate, North Carolina therefore holds an
opportunity to impact the infant mortality rate of the entire country by decreasing the
for adverse pregnancy outcomes, it then becomes important to examine the scope of the overweight/obesity problem in North Carolina. How many of North Carolina’s
women of child-bearing age are affected by overweight/obesity? Is the rate substantial
enough to justify North Carolina utilizing its resources for interventions related to this
issue?
Methods
The objectives of this study are therefore to (1) determine what pregnancy
outcomes could be impacted by addressing weight issues in women of childbearing age
and (2) examine the scope of overweight women in the population of women in North
Carolina of child-bearing age. Two analytical approaches were taken to achieve these
objectives: a comprehensive literature review of prepregnancy BMI-related pregnancy
outcomes and a review of state-level population and surveillance data pertaining to
women of child-bearing age in North Carolina.
The literature review of prepregnancy BMI-related pregnancy outcomes
employed Google Scholar and PubMed to identify relevant research articles. Search
terms utilized included prepregnancy, prenatal, pregravid, body mass index, birth
outcomes, pregnancy complications, overweight, and obese. The titles and abstracts of
the articles produced by the searches were reviewed for relevance. Only original
research articles were retained. Articles prior to 1998 were excluded, as were articles
specific to multiple birth pregnancies and those not focused on prepregnancy weight
and BMI. Articles targeted to only one outcome were also excluded from review (e.g.,
studies designed to specifically examine preeclampsia). The reference lists from the
All eligible articles were explored for the increased risk of adverse pregnancy
outcomes between various BMI prepregnancy categories. Examining the analysis
methods utilized for each of the included studies proved valuable in determining
whether the results were adjusted for pertinent confounders. The adjusted odds ratios
were examined when available, and only values noted as statistically significant (odds
ratio confidence interval not including one) were included in this report.
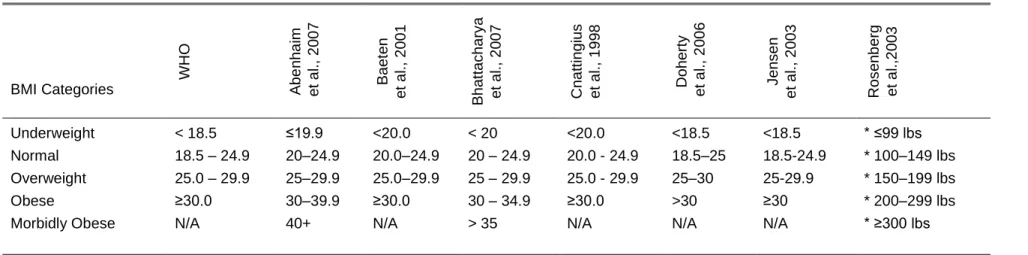
Although BMI has been well established as the preferred method for measuring
adiposity, classifying the level of adiposity by BMI range varies tremendously from one
source to another. The World Health Organization (WHO), Centers for Disease Control
and Prevention (CDC) and National Institutes of Health (NIH) standards are consistent;
yet, the literature reveals that researchers apply a wide variety of BMI ranges (Table 1).
To compensate for this limitation, general trends in the data were examined rather than
drawing specific conclusions for any one BMI category. The WHO BMI categories
were utilized for analysis of the eligible articles since the studies were conducted in a
number of countries. Although the WHO categories provide subgroups within the
obesity category, none of them is identified as morbidly obese. This category was
included for review when presented by the study author. When category names differed
from the WHO categories, the category was assigned to the WHO range which it most
closely matched.
Adverse pregnancy outcomes were defined as any unfavorable complication or
condition potentially related to pregnancy. They were categorized according to who
subdivided by the timing of their occurrence (during pregnancy, during labor or delivery,
after birth).
In examining the scope of overweight in North Carolina’s females of childbearing
age, the target population first needed to be quantified. To accomplish this, the North
Carolina Office of State Budget and Management (OSBM) population estimates and
projections were reviewed. These statistics are based on census data and
supplemented with population information collected annually from North Carolina
municipalities, counties and military bases. Data for women of childbearing age (15
through 44 years of age) was extracted from OSMB population estimates.
Subgroups of North Carolina’s women of childbearing age were then examined
to determine which subgroups held the highest risk for a BMI outside of the normal
range. The 2007 Pregnancy Risk Assessment Monitoring System (PRAMS) survey
results were utilized for this analysis. PRAMS data is state-specific and
population-based. It captures maternal attitudes and experiences before, during, and shortly after
pregnancy. PRAMS data collection occurs through a mailed survey/questionnaire or
through a telephone survey. The maternal characteristics of obesity among North
Carolina females of childbearing age were arranged according to WHO BMI standards with overweight and obese groups combined (i.e., overweight ≥25.0 BMI). The
proportions provided in each subgroup were adjusted to reflect the entire population of
North Carolina women having a live birth.
To truly compare where the highest risks lie, odds ratios were calculated based on the crude sample numbers provided. Armitage and Berry’s methods were applied
The odds of overweight among women exposed to the variable was compared to the
odds of overweight among the non-exposed. The referent group was set as the
maternal characteristic variable with the lowest calculated risk for overweight.
Results
The literature review regarding prepregnancy BMI-related pregnancy outcomes
produced seven articles meeting inclusion criteria. Six articles utilized normal BMI
category as the reference range (Abenhaim, Kinch, Morin, Benjamin, & Usher, 2007;
Baeten, Bukusi, & Lambe, 2001; Bhattacharya, Campbell, Liston, & Bhattacharya, 2007;
Doherty, Magann, Francis, Morrison, & Newnham, 2006; Jensen et al., 2003;
Rosenberg, Garbers, Chavkin, & Chiasson, 2003), and one study used underweight as
the null (Cnattingius, Bergstrom, Lipworth, & Kramer, 1998). The characteristics of the
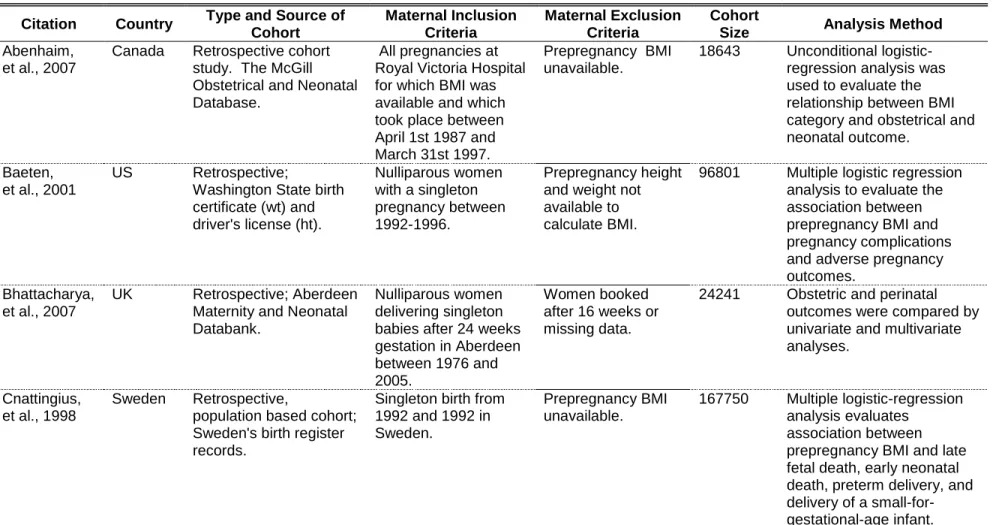
seven eligible research articles were examined (see Table 2). Two of the studies were
conducted in the U.S. (Baeten et al., 2001; Rosenberg et al., 2003), and one in each of
the following counties: Australia (Doherty et al., 2006), United Kingdom (Bhattacharya
et al., 2007), Sweden (Cnattingius et al., 1998), Canada (Abenhaim et al., 2007), and
Denmark (Jensen et al., 2003). The cohort sizes for the studies ranged from 2,459 to
213,208.
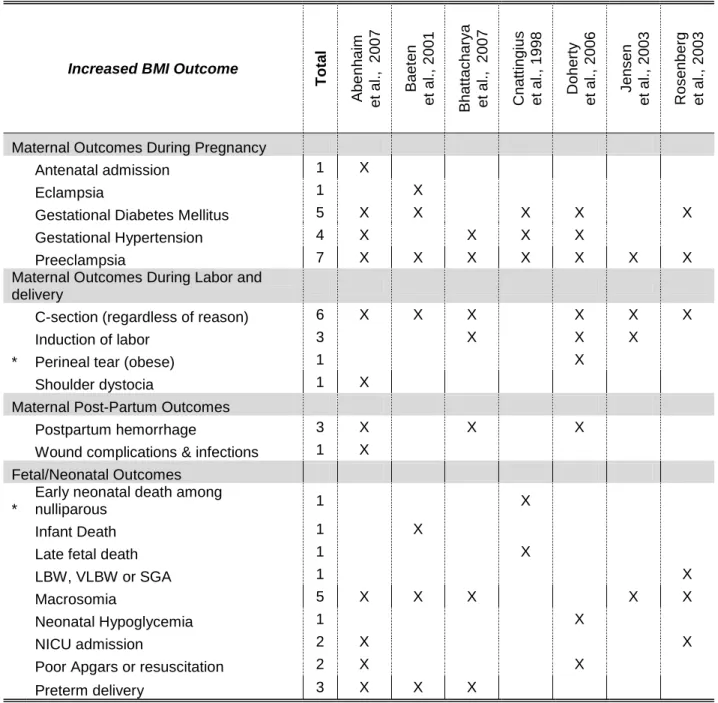
Tables 3 and 4 note the frequency of adverse pregnancy outcomes for
prepregnancy BMIs which were outside of the normal range and Table 5 lists the odds
ratios and corresponding confidence intervals.
Increased Prepregnancy BMI: Maternal Outcomes During Pregnancy
For women with an increased prepregnancy BMI, increased risk for five maternal
2007), eclampsia (Baeten et al., 2001), gestational diabetes (Abenhaim et al., 2007;
Baeten et al., 2001; Cnattingius et al., 1998; Doherty et al., 2006; Rosenberg et al.,
2003), gestational hypertension (Abenhaim et al., 2007; Bhattacharya et al., 2007;
Cnattingius et al., 1998; Doherty et al., 2006), and preeclampsia (Abenhaim et al., 2007;
Baeten et al., 2001; Bhattacharya et al., 2007; Cnattingius et al., 1998; Doherty et al.,
2006; Jensen et al., 2003; Rosenberg et al., 2003). Of these, gestational diabetes,
gestational hypertension, and preeclamsia were the three most commonly noted.
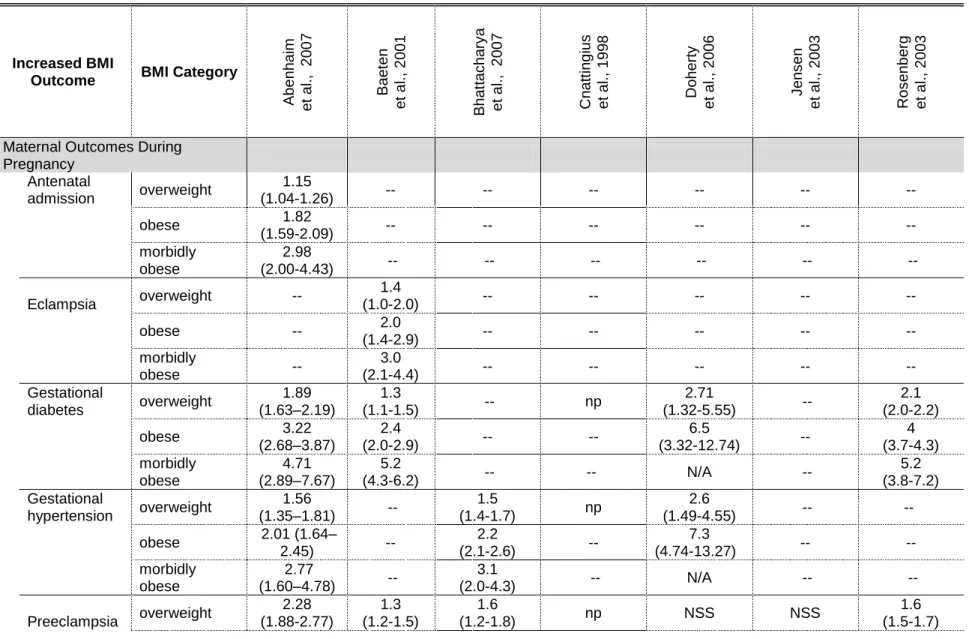
Gestational diabetes. Five of the seven studies demonstrated a statistically
significant increase in risk for gestational diabetes (Abenhaim et al., 2007; Baeten et al.,
2001; Cnattingius et al., 1998; Doherty et al., 2006; Rosenberg et al., 2003). The
gestational diabetes odds ratios for individual BMI categories ranged from 1.3 to 2.71
for overweight women (Abenhaim et al., 2007; Baeten et al., 2001; Doherty et al., 2006;
Rosenberg et al., 2003), 2.4 to 6.5 for obese women (Abenhaim et al., 2007; Baeten et
al., 2001; Doherty et al., 2006; Rosenberg et al., 2003) and 4.1 to 5.2 for morbidly
obese women (Abenhaim et al., 2007; Baeten et al., 2001; Rosenberg et al., 2003).
Multiple studies also reported an increasing risk with each increase in BMI category
(Abenhaim et al., 2007; Baeten et al., 2001; Doherty et al., 2006; Rosenberg et al.,
2003).
Preeclampsia All seven articles identified an increase in risk for preeclampsia in
women with elevated prepregnancy BMI (Abenhaim et al., 2007; Baeten et al., 2001;
Bhattacharya et al., 2007; Cnattingius et al., 1998; Doherty et al., 2006; Jensen et al.,
2003; Rosenberg et al., 2003). Abenhaim et al. (2007) found that when compared to
times greater risk, obese women a 3.65 times greater risk, and morbidly obese women
a 5.26 times greater risk. The other six research articles supported this finding that risk
of preeclampsia increased with increasing BMI category (Baeten et al., 2001;
Bhattacharya et al., 2007; Cnattingius et al., 1998; Doherty et al., 2006; Jensen et al.,
2003; Rosenberg et al., 2003). While Cnattingius (1998) did not provide odds ratios for preeclampsia, he did note that ―[t]he rate of preeclampsia increased with increasing
body-mass index, as follows: lean women, 1.8 %; normal women, 2.5 %; overweight women, 4.2 %; and obese women, 7.0 %‖ (p. 148).
Gestational hypertension Cnattingius (1998) found that 2.8 % of lean women
experienced gestational hypertension compared to 10.2 % among the obese women.
Other studies found that the odds of gestational hypertension were 1.5 to 2.6 times as
likely in overweight women as those with a normal prepregnancy BMI (Abenhaim et al.,
2007; Bhattacharya et al., 2007; Doherty et al., 2006). The odds ratios for obese and
morbidly obese were 2.01 to 7.3 (Abenhaim et al., 2007; Bhattacharya et al., 2007;
Doherty et al., 2006) and 2.77 to 3.1(Abenhaim et al., 2007; Bhattacharya et al., 2007),
respectively.
Increased Prepregnancy BMI: Maternal Outcomes during Labor and Delivery
An increased risk of four adverse maternal outcomes during labor and delivery
were identified for women with an increased prepregnancy BMI. These outcomes were
c-section (emergency and non-emergency) (Abenhaim et al., 2007; Baeten et al., 2001;
Bhattacharya et al., 2007; Doherty et al., 2006; Jensen et al., 2003; Rosenberg et al.,
2003), induction of labor (Abenhaim et al., 2007; Bhattacharya et al., 2007; Doherty et
dystocia (Abenhaim et al., 2007). Of these, c-sections and induction of labor were the
most common adverse outcomes experienced.
C-Sections Increased risk for c-section was noted in six of the seven articles
(Abenhaim et al., 2007; Baeten et al., 2001; Bhattacharya et al., 2007; Doherty et al.,
2006; Jensen et al., 2003; Rosenberg et al., 2003). Bhattacharya (2007) separated
elective sections from emergency sections. Doherty et al. (2006) analyzed all
c-sections together and then stratified those performed under emergency circumstances.
All other odds ratios for the remaining studies were for c-section, regardless of
indication.
When comparing c-sections regardless of indication, those receiving a c-section
were 1.3 to 1.6 times as likely to be overweight (Abenhaim et al., 2007; Baeten et al.,
2001; Doherty et al., 2006; Jensen et al., 2003; Rosenberg et al., 2003), 1.8 to 2.7 times
as likely to be obese (Abenhaim et al., 2007; Baeten et al., 2001; Doherty et al., 2006;
Jensen et al., 2003; Rosenberg et al., 2003), and 2.7 to 2.92 times as likely to be
morbidly obese (Abenhaim et al., 2007; Baeten et al., 2001; Rosenberg et al., 2003)
than those who entered pregnancy with a normal BMI. The odds ratios for elective
c-sections in overweight and obese women were not statistically significant in
Bhattacharya’s study; however, morbidly obese women demonstrated increased risk for
elective c-section (OR 3.1) which was statistically significant (Bhattacharya et al., 2007).
Emergency c-sections were 1.5 times as likely for overweight women, 2 to 4.57 times as
likely for obese women, and 2.8 times as likely for morbidly obese when compared to
Induction of Labor Bhattacharya et al.(2007), Doherty et al. (2006), and Jensen
et al. (2003) all reported increased risk for induction of labor among women with above
normal prepregnancy BMI. The odds of labor induction for overweight women ranged
from 1.3 to 1.5 among these studies. Obese women were 1.8 to 3.22 times as likely to
be induced and morbidly obese women were 1.8 times as likely.
Increased Prepregnancy BMI: Maternal Post-Partum Outcomes
Poor postpartum outcomes significantly increased due to increased
prepregnancy BMI included postpartum hemorrhage (Abenhaim et al., 2007;
Bhattacharya et al., 2007; Doherty et al., 2006) and wound complications and infections
(Abenhaim et al., 2007). Of these, postpartum hemorrhage was most commonly
reported, with statistical significance in three of the seven studies.
Postpartum Hemorrhage Abenhaim et al. (2007) and Doherty et al. (2006) revealed increasing risk of postpartum hemorrhage as a woman’s BMI increased.
Postpartum hemorrhage was 1.26 and 1.55 times as likely in overweight women
(Abenhaim et al., 2007; Doherty et al., 2006) and 1.5 and 1.71 times as likely in obese
women (Bhattacharya et al., 2007; Doherty et al., 2006). Morbidly obese women were
3.14 times as likely to experience postpartum hemorrhage (Abenhaim et al., 2007).
While Bhattacharya et al. (2007) did not show increasing risk with increasing BMI, all
three BMI categories demonstrated increased risk compared to women with normal
prepregnancy BMI (OR 1.1, 1.5, 1.3).
Increased Prepregnancy BMI: Fetal/Neonatal Outcomes
Adverse outcomes for the fetus were also identified when women’s prepregnancy
macrosomia; macrosomia was the more commonly noted of the two. Macrosomia was
defined as infants with a birth weight >4kg or infants >90th percentile of growth (large for gestational age (LGA)). This outcome was noted in five of the seven studies
(Abenhaim et al., 2007; Baeten et al., 2001; Bhattacharya et al., 2007; Jensen et al.,
2003; Rosenberg et al., 2003) with the odds of macrosomia increasing with increasing
BMI in all but one (Jensen et al., 2003) study.
Three studies reported an increased risk of preterm delivery associated with
prepregnancy weight although not for all BMI categories (Abenhaim et al., 2007; Baeten
et al., 2001; Bhattacharya et al., 2007). Of note, these studies also defined preterm
differently.
When Cnattigius et al. (1998) stratified results by nulliparous vs. parous, late fetal
death was found to be statistically significant among all groups of nulliparous women
with increased BMI groups. A statistically significant association was only observed for
morbidly obese parous women.
Babies of women with an above-normal prepregnancy BMI experienced
increased risk for the following outcomes after birth: poor Apgar scores or requiring
resuscitation (Abenhaim et al., 2007; Doherty et al., 2006), early neonatal death
(nulliparous) (Cnattingius et al., 1998), neonatal hypoglycemia (Doherty et al., 2006),
and Neonatal Intensive Care Unit (NICU) admission (Abenhaim et al., 2007; Rosenberg et al., 2003). NICU admissions in Rosenberg et al.’s (2003) study were not statistically
significant when adjusted for other pregnancy complications.
In the studies examined, pregnancies beginning with a below-normal maternal
prepregnancy BMI only demonstrated increased risk for poor fetal/neonatal outcomes.
The most commonly noted outcomes were related to fetal growth. Infants with
intrauterine growth restriction were 1.33 to 1.8 times as likely to be born to women with
decreased prepregnancy BMI (Abenhaim et al., 2007; Doherty et al., 2006), low birth
weight and very low birth weight were 1.4 to 1.7 times as likely (Bhattacharya et al.,
2007; Rosenberg et al., 2003), and small for gestational age were 1.54 times as likely
(Abenhaim et al., 2007; Cnattingius et al., 1998). Preterm labor and delivery were also
outcomes noted more commonly for women underweight prior to pregnancy when
compared to those with a normal prepregnancy BMI.
Scope of Overweight in North Carolina’s Females of Child-bearing Age
North Carolina OSBM data estimates North Carolina’s population of females of
childbearing age was 1,870,330 as of July 01, 2007. (Table 7 displays the population
by age group and county.) Women of childbearing age represented 20.7% of North Carolina’s population, which was estimated to be 9,041,821. The counties with the
highest number of women of childbearing age were: (1) Mecklenburg; (2) Wake; (3)
Guilford; (4) Forsyth; (5) Cumberland; (6) Durham ; (7) Buncombe; (8) Gaston; (9). New
Hanover; and (10) Union.
Table 8 shows 2007 PRAMS survey results for maternal characteristics of
obesity among North Carolina females of childbearing age. In terms of age, one third to
nearly one half of each age group was overweight. More Hispanic women were
overweight compared to non-Hispanic, but these differences were small (47.6%
overweight women of the three race categories examined, with 53% being overweight.
Women with an income of $25,000 to $49,999 had the highest percentage of
overweight (51.4%), followed by ≤14,999 (49.9%), 15,000-24,999 (43.9) and ≥50,000
(35.8%). 50.6% of Supplemental Nutrition Program for Women, Infants, and Children
(WIC) recipients were overweight while only 37.6% of those women who were not
receiving WIC were overweight. A slightly higher percentage of women on Medicaid
were overweight (47.7% vs. 38.6%). Nearly half of the infants born weighing under
2500 grams and half of the infants born weight at least 2500 grams were to overweight
mothers.
Comparing the calculated odds ratios and corresponding confidence intervals
revealed only a few statistically significant categories associated with overweight (see
Table 9). Comparison of age groups identified that women at least 20 years of age
were at greater risk for overweight than women less than 20 years of age. Within the
race subgroup, black women of childbearing age were 1.74 times as likely to be
overweight than white women. Two income levels demonstrated statistically significant
increases in risk for overweight women: 14,999 or less (OR 1.6) and 25,000 to 49,000
(OR 1.56). WIC recipients were at increased risk (OR 1.49) of being overweight in
comparison to those not receiving these services. Likewise, female Medicaid recipients
were 1.37 as likely to be overweight as those not receiving WIC.
Discussion
Women with increased prepregnancy BMI had the most adverse pregnancy
outcomes and highest risk ranges compared to those with normal and decreased
preeclampsia, gestational diabetes mellitus, and gestational hypertension. The most
commonly noted outcomes for increased BMI were hypertensive disorders (gestational
hypertension and preeclampsia), gestational diabetes mellitus, c-section, and
macrosomia.
The studies reviewed consistently demonstrate that deviation from normal
prepregnancy BMI increases maternal and fetal morbidity. This literature review has
also established that this problem is not limited to obesity, as adverse pregnancy
outcomes for underweight, overweight, obese and morbidly obese women were also
observed. The data support the importance of maintaining a normal BMI in managing
maternal and fetal morbidities. Not only does deviation beyond the normal BMI range
increase risk for adverse pregnancy outcomes, for many outcomes, the greater the
deviation, the greater the risk.
Comparing the risks for outcomes between BMI categories revealed a protective
association for some conditions and particular BMI categories. For example, Abenhaim
et al. (2007) reported a statistically significant lower risk of preeclampsia, gestational
hypertension, and gestational diabetes mellitus among women with a below normal
prepregnancy BMI. According to Doherty et al. (2006), women who enter pregnancy
with a low BMI were 0.9 times less likely to have a retained placenta than women
entering pregnancy at a normal BMI and 0.44 times less likely to have their neonate
experience hypoglycemia; these findings were statistically significant. An increased
BMI revealed decreased risk for low birth weight (LBW) and small for gestational age
The results of this literature review were consistent with other research which did
not meet the eligibility criteria for the review (e.g., other literature reviews and condition
specific studies). However, there are many concerns about performing detailed
comparisons between reports on the impact of maternal weight on pregnancy
outcomes. Primarily, the studies reviewed differed in their definitions of BMI-categories,
the choice of control groups, time and length of the study periods, choice of exclusion
criteria, and characteristics of the population studied. Additionally, some of the
outcomes identified may be interrelated. For example, gestational diabetes mellitus
increases the risk that an infant will be born large for gestational age, there may be
relationship between labor induction and c-section, and macrosomia may become an
indication for c-section. While most studies included in this review adjusted risks for
potential confounders, the potential confounders for each outcome varied across
studies. For example, when Cnattingius et al. (1998) stratified nulliparous and
multiparous women, it appeared that parity may be a risk factor for certain adverse
outcomes such as early neonatal death; none of the other studies controlled for parity.
Not only were adjusted odds ratios only available for some studies, one study did not
even provide crude odds ratios for all outcomes mentioned.
It is also important to note that the odds ratios for Doherty et al.’s (2006) obese
category tend to be higher for statistically significant outcomes. This may be due to the
inclusion of all women with a >30 prepregnancy BMI. While this matches the WHO BMI
categories, the other studies reviewed further subdivided obese and morbidly obese for
In additional to the previously mention limitation related to varying definitions of
BMI categories, one study used weight categories rather than BMI categories
(Rosenberg et al., 2003). Also, not all studies included analysis of underweight, and
Cnattingius (1998) utilized lean as the reference range.
Variation also existed in the method by which BMI was determined. Several
studies (Abenhaim et al., 2007; Baeten et al., 2001; Bodnar, Ness, Markovic, & Roberts,
2005) computed BMI based on self-reported weight and height. Self-reported weight is
commonly underestimated, especially by individuals of higher weight (Baeten et al.,
2001). This makes the reported data for these studies subject to reporter bias and
subsequent misclassification. These biases may lead to an underestimation of
association between exposure variables and outcomes.
The limited availability of research that fit the inclusion criteria for this review
served as yet another limitation. Studies excluded from this analysis contain more
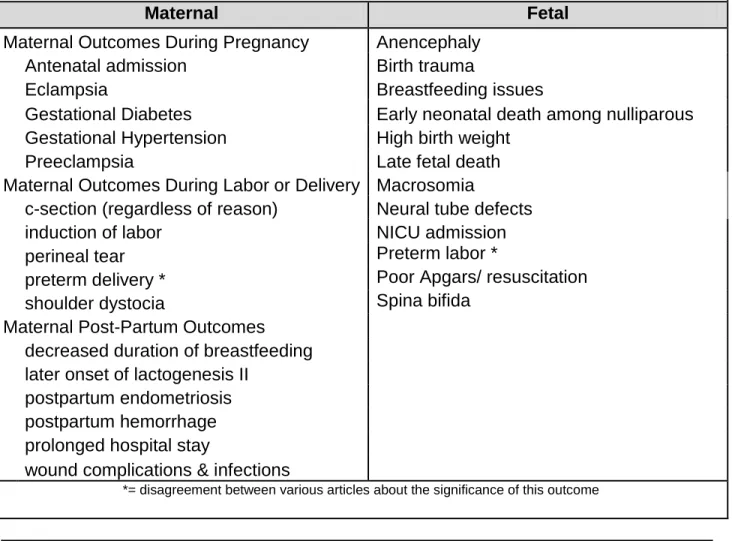
expansive lists of adverse outcomes. (Table 6 provides examples of adverse outcomes
noted in studies excluded from this analysis.) However, a more complex analysis would
be required to compare the results of those studies included with those excluded from
this review.
Based on the analysis of the 2007 PRAMS data, it appears that North Carolina’s
interventions should target women at least 20 years of age, with an income of less than
$50,000, WIC and Medicaid recipients, and Black women. OSMB data is helpful in
identifying the counties with the largest populations in the targeted age categories.
Additional research is required to identify counties where the other variables of interest
One of the primary limitations of this analysis was that the odds ratios were not
adjusted for potential cofounders. Adjusted odds ratios strengthen the validity and
generalizability of study results. A second limitation lies in the small sample sizes for
some of the subpopulations, which limit the statistical power of the study. A third
limitation is the reliance of PRAMS on self reported information. Reporter bias is likely
and may impact the accuracy of the analysis results.
Although the majority of patients believe that they should lose weight, most HCPs
do not diagnose or develop management plans for most overweight/obese patients
(Bardia, Holtan, Slezak, & Thompson, 2007; Budd, Mariotti, Graff, & Falkenstein, 2009;
Potter, Vu, & Croughan-Minihane, 2001). Research shows that patients want more help
with weight management than they are getting from their primary care providers (Potter
et al., 2001). With the BMI-related adverse pregnancy outcomes identified and the scope of North Carolina’s obesity problem in women of childbearing age better defined,
it therefore becomes important to examine how healthcare providers can be supported
in addressing this issue with patients.
The literature identifies several HCP barriers to diagnosis, treatment and management of overweight and obesity. Bardia et al.’s (2007) provides a
comprehensive list of HCP barriers. These barriers commonly appeared in other
literature as well (Boyle, Lawrence, Schwarte, Samuels, & McCarthy, 2009; Dunkley,
Stone, Patel, Davies, & Khunti, 2009; Forman-Hoffman, Little, & Wahls, 2006; Galuska,
Will, Serdula, & Ford, 1999; Lutfiyya et al., 2008; O'Donnell, Brown, & Dastani, 2006;
Power, Cogswell, & Schulkin, 2006; Ruelaz et al., 2007; Waring, Roberts, Parker, &
and lack of knowledge/confidence. Other barriers noted in multiple studies included
perception of patient motivation/compliance, insurance or Medicare reimbursement
issues, lack of belief the treatment will be effective, limited support resources,
environmental milieu, fear of embarrassing patient, and forgetting to talk about it or document it/ complacency. (Table 10 shows Bardia et al.’s (2007) comprehensive
barrier list and the frequencies with which each barrier was noted in the other literature examined.) Barriers in Bardia et al.’s (2007) ―HCP factors‖ category appeared in the
literature as the most commonly reported HCP barriers. This reinforces the importance
of interventions supporting HCP management of overweight/obesity, as diagnosis of the
condition serves as the strongest predictor of a management plan (Bardia et al., 2007).
Training and education of HCPs on this issue may ameliorate lack of knowledge, instill
greater confidence, and provide HCPs with information about effective
overweight/obesity treatment. HCPs would also benefit from tools to measure patient
motivation for change.
Conclusions and Recommendations
Through the process of meeting this report’s objectives, four primary
recommendations for using maternal weight to reduce infant mortality surfaced. First,
encourage use of standard definitions of BMI categories within clinical practice and
research. Monitoring this issue and the effectiveness of interventions is difficult without
a well established, standard baseline.
Second, support studies about the appropriate amount of pregnancy weight gain
including more complex analysis of existing data about the impact of prepregnancy
weight on adverse pregnancy outcomes.
Third, create and implement overweight/obesity prevention and management
programs. Budd et al. provides the following general program recommendations:
include pre and post-testing; focus on raising awareness of the etiology of obesity;
identify the implications of weight loss efforts; and provide information regarding
bias-free interventions. Galtier-Dereure et al. (2000) suggests the following for programs
targeted to HCPs: record BMI as part of standard physical; diagnose and treat
overweight/obesity when identified; preconception counseling; take metabolic and
vascular disorders into account when counseling about birth control methods; anticipate
BMI-related health conditions; and provide condition-specific support for women who
encounter BMI-related health conditions. Based on the scope of this issue in North
Carolina, programs and interventions should be targeted to women at least 20 years of
age, women with an income of less than $50,000, WIC and Medicaid recipients and
Black women.
A fourth recommendation is to ameliorate HCP identified barriers. Boyle et al.
(2009) notes that HCPs need support in both practice and advocacy efforts. Supporting
HCPs in practice includes providing education on the issue, identifying time-efficient
ways for them to address the issue with patients, funding prevention communication,
addressing issues with insurance coverage, offering incentives, providing monitoring
charts for BMI tracking, and equipping them with obesity prevention messages.
Supporting HCPs in obesity advocacy involves training HCPs on how to conduct
benefit communities and connecting HCPs to advocacy opportunities (Boyle et al.,
2009).
Prevention is key to addressing the impact of maternal weight on pregnancy
outcomes and ultimately infant mortality. Preconception efforts offer the best
opportunity for prevention and HCPs hold an influential position in terms of prevention and preconception interventions. Therefore, supporting North Carolina’s HCPs in
Figures and Tables
Figure 1. Trends in the Distribution of BMI from 1993 to 2003 among Prepregnant U.S. Women in the Total Population and by Race or Ethnicity.
Table 1. Body Mass Index (BMI) Category Comparison BMI Categories W HO A be nh a im et a l., 2 00 7 B ae ten et a l., 2 00 1 B ha ttac ha ry a et a l., 2 00 7 Cnat ti ng ius et a l., 1 99 8 Dohe rty et a l., 2 00 6 J en s en et a l., 2 00 3 Ro s en b erg et a l., 2 00 3
Underweight < 18.5 ≤19.9 <20.0 < 20 <20.0 <18.5 <18.5 * ≤99 lbs Normal 18.5 – 24.9 20–24.9 20.0–24.9 20 – 24.9 20.0 - 24.9 18.5–25 18.5-24.9 * 100–149 lbs Overweight 25.0 – 29.9 25–29.9 25.0–29.9 25 – 29.9 25.0 - 29.9 25–30 25-29.9 * 150–199 lbs Obese ≥30.0 30–39.9 ≥30.0 30 – 34.9 ≥30.0 >30 ≥30 * 200–299 lbs
Morbidly Obese N/A 40+ N/A > 35 N/A N/A N/A * ≥300 lbs
Table 2. Study Characteristics
Citation Country Type and Source of Cohort Maternal Inclusion Criteria Maternal Exclusion Criteria Cohort
Size Analysis Method Abenhaim,
et al., 2007
Canada Retrospective cohort study. The McGill Obstetrical and Neonatal Database.
All pregnancies at Royal Victoria Hospital for which BMI was available and which took place between April 1st 1987 and March 31st 1997.
Prepregnancy BMI unavailable.
18643 Unconditional logistic-regression analysis was used to evaluate the relationship between BMI category and obstetrical and neonatal outcome.
Baeten, et al., 2001
US Retrospective;
Washington State birth certificate (wt) and driver's license (ht).
Nulliparous women with a singleton pregnancy between 1992-1996.
Prepregnancy height and weight not available to calculate BMI.
96801 Multiple logistic regression analysis to evaluate the association between prepregnancy BMI and pregnancy complications and adverse pregnancy outcomes.
Bhattacharya, et al., 2007
UK Retrospective; Aberdeen Maternity and Neonatal Databank.
Nulliparous women delivering singleton babies after 24 weeks gestation in Aberdeen between 1976 and 2005.
Women booked after 16 weeks or missing data.
24241 Obstetric and perinatal outcomes were compared by univariate and multivariate analyses.
Cnattingius, et al., 1998
Sweden Retrospective,
population based cohort; Sweden's birth register records.
Singleton birth from 1992 and 1992 in Sweden.
Prepregnancy BMI unavailable.
167750 Multiple logistic-regression analysis evaluates
Citation Country Type and Source of Cohort Maternal Inclusion Criteria Maternal Exclusion Criteria Cohort
Size Analysis Method Doherty,
et al., 2006
Australia Secondary analysis of randomized controlled trial; questionnaires and medical records
evaluating the
effectiveness of Doppler ultrasound in unselected pregnancies.
Gestational age between 16 and 20 weeks, proficiency in English sufficient to understand the implications of participation, and an expectation to deliver at King Edward Memorial Hospital.
Prepregnancy BMI unavailable.
2827 Univariate comparisons between the BMI groups; Cox proportional hazards regression; and logistic regression modeling.
Jensen, et al., 2003
Denmark Historical cohort study; medical records for patients delivering at one of the four participating centers.
The first pregnancy for a patient from the time period January 1, 1992 to December 31, 1996 was included.
Women with gestational diabetes according to WHO criteria14 (2- hour glucose values ≥7.8 mmol/L); women receiving dietary treatment, underweight (BMI <18.5 kg/m2) women, those with missing data on weight and/or height; multiple gestation
pregnancies, and women referred to the centers from other hospitals because of a well-defined
chronic disease.
Citation Country Type and Source of Cohort
Maternal Inclusion Criteria
Maternal Exclusion Criteria
Cohort
Size Analysis Method Rosenberg,
et al., 2003
US Population-based study; birth certificate data obtained from the New York City Department of Health, Office of Vital Statistics and
Epidemiology.
Live singleton births whose certificates included maternal prepregnancy weight (unable to calculate BMI since height not available on birth certificate).
Table 3. Adverse Outcomes Associated with Increased Prepregnancy Body Mass Index (BMI)
Increased BMI Outcome
T o tal A be nh a im et a l., 2 00 7 B ae ten et a l., 2 00 1 B ha ttac ha ry a et a l., 2 00 7 Cnat ti ng ius et a l., 1 99 8 Dohe rty et a l., 2 00 6 J en s en et a l., 2 00 3 Ros en b er g et a l., 2 00 3
Maternal Outcomes During Pregnancy Antenatal admission 1 X
Eclampsia 1 X
Gestational Diabetes Mellitus 5 X X X X X
Gestational Hypertension 4 X X X X
Preeclampsia 7 X X X X X X X
Maternal Outcomes During Labor and
delivery
C-section (regardless of reason) 6 X X X X X X
Induction of labor 3 X X X
* Perineal tear (obese) 1 X
Shoulder dystocia 1 X
Maternal Post-Partum Outcomes
Postpartum hemorrhage 3 X X X
Wound complications & infections 1 X
Fetal/Neonatal Outcomes
*
Early neonatal death among
nulliparous 1 X
Infant Death 1 X
Late fetal death 1 X
LBW, VLBW or SGA 1 X
Macrosomia 5 X X X X X
Neonatal Hypoglycemia 1 X
NICU admission 2 X X
Poor Apgars or resuscitation 2 X X
Preterm delivery 3 X X X
* means that results discrepant between the 7 studies
Table 4. Adverse Outcomes Associated with Decreased Prepregnancy Body Mass Index (BMI)
Decreased BMI Outcome
T o tal A be nh a im et a l., 2 00 7 B ae ten et a l., 2 00 1 B ha ttac ha ry a et a l., 2 0 07 Cnat ti ng ius et a l., 1 99 8 Dohe rty et a l., 2 00 6 J en s en et a l., 2 00 3 Ros en b erg et a l., 2 00 3
Fetal/Neonatal Outcomes
IUGR 2 X X
Low birth weight 2 X X
Preterm delivery 1 X
Preterm Labor 1 X
SGA 2 X X
Table 5. Odds Ratios for Adverse Pregnancy Outcomes
Increased BMI
Outcome BMI Category
A be nh a im et a l., 2 00 7 B ae ten et a l., 2 00 1 B ha ttac ha ry a et a l., 2 00 7 Cnat ti ng ius et a l., 1 99 8 Dohe rty et a l., 2 00 6 J en s en et a l., 2 00 3 Ros en b erg et a l., 2 00 3
Maternal Outcomes During
Pregnancy
Antenatal
admission overweight
1.15
(1.04-1.26) -- -- -- -- -- --
obese 1.82
(1.59-2.09) -- -- -- -- -- --
morbidly obese
2.98
(2.00-4.43) -- -- -- -- -- --
Eclampsia overweight --
1.4
(1.0-2.0) -- -- -- -- --
obese -- 2.0
(1.4-2.9) -- -- -- -- --
morbidly
obese --
3.0
(2.1-4.4) -- -- -- -- --
Gestational
diabetes overweight
1.89
(1.63–2.19) (1.1-1.5) 1.3 -- np
2.71
(1.32-5.55) --
2.1 (2.0-2.2) obese (2.68–3.87) 3.22 2.4
(2.0-2.9) -- --
6.5
(3.32-12.74) --
4 (3.7-4.3) morbidly obese 4.71 (2.89–7.67) 5.2
(4.3-6.2) -- -- N/A --
5.2 (3.8-7.2) Gestational
hypertension overweight
1.56
(1.35–1.81) -- (1.4-1.7) 1.5 np
2.6
(1.49-4.55) -- -- obese 2.01 (1.64–
2.45) --
2.2
(2.1-2.6) --
7.3
(4.74-13.27) -- --
morbidly obese
2.77
(1.60–4.78) -- (2.0-4.3) 3.1 -- N/A -- --
Increased BMI
Outcome BMI Category
A be nh a im et a l., 2 00 7 B ae ten et a l., 2 00 1 B ha ttac ha ry a et a l., 2 00 7 Cnat ti ng ius et a l., 1 99 8 Dohe rty et a l., 2 00 6 J en s en et a l., 2 00 3 Ros en b erg et a l., 2 00 3
obese 4.65
(3.71-5.83)
2 (1.8-22)
3.1
(2.8-3.5) --
3.74 (1.95-7.17) 5.6 (3.5-9.0) 2.6 (2.4-2.9) morbidly obese 6.26 (3.48-11.26) 3.3 (3.0-3.7) 7.2
(4.7-11.2) -- N/A N/A
5 (3.5-7.1) Maternal Outcomes During Labor
and delivery
C-section
overweight (1.35–1.62) 1.48 1.3 (1.2-1.3) EL NSS EM 1.5 (1.3-1.6) -- all 1.39 (1.04-1.86) EM NSS 1.6 (1.3-2.3) 1.4 (1.3-1.4)
obese (1.62–2.11) 1.85 1.8 (1.6-1.9) EL NSS EM 2 (1.8-2.3) -- all 2.22 (1.58-3.12) EM 4.57 (2.22-9.41) 2.7 (1.9-3.8) 2.1 (2.0-2.2) morbidly obese 2.92 (1.97–4.34 2.7 (2.5-2.9) EL 3.1 (1.7-6.1) EM 2.8 (2.0-3.9)
-- N/A N/A 2.7
(2.2-3.4) Induction of
labor overweight
1.21
(1.10-1.32) --
1.3
(1.2-1.4) --
1.36 (1.05-1.77)
1.5
(1.1-2.2) --
obese 1.6
(1.40-1.82) --
1.8
(1.6-2.0) --
2.44 (1.72-3.45)
3.2
(2.2-4.6) --
morbidly obese
2.06
(1.38-3.07) --
1.8
(1.3-2.5) -- N/A N/A --
*
Perineal tear
(obese) overweight -- -- -- -- NSS -- --
obese -- -- -- -- 1.59
(1.08-2.33) -- --
morbidly
obese -- -- -- -- N/A -- --
Increased BMI
Outcome BMI Category
A be nh a im et a l., 2 00 7 B ae ten et a l., 2 00 1 B ha ttac ha ry a et a l., 2 00 7 Cnat ti ng ius et a l., 1 99 8 Dohe rty et a l., 2 00 6 J en s en et a l., 2 00 3 Ros en b erg et a l., 2 00 3
obese 1.89
(1.65-2.16)
-- -- -- -- -- --
morbidly
obese NSS -- -- -- -- -- --
Maternal Post-Partum Outcomes
Postpartum
hemorrhage overweight
1.26
(1.03-1.55) -- NSS --
1.55
(1.17-2.06) -- --
obese NSS -- 1.5
(1.3-1.7) --
1.71
(1.20-2.44) -- --
morbidly obese
3.14
(1.65-5.97) -- NSS -- N/A -- --
Wound complications/ infections
overweight NSS -- -- -- -- -- --
obese 2.69
(1.34-5.38) -- -- -- -- -- --
morbidly obese
6.41
(1.85-22.19) -- -- -- -- -- --
Fetal/ Neonatal Outcomes
Early neonatal death among nulliparous
overweight -- -- -- np -- -- --
obese -- -- -- np -- -- --
morbidly
obese -- -- -- np -- -- --
Infant death overweight -- NSS -- -- -- -- --
obese -- NSS -- -- -- -- --
morbidly
obese --
2.0
(1.2-3.1) -- -- -- -- --
Late fetal
Increased BMI
Outcome BMI Category
A be nh a im et a l., 2 00 7 B ae ten et a l., 2 00 1 B ha ttac ha ry a et a l., 2 00 7 Cnat ti ng ius et a l., 1 99 8 Dohe rty et a l., 2 00 6 J en s en et a l., 2 00 3 Ros en b erg et a l., 2 00 3 morbidly
obese -- -- --
2.7
(1.8-4.1) -- -- --
LBW, VLBW
or SGA overweight -- -- -- -- -- --
VLBW 1.2 (1.1-1.3)
obese -- -- -- -- -- -- VLBW 1.3
(1.1-1.6)
morbidly
obese -- -- -- -- -- -- NSS
Macrosomia overweight
1.66 (1.23-2.24)
1.2 (1.2-1.3)
1.4
(1.3-1.6) -- -- NSS
2.0 (1.9-2.1)
obese 2.32
(1.58-3.41)
1.5 (1.4-1.6)
1.9
(1.6-2.2) -- --
LGA 2.5 (1.8-3.6)
>4kg 2.2 (1.6-3.1) 3.1 (2.9-3.3) morbidly
obese NSS
2.1 (1.9-2.4)
2.1
(1.3-3.2) -- -- N/A
3.8 (2.8-5.1) Neonatal
hypoglycemia overweight -- -- -- --
1.91
(1.19-3.06) -- --
obese -- -- -- -- NSS -- --
morbidly
obese -- -- -- -- N/A -- --
NICU
admission overweight
1.21
(1.08-1.36) -- -- -- -- -- 1.1 (1.0-1.1)
obese 1.60
(1.37-1.87) -- -- -- -- -- 1.1 (1.0-1.2)
morbidly obese
2.89
(1.89-4.42) -- -- -- -- -- 1.5 (1.0-2.2)
Poor Apgar or
resuscitation overweight
1.70
(1.30-2.70) -- -- --
1.3
(1.01-1.67) -- --
obese 3.18
(2.11-4.81) -- -- --
1.75
Increased BMI
Outcome BMI Category
A be nh a im et a l., 2 00 7 B ae ten et a l., 2 00 1 B ha ttac ha ry a et a l., 2 00 7 Cnat ti ng ius et a l., 1 99 8 Dohe rty et a l., 2 00 6 J en s en et a l., 2 00 3 Ros en b erg et a l., 2 00 3 morbidly obese 6.00
(2.66-13.37) -- -- -- N/A -- --
* Preterm delivery overweight 32-36 wks 1.2 (1.04-1.38) <32wks NSS <37wks NSS ≤32 wks NSS
NSS -- -- -- --
obese
32-26 wks 1.6 (1.32-1.94)
NSS NSS -- -- -- --
morbidly obese 32-26 wks 2.43 (1.46-4.05) ≤32wks 1.5 (1.1-2.1) 1.2
(1.1-2.8) -- -- -- --
Decreased BMI
Outcome BMI Category
A B E NH A IM, et a l., 2 00 7 B A E T E N et a l, 2 00 1 B HA T T A CH A RY A , et a l., 2 00 7 CNATT ING IU S et a l, 1 99 8 DO HE RT Y , et a l, 2 00 6 J E NS E N, et a l., 2 00 3 RO S E N B E RG , et a l., 2 00 3
Maternal Labor and Delivery Outcomes
Preterm Labor Underweight 1.22 (1.09-1.37) -- -- -- -- -- --
Preterm Birth Underweight -- -- 1.4 (1.1-1.9) -- -- -- --
Fetal Outcomes
IUGR Underweight 1.33 (1.07-1.67) -- -- -- 1.8 (1.26-2.56) -- -- LBW or VLBW Underweight -- -- 1.7 (1.2-2.0) -- -- -- 1.4 (1.1-1.8)
SGA Underweight 1.54 (1.37-1.72) -- -- np -- -- --
Table 6. Additional Adverse Outcomes Noted in Ineligible Articles
Outcomes associated with increased prepregnancy body mass index
Maternal Fetal
Maternal Outcomes During Pregnancy Anencephaly
Antenatal admission Birth trauma
Eclampsia Breastfeeding issues
Gestational Diabetes Early neonatal death among nulliparous Gestational Hypertension High birth weight
Preeclampsia Late fetal death
Maternal Outcomes During Labor or Delivery Macrosomia
c-section (regardless of reason) Neural tube defects
induction of labor NICU admission
perineal tear Preterm labor *
preterm delivery * Poor Apgars/ resuscitation
shoulder dystocia Spina bifida
Maternal Post-Partum Outcomes
decreased duration of breastfeeding later onset of lactogenesis II
postpartum endometriosis
postpartum hemorrhage
prolonged hospital stay
wound complications & infections
*= disagreement between various articles about the significance of this outcome
Outcomes associated with Decreased prepregnancy body mass index
Maternal Fetal
Preterm birth * Intrauterine growth restriction
Preterm labor * Low birth weight/Very low birth weight
Protective effects on other complications
Small for gestational age
Table 7. 2007 Population Estimate for North Carolina Females of Childbearing Age
July 1, 2007 County Total Age Groups - Females
County 15 16-17 18-19 20-24 25-34 35-44 Total Median Age (All females) Alamance 976 1,986 2,532 5,082 8,597 10,638 29,811 38.98 Alexander 250 450 469 1,135 2,075 2,798 7,177 40.08 Alleghany 69 127 122 292 569 679 1,858 46.1 Anson 153 368 333 863 1,371 1,607 4,695 39.54 Ashe 132 292 285 717 1,344 1,687 4,457 45.21 Avery 103 192 243 591 878 1,051 3,058 42.88 Beaufort 303 608 602 1,491 2,518 2,856 8,378 42.79 Bertie 159 288 298 763 1,118 1,297 3,923 41.53 Bladen 191 434 401 1,083 1,860 2,067 6,036 40.61 Brunswick 655 1,328 1,297 2,873 5,776 7,135 19,064 42.32 Buncombe 1,380 2,861 2,759 6,705 14,169 16,185 44,059 42 Burke 582 1,195 1,210 2,777 4,596 6,055 16,415 41.4 Cabarrus 1,178 2,398 2,277 5,089 9,992 12,940 33,874 37.89 Caldwell 510 1,019 1,004 2,355 4,364 5,812 15,064 40.92
Camden 72 143 150 324 549 723 1,961 40.68
Carteret 381 785 763 1,990 3,100 4,145 11,164 45.54 Caswell 159 310 283 747 1,138 1,528 4,165 43 Catawba 1,031 2,098 2,054 4,624 9,306 11,196 30,309 39.18 Chatham 373 748 745 1,667 3,279 4,397 11,209 41.47 Cherokee 168 312 310 822 1,436 1,676 4,724 45.58
Chowan 110 218 219 542 771 885 2,745 43.09
Clay 56 110 123 304 522 613 1,728 47.9
Cleveland 725 1,474 1,548 3,213 5,775 6,934 19,669 39.76 Columbus 338 732 733 1,961 3,133 3,499 10,396 39.64 Craven 607 1,246 1,271 3,542 5,237 5,818 17,721 37.03 Cumberland 2,316 4,708 4,712 12,199 21,654 23,321 68,910 32.95 Currituck 178 353 363 827 1,336 1,848 4,905 40.44 Dare 207 417 450 997 1,590 2,371 6,032 43.82 Davidson 1,071 2,192 2,106 4,967 8,756 11,993 31,085 40.47 Davie 290 570 532 1,278 2,194 3,005 7,869 41.28 Duplin 349 720 709 1,684 3,114 3,445 10,021 37.7 Durham 1,534 3,183 4,403 11,423 19,218 18,480 58,241 34.44 Edgecombe 339 756 801 1,839 3,004 3,488 10,227 40.09 Forsyth 2,286 4,669 4,389 9,906 22,704 26,052 70,006 38.87 Franklin 403 833 806 1,766 3,320 4,448 11,576 38.89 Gaston 1,410 2,953 2,736 6,268 12,158 15,460 40,985 39.09
Gates 99 193 196 440 581 905 2,414 41.03
Graham 51 114 95 243 426 515 1,444 43.79
July 1, 2007 County Total Age Groups - Females
County 15 16-17 18-19 20-24 25-34 35-44 Total Median Age (All females) Harnett 790 1,623 1,792 3,987 6,909 8,269 23,370 35.67 Haywood 360 676 754 1,697 2,845 3,986 10,318 45.29 Henderson 609 1,256 1,240 2,862 5,227 6,922 18,116 44.14 Hertford 179 372 431 926 1,498 1,586 4,992 41.23 Hoke 342 702 651 1,406 2,917 3,429 9,447 33.23
Hyde 36 74 60 146 179 284 779 46.24
Iredell 1,097 2,245 2,111 4,702 8,814 11,744 30,713 39.06 Jackson 201 404 1,171 2,152 1,935 2,130 7,993 38.42 Johnston 1,141 2,253 2,072 4,530 9,419 13,299 32,714 37.54
Jones 83 151 154 365 469 658 1,880 43.51
Lee 357 765 749 1,785 3,336 3,838 10,830 37.76 Lenoir 364 766 753 1,923 3,137 3,651 10,594 42.09 Lincoln 523 1,089 1,006 2,234 4,107 5,571 14,530 39.38 Macon 202 402 393 1,015 1,645 2,146 5,803 46.37 Madison 125 265 381 656 1,097 1,430 3,954 42.18 Martin 172 343 334 884 1,306 1,598 4,637 41.81 Mcdowell 271 575 553 1,323 2,531 2,942 8,195 41.24 Mecklenburg 6,106 12,335 11,483 24,538 58,585 75,690 188,737 36.66 Mitchell 93 216 204 485 765 1,045 2,808 45.4 Montgomery 161 375 316 852 1,603 1,581 4,888 38.86 Moore 531 1,144 1,051 2,601 4,297 5,636 15,260 43.76 Nash 708 1,371 1,308 3,086 5,557 6,741 18,771 39.3 New Hanover 1,131 2,318 3,413 7,748 12,020 14,251 40,881 38.93 Northampton 130 323 300 766 1,025 1,283 3,827 44.16 Onslow 1,026 2,102 2,940 8,351 10,664 10,681 35,764 28.04 Orange 741 1,553 5,101 8,489 8,343 8,893 33,120 34.28
Pamlico 66 145 145 386 537 661 1,940 47.66
Pasquotank 298 607 796 1,731 2,382 2,806 8,620 38.07 Pender 346 709 654 1,518 2,755 3,618 9,600 41.52 Perquimans 83 159 195 451 672 841 2,401 43.79 Person 257 541 509 1,178 2,063 2,737 7,285 41.46 Pitt 1,036 2,061 4,498 9,584 9,695 11,126 38,000 33.55
Polk 125 236 245 539 886 1,197 3,228 47.23
Randolph 940 1,958 1,876 4,340 7,827 10,416 27,357 39.44 Richmond 345 669 628 1,543 2,741 3,098 9,024 38.76 Robeson 975 2,027 2,086 4,893 8,393 8,676 27,050 34.51 Rockingham 601 1,175 1,204 2,782 5,039 6,495 17,296 42.04 Rowan 904 1,907 1,939 4,529 8,075 9,534 26,888 39.39 Rutherford 463 869 832 2,000 3,627 4,406 12,197 41.07 Sampson 438 934 826 1,997 3,907 4,277 12,379 37.69 Scotland 289 584 561 1,434 2,509 2,568 7,945 37.17 Stanly 384 801 821 1,983 3,283 3,903 11,175 40.22 Stokes 326 641 625 1,439 2,590 3,701 9,322 41.11 Surry 460 973 946 2,079 3,972 5,119 13,549 41.42
Swain 90 215 212 459 793 930 2,699 40.69
July 1, 2007 County Total Age Groups - Females
County 15 16-17 18-19 20-24 25-34 35-44 Total Median Age (All females) Union 1,400 2,853 2,593 5,504 11,182 15,185 38,717 36.72 Vance 347 678 632 1,482 2,703 3,112 8,954 37.71 Wake 6,001 11,989 11,706 26,792 57,067 71,180 184,735 36.49 Warren 118 289 267 688 931 1,174 3,467 44.35 Washington 94 223 188 528 645 841 2,519 41.55 Watauga 193 368 2,136 3,912 2,202 2,288 11,099 33.24 Wayne 791 1,625 1,608 3,984 7,171 7,918 23,097 37.63 Wilkes 410 850 830 2,009 3,697 4,655 12,451 41.98 Wilson 563 1,149 1,106 2,545 4,870 5,494 15,727 38.88 Yadkin 253 546 492 1,119 1,994 2,859 7,263 41.03 Yancey 104 229 240 513 924 1,172 3,182 45.21 State 61,635 125,811 136,897 311,516 556,828 677,643 1,870,330 38.28
Last updated 24APR2009
Table 8. 2007 North Carolina Pregnancy Risk Assessment Monitoring System Survey Results
MATERNAL CHARACTERISTICS
Mother's Body Mass Index (BMI) Before Pregnancy*
Demographic Groups
Total Respond.#
Underweight (<18.5)
Normal (18.5-24.9)
Total Overweight (>=25.0)
N % C.I.
(95%) N %
C.I.
(95%) N %
C.I. (95%) Total 1557 79 4.6 3.5- 6.1 805 52.1 49.0-55.3 673 43.3 40.2-46.4 Age
< 20 years 184 19 8.5 4.6-15.3 105 58.5 48.9-67.4 60 33.0 24.8-42.5 20-24 years 370 28 6.2 3.8-10.0 179 47.5 41.1-53.9 163 46.3 40.0-52.7 25-34 years 782 28 3.6 2.3- 5.6 409 53.2 48.8-57.5 345 43.2 38.9-47.7 35+ years 221 4 1.7 0.5- 5.8 112 51.4 43.2-59.6 105 46.8 38.8-55.1 Race
White 1047 57 4.6 3.3- 6.4 579 56.0 52.3-59.6 411 39.4 35.8-43.1 Black 440 18 4.6 2.5- 8.4 189 42.4 36.2-48.9 233 53.0 46.5-59.3 Other 70 4 4.4 1.3-14.0 37 46.3 32.6-60.6 29 49.3 35.3-63.4 Hispanic origin
Yes 118 5 4.9 1.9-12.0 55 47.5 37.4-57.9 58 47.6 37.5-58.0 No 1436 74 4.6 3.4- 6.2 747 52.6 49.3-55.9 615 42.8 39.6-46.1 Education
< High School 259 20 6.0 3.2-10.8 125 47.1 39.3-55.0 114 47.0 39.2-54.9 High School 438 25 4.5 2.6- 7.8 207 48.8 42.9-54.7 206 46.7 40.8-52.6 > High School 854 34 4.2 2.8- 6.2 470 56.0 51.8-60.1 350 39.8 35.8-44.0 Marital Status
Demographic Groups
Total Respond.#
Underweight (<18.5)
Normal (18.5-24.9)
Total Overweight (>=25.0)
N % C.I.
(95%) N %
C.I.
(95%) N %
C.I. (95%) Income
14,999 or less 391 28 5.3 3.1- 9.0 173 44.8 38.4-51.3 190 49.9 43.4-56.4 15,000-24,999 238 20 9.5 5.6-15.5 112 46.6 38.5-54.8 106 43.9 36.0-52.2 25,000-49,999 302 14 3.6 1.8- 7.1 143 45.0 38.1-52.1 145 51.4 44.4-58.5 50,000 or more 535 13 2.5 1.3- 4.7 323 61.7 56.6-66.6 199 35.8 31.1-40.9 WIC recipient
No 919 35 3.5 2.3- 5.4 526 58.9 54.9-62.8 358 37.6 33.7-41.6 Yes 622 44 6.2 4.2- 9.1 275 43.2 38.3-48.2 303 50.6 45.6-55.6 Medicaid recipient
No 775 23 2.6 1.5- 4.3 447 58.9 54.5-63.1 305 38.6 34.4-42.9 Yes 782 56 6.5 4.6- 9.1 358 45.8 41.4-50.4 368 47.7 43.2-52.2 Infant's birth weight
Under 2500 grams 719 42 6.1 4.6- 8.1 358 49.2 45.6-52.7 319 44.7 41.2-48.3 2500+ grams 838 37 4.5 3.2- 6.1 447 52.4 49.0-55.8 354 43.1 39.8-46.5
*Data in this table are constructed from survey questions 5 and 6. (BMI is a relationship between weight and height that is associated with body fat and health risk.)
#Use caution in interpreting cell sizes less than 50.
N = Cell Size, % = Percentage, C.I. (95%) = Confidence Interval (at 95 % probability level), WIC = .Supplemental Nutrition Program for Women, Infants and Children.
The percentages shown are weighted percentages, designed to reflect the entire population of North Carolina women having a live birth.
Table 9. Measuring Association between Maternal Characteristics and Overweight: 2007 North Carolina PRAMS data
Demographic Groups
Total Respond.
#
Total Overweight (>=25.0)
N
Overweight
Odds Ratio LCI UCI
Total 1557 673
Age
< 20 years 184 60 1
20-24 years 370 163 1.63* 1.12 2.36
25-34 years 782 345 1.63* 1.16 2.29
35+ years 221 105 1.87* 1.25 2.81
Race
White 1047 411 1
Black 440 233 1.74* 1.39 2.18
Other 70 29 1.09 0.67 1.79
Hispanic origin
Yes 118 58 1
No 1436 615 0.78 0.53 1.13
Education
< High School 259 114 1.13 0.86 1.50
High School 438 206 1.28 1.01 1.61
> High School 854 350 1
Marital Status
Married 962 409 1
Other 595 264 1.08 0.88 1.33
Income
14,999 or less 391 190 1.6* 1.22 2.08
15,000-24,999 238 106 1.36 0.99 1.85
25,000-49,999 302 145 1.56* 1.17 2.08
50,000 or more 535 199 1
WIC recipient
No 919 358 1
Yes 622 303 1.49* 1.21 1.83
Medicaid recipient
No 775 305 1
Yes 782 368 1.37* 1.12 1.68
Infant's birth weight
Under 2500 grams 719 319 1.09 0.89 1.33
2500+ grams 838 354 1
*denotes statistically significant for overweight
Table 10. Frequency of HCP Reported Barriers to Diagnosing and Managing Overweight/Obesity
HCP reported Barriers Frequency
HCP factors
–Lack of time to counsel 8
–Lack of knowledge/confidence 8
–Fear of embarrassing patient 2
–Frustration from prior attempts 1 –Forgetting to talk about it or document it/
complacency 2
–Perception of patient motivation/compliance 7 –Lack of belief the treatment will be effective 5
Patient factors
–Frustration from prior attempts 1
–Lack of motivation 1
–Lack of knowledge 1
–Lack of family or community support 1
–Fear of embarrassment 1
–Cost concerns 1
Environmental and cultural factors
–Cultural practices 1
–Social or family support 1
–Environmental milieu 3
Economic factors
–Patient costs 1
–Direct obesity care, comorbidities 1
–Health care system costs 1
Allied health care factors
–Nonreferral to dietitian 1
–Patients not informed of BMI 1
–Limited time to counsel 1
Medical system factors
–Limited resources 4
–Higher initial cost of clinic visits 1 –Insurance or Medicare reimbursement issues 6 –Patient or physician not informed of BMI at office
visits 1
References
Abenhaim, H. A., Kinch, R. A., Morin, L., Benjamin, A., & Usher, R. (2007). Effect
of prepregnancy body mass index categories on obstetrical and neonatal
outcomes. Archives of Gynecology and Obstetrics, 275(1), 39-43.
Armitage, P., & Berry, G. (Eds.). (1994). Statistical methods in medical research.
London: Blackwell Scientific Publishers.
Baeten, J., Bukusi, E., & Lambe, M. (2001). Pregnancy complications and
outcomes among overweight and obese nulliparous women. American
Journal of Public Health, 91(3), 436.
Bardia, A., Holtan, S. G., Slezak, J. M., & Thompson, W. G. (2007). Diagnosis of
obesity by primary care physicians and impact on obesity management.
Paper presented at the Mayo Clinic Proceedings, , 82(8) 927.
Bhattacharya, S., Campbell, D. M., Liston, W. A., & Bhattacharya, S. (2007).
Effect of body mass index on pregnancy outcomes in nulliparous women
delivering singleton babies. BMC Public Health, 7, 168.
doi:10.1186/1471-2458-7-168
Bodnar, L. M., Ness, R. B., Markovic, N., & Roberts, J. M. (2005). The risk of
preeclampsia rises with increasing prepregnancy body mass index. Annals
Boyle, M., Lawrence, S., Schwarte, L., Samuels, S., & McCarthy, W. J. (2009).
Health care providers' perceived role in changing environments to promote
healthy eating and physical activity: Baseline findings from health care
providers participating in the healthy eating, active communities program.
Pediatrics, 123(Supplement), S293.
Budd, G. M., Mariotti, M., Graff, D., & Falkenstein, K. (2009). Health care
professionals' attitudes about obesity: An integrative review. Applied Nursing
Research, doi:10.1016/j.apnr.2009.05.001
Cnattingius, S., Bergstrom, R., Lipworth, L., & Kramer, M. S. (1998).
Prepregnancy weight and the risk of adverse pregnancy outcomes. The New
England Journal of Medicine, 338(3), 147-152.
doi:10.1056/NEJM199801153380302
Doherty, D., Magann, E., Francis, J., Morrison, J., & Newnham, J. (2006).
Pre-pregnancy body mass index and Pre-pregnancy outcomes. International Journal
of Gynecology and Obstetrics, 95(3), 242-247.
Dunkley, A. J., Stone, M. A., Patel, N., Davies, M. J., & Khunti, K. (2009). Waist
circumference measurement: Knowledge, attitudes and barriers in patients
and practitioners in a multi-ethnic population. Family Practice,