For release 10:00 a.m. (EDT) Thursday, September 11, 2014 USDL-14-1674
Technical information: (202) 691-6170 [email protected] www.bls.gov/iif/oshcfoi1.htm
Media contact: (202) 691-5902 [email protected]
NATIONAL CENSUS OF FATAL OCCUPATIONAL INJURIES IN 2013 (PRELIMINARY RESULTS)
A preliminary total of 4,405 fatal work injuries were recorded in the United States in 2013, lower than the revised count of 4,628 fatal work injuries in 2012, according to results from the Census of Fatal Occupational Injuries (CFOI) conducted by the U.S. Bureau of Labor Statistics. The rate of fatal work injury for U.S. workers in 2013 was 3.2 per 100,000 full-time equivalent (FTE) workers, compared to a final rate of 3.4 per 100,000 in 2012.
Final 2013 data from CFOI will be released in the late spring of 2015. Over the last 5 years, net
increases to the preliminary count have averaged 165 cases, ranging from a low of 84 in 2011 to a high of 245 in 2012. The revised 2011 figure was 2 percent higher than the preliminary total, while the 2012 figure was 6 percent higher.
Key preliminary findings of the 2013 Census of Fatal Occupational Injuries:
Fatal work injuries in private industry in 2013 were 6 percent below the 2012 figure. The
preliminary 2013 count of 3,929 fatal injuries in private industry represents the lowest annual total since the fatality census was first conducted in 1992.
Fatal work injuries among Hispanic or Latino workers were higher in 2013, rising 7 percent. The
797 Hispanic or Latino worker deaths in 2013 constituted the highest total since 2008. Fatal work injuries were lower among all other major racial/ethnic groups.
Since 2011, CFOI has identified whether fatally-injured workers were working as contractors at
the time of the fatal incident. In 2013, 734 decedents were identified as contractors, above the 715 reported in 2012. Workers who were working as contractors at the time of their fatal injury
accounted for 17 percent of all cases in 2013.
Fatal work injuries involving workers under 16 years of age were substantially lower, falling from
19 in 2012 to 5 in 2013—the lowest total ever reported by the census. Fatal work injuries in most other age groups were also lower in 2013, though fatal work injuries among workers 25 to 34 years of age were higher.
Work-related suicides were 8 percent higher than in 2012, but workplace homicides were 16
percent lower. Overall, violence accounted for 1 out of every 6 fatal work injuries in 2013.
The number of fatal work injuries among firefighters was considerably higher in 2013, rising
from 18 in 2012 to 53 in 2013. The large increase resulted from a few major incidents in which multiple fatalities were recorded, including the Yarnell Hill wildfires in Arizona which claimed the lives of 19 firefighters.
Fatal work injuries among self-employed workers were lower by 16 percent from 1,057 in 2012
to 892 in 2013. The preliminary 2013 total represents the lowest annual total since the series began in 1992.
2
Worker characteristics
Fatal work injury counts were lower for all major racial/ethnic groups in 2013 except Hispanic or Latino workers. Compared to final 2012 data, the number of fatal injuries was 6 percent lower among non-Hispanic white workers, 15 percent lower among non-non-Hispanic black or African-American workers, and 22 percent lower among non-Hispanic Asian workers.
Fatal work injuries among Hispanic or Latino workers were 7 percent higher – 797 in 2013 compared to 748 in 2012. Of the 797 fatal work injuries incurred by Hispanic or Latino workers, 527 (or 66 percent) involved foreign-born workers. The fatal injury rate for Hispanic or Latino workers was 3.8 per 100,000 FTE workers, which was higher than the national rate of 3.2 per 100,000 FTE workers. Overall, there were 845 fatal work injuries involving foreign-born workers in 2013, of which the greatest share (352 or 42 percent) was born in Mexico.
Fatal work injuries involving workers under 16 years of age were down sharply to 5 in 2013 from 19 in 2012, reaching its lowest annual total since the inception of the fatality census in 1992. There were 4,101 fatal work injuries among men in 2013 compared with 4,277 in 2012, and fatal injuries among women were lower by 14 percent in 2013 to 302 from 351 in 2012.
Fatal injuries to self-employed workers were 16 percent lower in 2013 – 892 compared to 1,057 in 2012. The 2013 preliminary total for employed workers is also a new low for the series, though self-employed workers still accounted for 20 percent of all fatal work injuries. Fatal injuries among wage and salary workers were lower by 2 percent in 2013.
For more detailed information on fatal injuries by worker characteristics, see the worker characteristics
table in the 2013 data section at www.bls.gov/iif/oshcfoi1.htm.
Type of incident
Fatal transportation incidents were lower by 10 percent in 2013, but still accounted for about 2 out of every 5 fatal work injuries in 2013. (See chart 1.) Of the 1,740 transportation-related fatal injuries in 2013, nearly 3 out of every 5 (991 cases) were roadway incidents involving motorized land vehicles. Nonroadway incidents, such as a tractor overturn in a farm field, accounted for another 13 percent of the transportation-related fatal injuries. About 16 percent of fatal transportation incidents (284 cases) in 2013 involved pedestrians who were struck by vehicles. Forty-eight of these occurred in work zones. (Note that transportation counts presented in this release are expected to rise when updated 2013 data are released in the late spring of 2015 because key source documentation detailing specific transportation-related incidents has not yet been received.)
Fatal work injuries among those fatally injured in aircraft incidents in 2013 were 5 percent higher than in 2012, accounting for 133 fatalities or about 8 percent of the transportation total.
Overall, 753 workers were killed as a result of violence and other injuries by persons or animals,
including 397 homicides and 270 suicides. The work-related suicide total for 2013 was 8 percent higher than the 2012 total. The homicide total was lower in 2013, falling 16 percent to 397 from 475 in 2012. Shootings were the most frequent manner of death in both homicides (80 percent) and suicides (47 percent). Of the 302 fatal work injuries involving female workers, 22 percent involved homicides, compared to 8 percent for men.
3
Fatal falls, slips, or trips took the lives of 699 workers in 2013. Falls to a lower level accounted for 574 (82 percent) of those fatalities. In 2013, the height of the fall was reported for 466 of the fatal falls to a lower level. Of those, about 1 in 4 occurred after a fall of 10 feet or less. Another one-fifth of the fatal falls occurred from falls of over 30 feet.
A preliminary total of 717 fatal work injuries occurred as a result of contact with objects and equipment in 2013. The number of workers who were fatally injured after being struck by objects or equipment was 3 percent lower – 503 fatal work injuries in 2013 compared to 519 in 2012. This total includes 245 workers struck by falling objects or equipment. Another 105 workers were fatally injured after being caught in running equipment or machinery.
Total=4,405
Roadway incidents 22%
Homicides 9% Falls, slips, trips
16%
Falls to lower level 13% 7%
Violence and other injuries by persons or animals 17% Contact with objects
and equipment 16% Exposure to harmful substances or environments
Other 17%
Transportation incidents 40% Fires and explosions 3%
Struck by object or equipment
11%
Chart 1. Fatal occupational injuries, by major event, 2013*
Source: U.S. Bureau of Labor Statistics, U.S. Department of Labor, 2014.
Note: Transportation counts presented in this release are expected to rise when updated 2013 data are released in spring 2015 because key source documentation detailing specific transportation-related incidents has not yet been received. Percentages may not add to 100 due to rounding.
*Data for 2013 are preliminary.
Other Other
5%
8% Other
3%
Fatal injuries involving fires and explosions were 21 percent higher in 2013 – 148 fatalities compared to 122 in 2012. This was due in part to some incidents in which more than one worker was killed,
including the Yarnell Hill wildfires in Arizona which took the lives of 19 firefighters. Overall, there were 146 multiple-fatality incidents in 2013 including transportation, explosion, homicide, and other events, in addition to fires. A total of 375 workers died in these 146 incidents.
For more detailed information on fatal injuries by incident, see the event tables in the 2013 data section at www.bls.gov/iif/oshcfoi1.htm.
Industry
In the private sector, a total of 3,929 fatal work injuries were recorded in 2013, 6 percent lower than the final total of 4,175 in 2012. Fatal work injuries were lower in both goods-producing industries and service-providing industries. The preliminary counts for all private industry and for goods-producing and service-providing industries are currently series lows for CFOI, but may be revised upward when final data are released in spring 2015.
4
Among goods-producing sectors, the number of fatal work injuries in the private construction sector in 2013 remained about the same as in 2012, though overall construction fatalities are down 36 percent since 2006. The 796 fatal work injuries in construction, nevertheless, accounted for the highest number of fatal work injuries of any industry sector in 2013. (See chart 2.)
Fatal work injuries in the private mining, quarrying, and oil and gas extraction sector were 15 percent lower in 2013 at 154 from 181 in 2012. The number of fatal work injury cases in oil and gas extraction industries were over 20 percent lower in 2013 to 112 from 142 in 2012. CFOI has used the North American Industry Classification System (NAICS) to define industry since 2003. Data on oil and gas extraction industries in CFOI comprise NAICS 21111 Oil and gas extraction, NAICS 213111 Drilling oil and gas wells, and NAICS 213112 Support activities for oil and gas operations.
*Data for 2013 are preliminary.
Note: Fatal injury rates exclude workers under the age of 16 years, volunteers, and resident military. The number of fatal work injuries represents total published fatal injuries before the exclusions. For additional information on the fatal work injury rate methodology, please see http://www.bls.gov/iif/oshnotice10.htm.
Source: U.S. Bureau of Labor Statistics, U.S. Department of Labor, 2014.
Fatal work injury rate (per 100,000 full-time equivalent workers) Total fatal work injuries = 4,405
All-worker fatal injury rate = 3.2
Number of fatal work injuries Utilities
Information Financial activities Educational and health services Other services (exc. public admin.)
Wholesale trade Leisure and hospitality Retail trade Manufacturing Professional and business services Government Transportation and warehousing
Construction 796 0 30 0.7 0.9 1.4 1.8 1.8 2.0 2.0 2.4 2.6 2.6 5.1 9.4 12.3 13.1 22.2 687 479 476 408 304 253 202 190 179 154 131 84 39 23
Chart 2. Number and rate of fatal occupational injuries, by industry sector, 2013*
20 10
Agriculture, forestry, fishing and hunting
Mining, quarrying, and oil and gas extraction
300 600
900
Agriculture, forestry, fishing and hunting fatalities were 6 percent lower in 2013 at 479 compared to 509 in 2012—the third straight year of declines. Fatal injuries in the crop production; animal production; and fishing, hunting, and trapping industries were lower, but fatal work injuries in forestry and logging were higher by 25 percent at 81—the highest number since 2008. Despite the declines in fatal work injuries overall in this sector, agriculture, forestry, fishing and hunting still recorded the highest fatal injury rate of any industry sector at 22.2 fatal injuries per 100,000 FTE workers in 2013.
Among service-providing industries in the private sector, fatal work injuries in transportation and warehousing accounted for 687 fatal work injuries in 2013, 7 percent lower than the revised 2012 count of 741 fatalities. The number of fatal injuries in truck transportation, the largest subsector within
transportation and warehousing in terms of employment, was 8 percent lower in 2013 at 461 fatalities. (As noted previously, transportation counts presented in this release are expected to rise when updated 2013 data are released in the late spring of 2015.) Among other transportation subsectors, fatal work injuries in air transportation were lower in 2013, but fatal work injury totals in water and rail
transportation were about the same as in 2012.
Fatal occupational injuries among government workers were higher by 5 percent to 476 fatal work injuries in 2013, up from 453 in 2012. Both federal government and local government had higher fatal
5
work injury totals in 2013 (up 19 percent and 10 percent, respectively), though fatal injuries among state government workers were lower by 22 percent.
For more detailed information on fatal injuries by industry, see the industry tables in the 2013 data
section at www.bls.gov/iif/oshcfoi1.htm
Occupation
Fatal work injuries in construction and extraction occupations were 6 percent lower in 2013 at 818. (See chart 3.) Fatal injuries among construction trades workers were lower by 5 percent in 2013 to 571 fatalities. The 2013 count of construction trades workers is also 42 percent lower than the high of 977 fatal work injuries reported in 2006. Fatal work injuries to construction laborers, the subgroup within construction trades with the highest number of fatalities, remained about the same in 2013.
Chart 3. Occupations with high fatal work injury rates, 2013*
*Data for 2013 are preliminary.
Note: Fatal injury rates exclude workers under the age of 16 years, volunteers, and resident military. The number of fatal work injuries represents total published fatal injuries before the exclusions. For additional information on the fatal work injury rate methodology, please see http://www.bls.gov/iif/oshnotice10.htm.
Source: U.S. Bureau of Labor Statistics, U.S. Department of Labor, 2014.
Fatal work injury rate (per 100,000 full-time equivalent workers)
50
100 200 400
Number of fatal work injuries Construction laborers
Farmers, ranchers, and other agricultural managers Driver/sales workers and truck drivers
Electrical power-line installers and repairers Refuse and recyclable material collectors Roofers Aircraft pilots and flight engineers Fishers and related fishing workers Logging workers
150 0 600 800
Total fatal work injuries = 4,405 All-worker fatal injury rate = 3.2 91.3
75.0 50.6
38.7 33.0
16 27
27 33 59
63 69
215 220
748
26.9 22.0 21.8 21.5 17.7 Mining machine operators
Fatal work injuries in transportation and material moving occupations were 5 percent lower to 1,184 in 2013. Drivers/sales workers and truck drivers accounted for more than 3 out of every 5 fatal injuries in this sector (748 of the 1,184 fatal injuries in 2013). As noted previously, transportation and material moving counts presented in this release are expected to rise when updated 2013 data are released in the late spring of 2015.
The number of fatal work injuries among protective service occupations was higher by 7 percent in 2013 to 247 fatalities. This was led by higher numbers of fatal injuries involving firefighting and prevention workers. Fatal injuries among firefighters rose 194 percent to 53 fatal work injuries from 18 in 2012. Two incidents alone accounted for over half of the 53 fatal injuries involving firefighters. Fatal work injuries among law enforcement workers were down 20 percent to a new series low of 97 fatalities. Fatalities among farming, fishing, and forestry occupations were lower by 13 percent to 225 in 2013. The decline was led by the 19 percent drop in fatalities involving agricultural workers to a series low of 123 in 2013 from 152 in 2012.
6
Fatal injuries to resident military personnel were higher in 2013 – 67 fatal work injuries compared to 50 in 2012.
For more detailed information on fatal injuries by occupation, see the occupation tables in the 2013 data
section at www.bls.gov/iif/oshcfoi1.htm.
Contract workers
In addition to identifying the industry in which a decedent was employed, CFOI began in 2011 to identify whether a worker was a contractor. A contractor is defined as a worker employed by one firm but working at the behest of another firm that exercises overall responsibility for the operations at the site where the decedent was fatally injured. This information helps to identify the location and type of work being performed when the fatal work injury occurred.
In 2013, the number of fatal occupational injuries incurred by contractors was 734, or 17 percent of all fatal injuries, compared to 715 (15 percent) reported in 2012. Falls to a lower level accounted for 31 percent of contractor deaths while struck by object or equipment (18 percent), pedestrian struck by vehicle (11 percent), and exposure to electricity (7 percent) incidents also were frequent events among contractors. These four types of incidents each constituted a greater share of contractor fatalities than they did for all workers.
Fatally-injured contractors were most often contracted by a government entity (146 or 20 percent of all contractors) and by firms in the private construction (139 or 19 percent); financial activities (61 or 8 percent); mining, quarrying, and oil and gas extraction (59 or 8 percent); and manufacturing (58 or 8 percent) industry sectors.
Half of all contractors (367) were working in construction and extraction occupations when fatally injured. Decedents in this occupation group were most often employed as construction laborers (95), first-line supervisors/managers of construction trades and extraction workers (48), roofers (39),
carpenters (26), and electricians (26). Among contractors who were employed outside the construction and extraction occupations group, the largest number of fatal occupational injuries was incurred by heavy and tractor-trailer truck drivers (55); security guards (22); landscaping and groundskeeping workers (14); tree trimmers and pruners (14); and welders, cutters, solderers, and brazers (13).
For more detailed information on fatal injuries incurred by contract workers, see the contractor table in
the miscellaneous CFOI data tables section at www.bls.gov/iif/oshcfoi1.htm#other.
State and metropolitan statistical area (MSA)
Seventeen states and the District of Columbia reported higher numbers of fatal work injuries in 2013 than in 2012, while 30 states reported lower numbers. Three states reported the same number as in 2012. For more detailed state results, contact the individual state agency responsible for the collection of CFOI data in that state. Although data for Puerto Rico, the U.S. Virgin Islands, and Guam are not included in the national totals for this release, results for these jurisdictions are available.
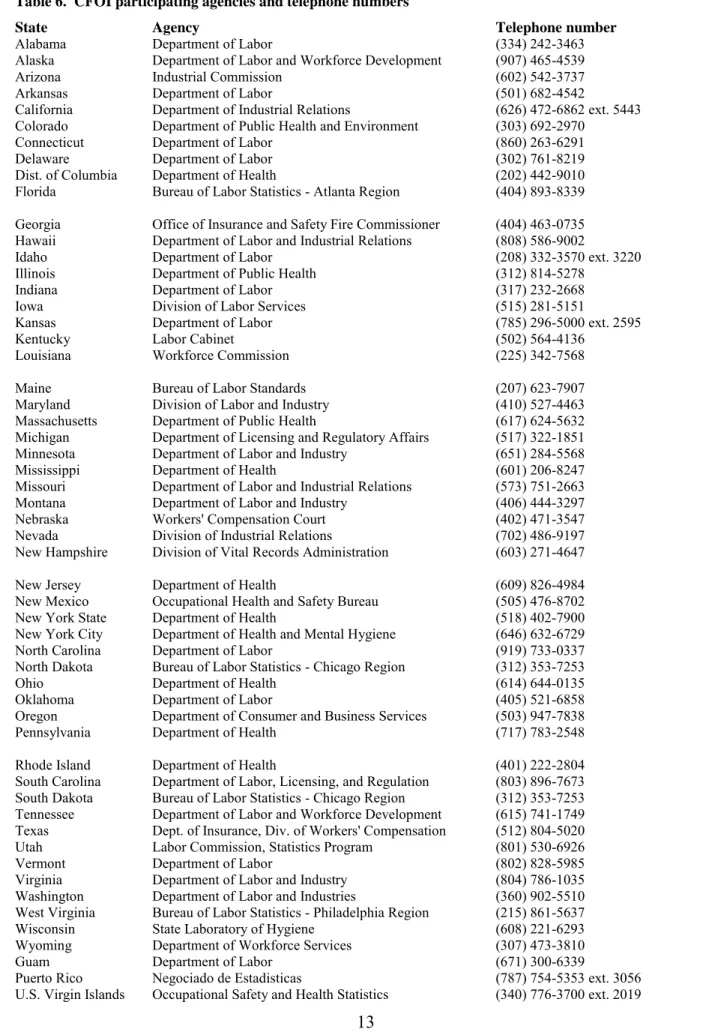
Participating agencies and their telephone numbers are listed in Table 6. For more detailed information on fatal injuries in a particular state, please contact the individual state agency.
7
Detailed data are available on fatal work injuries for more than 50 MSAs and counts of fatal work injuries are available for over 300 MSAs. For additional data by MSA, see the tables in the MSA data
tables section at www.bls.gov/iif/oshcfoi1.htm#MSA.
Background of the program
The Census of Fatal Occupational Injuries (CFOI), part of the BLS Occupational Safety and Health Statistics (OSHS) program, compiles a count of all fatal work injuries occurring in the U.S. during the calendar year. The CFOI program uses diverse state, federal, and independent data sources to identify, verify, and describe fatal work injuries. This ensures counts are as complete and accurate as possible. For the 2013 data, over 19,100 unique source documents were reviewed as part of the data collection process. For technical information and definitions for CFOI, please go to the BLS Handbook of Methods
on the BLS website at www.bls.gov/opub/hom/pdf/homch9.pdf.
The Survey of Occupational Injuries and Illnesses (SOII), another component of the OSHS program, presents frequency counts and incidence rates by industry and also by detailed case circumstances and worker characteristics for nonfatal workplace injuries and illnesses for cases that result in days away from work. Incidence rates for 2013 by industry and case type will be published in October 2014, and information on 2013 case circumstances and worker characteristics will be available in November 2014.
For additional data, access the BLS website: www.bls.gov/iif/.
These data are being released 13years after the terrorist attacks on September 11, 2001.
Information on the 2,886 workers who were killed while working at the time of the 9/11 attacks is available at: www.bls.gov/iif/oshwc/cfoi/cfnr0008.pdf.
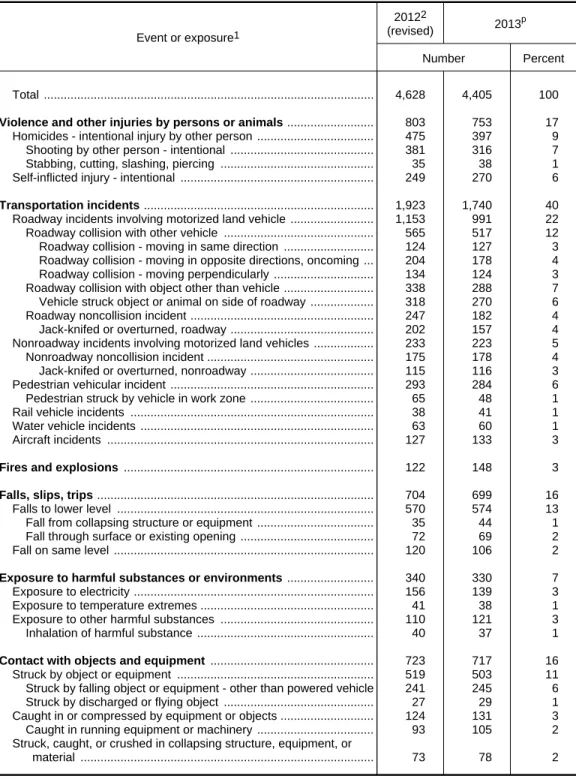
Table 1. Fatal occupational injuries by event or exposure, 2012-2013
Event or exposure1
20122
(revised) 2013
p
Number Percent
Total ... 4,628 4,405 100
Violence and other injuries by persons or animals ... 803 753 17
Homicides - intentional injury by other person ... 475 397 9 Shooting by other person - intentional ... 381 316 7 Stabbing, cutting, slashing, piercing ... 35 38 1 Self-inflicted injury - intentional ... 249 270 6
Transportation incidents ... 1,923 1,740 40
Roadway incidents involving motorized land vehicle ... 1,153 991 22 Roadway collision with other vehicle ... 565 517 12 Roadway collision - moving in same direction ... 124 127 3 Roadway collision - moving in opposite directions, oncoming ... 204 178 4 Roadway collision - moving perpendicularly ... 134 124 3 Roadway collision with object other than vehicle ... 338 288 7 Vehicle struck object or animal on side of roadway ... 318 270 6 Roadway noncollision incident ... 247 182 4 Jack-knifed or overturned, roadway ... 202 157 4 Nonroadway incidents involving motorized land vehicles ... 233 223 5 Nonroadway noncollision incident ... 175 178 4 Jack-knifed or overturned, nonroadway ... 115 116 3 Pedestrian vehicular incident ... 293 284 6 Pedestrian struck by vehicle in work zone ... 65 48 1 Rail vehicle incidents ... 38 41 1 Water vehicle incidents ... 63 60 1 Aircraft incidents ... 127 133 3
Fires and explosions ... 122 148 3
Falls, slips, trips ... 704 699 16
Falls to lower level ... 570 574 13 Fall from collapsing structure or equipment ... 35 44 1 Fall through surface or existing opening ... 72 69 2 Fall on same level ... 120 106 2
Exposure to harmful substances or environments ... 340 330 7
Exposure to electricity ... 156 139 3 Exposure to temperature extremes ... 41 38 1 Exposure to other harmful substances ... 110 121 3 Inhalation of harmful substance ... 40 37 1
Contact with objects and equipment ... 723 717 16
Struck by object or equipment ... 519 503 11 Struck by falling object or equipment - other than powered vehicle 241 245 6 Struck by discharged or flying object ... 27 29 1 Caught in or compressed by equipment or objects ... 124 131 3 Caught in running equipment or machinery ... 93 105 2 Struck, caught, or crushed in collapsing structure, equipment, or
material ... 73 78 2
1 Based on the BLS Occupational Injury and Illness Classification System (OIICS) 2.01 implemented for 2011 data forward.
2 Totals for 2012 are revised and final. The BLS news release issued August 22, 2013, reported a total of 4,383 fatal work injuries for calendar year 2012. Since then, an additional 245 job-related fatal injuries were identified, bringing the total job-related fatal injury count for 2012 to 4,628.
p Data for 2013 are preliminary. Revised and final 2013 data are scheduled to be released in spring 2015.
Note: Totals for major categories may include subcategories not shown separately. Percentages may not add to totals because of rounding. CFOI fatality counts exclude illness-related deaths unless precipitated by an injury event.
Source: U.S. Department of Labor, Bureau of Labor Statistics, in cooperation with state, New York City, District of Columbia, and federal agencies, Census of Fatal Occupational Injuries
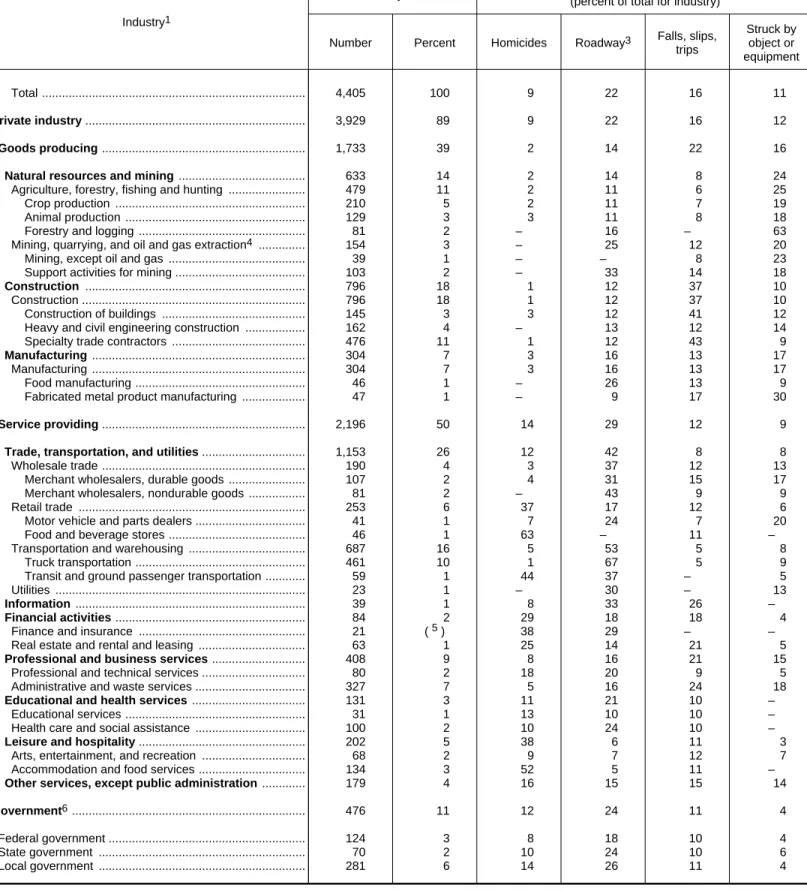
Table 2. Fatal occupational injuries by industry and selected event or exposure, 2013p
Industry1
Fatal injuries Selected event or exposure2
(percent of total for industry)
Number Percent Homicides Roadway3 Falls, slips,
trips
Struck by object or equipment
Total ... 4,405 100 9 22 16 11
Private industry ... 3,929 89 9 22 16 12
Goods producing ... 1,733 39 2 14 22 16
Natural resources and mining ... 633 14 2 14 8 24
Agriculture, forestry, fishing and hunting ... 479 11 2 11 6 25
Crop production ... 210 5 2 11 7 19
Animal production ... 129 3 3 11 8 18
Forestry and logging ... 81 2 – 16 – 63
Mining, quarrying, and oil and gas extraction4... 154 3 – 25 12 20
Mining, except oil and gas ... 39 1 – – 8 23
Support activities for mining ... 103 2 – 33 14 18
Construction ... 796 18 1 12 37 10
Construction ... 796 18 1 12 37 10
Construction of buildings ... 145 3 3 12 41 12
Heavy and civil engineering construction ... 162 4 – 13 12 14
Specialty trade contractors ... 476 11 1 12 43 9
Manufacturing ... 304 7 3 16 13 17
Manufacturing ... 304 7 3 16 13 17
Food manufacturing ... 46 1 – 26 13 9
Fabricated metal product manufacturing ... 47 1 – 9 17 30
Service providing ... 2,196 50 14 29 12 9
Trade, transportation, and utilities ... 1,153 26 12 42 8 8
Wholesale trade ... 190 4 3 37 12 13
Merchant wholesalers, durable goods ... 107 2 4 31 15 17
Merchant wholesalers, nondurable goods ... 81 2 – 43 9 9
Retail trade ... 253 6 37 17 12 6
Motor vehicle and parts dealers ... 41 1 7 24 7 20
Food and beverage stores ... 46 1 63 – 11 –
Transportation and warehousing ... 687 16 5 53 5 8
Truck transportation ... 461 10 1 67 5 9
Transit and ground passenger transportation ... 59 1 44 37 – 5
Utilities ... 23 1 – 30 – 13
Information ... 39 1 8 33 26 –
Financial activities ... 84 2 29 18 18 4
Finance and insurance ... 21 (5) 38 29 – –
Real estate and rental and leasing ... 63 1 25 14 21 5
Professional and business services ... 408 9 8 16 21 15
Professional and technical services ... 80 2 18 20 9 5
Administrative and waste services ... 327 7 5 16 24 18
Educational and health services ... 131 3 11 21 10 –
Educational services ... 31 1 13 10 10 –
Health care and social assistance ... 100 2 10 24 10 –
Leisure and hospitality ... 202 5 38 6 11 3
Arts, entertainment, and recreation ... 68 2 9 7 12 7
Accommodation and food services ... 134 3 52 5 11 –
Other services, except public administration ... 179 4 16 15 15 14
Government6... 476 11 12 24 11 4
Federal government ... 124 3 8 18 10 4
State government ... 70 2 10 24 10 6
Local government ... 281 6 14 26 11 4
1 Industry data are based on the North American Industry Classification System, 2007.
2 Based on the BLS Occupational Injury and Illness Classification System (OIICS) 2.01 implemented for 2011 data forward. The figure shown is the percent of the total fatal injuries for that industry group.
3 "Roadway" includes deaths to vehicle occupants resulting from traffic incidents that occur on the public roadway, shoulder, or surrounding area. It excludes incidents occurring entirely off the roadway, such as in parking lots and on farms; incidents involving trains; and deaths to pedestrians or other nonpassengers.
4 Includes fatal injuries at all establishments categorized as Mining, quarrying, and oil and gas extraction (Sector 21) in the North American Industry Classification System, 2007, including establishments not governed by the Mine Safety and Health Administration (MSHA) rules and reporting, such as those in Oil and Gas Extraction.
5 Less than or equal to 0.5 percent.
6 Includes fatal injuries to workers employed by governmental organizations regardless of industry.
p Data for 2013 are preliminary. Revised and final 2013 data are scheduled to be released in spring 2015.
Note: Totals for major categories may include subcategories not shown separately. Percentages may not add to totals because of rounding. Dashes indicate no data reported or data that do not meet publication criteria. CFOI fatality counts exclude illness-related deaths unless precipitated by an injury event. There were zero fatal injuries for which there was insufficient information to determine a specific industry classification.
Source: U.S. Department of Labor, Bureau of Labor Statistics, in cooperation with state, New York City, District of Columbia, and federal agencies, Census of Fatal Occupational Injuries
Table 3. Fatal occupational injuries by occupation and selected event or exposure, 2013p
Occupation1
Fatal injuries Selected event or exposure2 (percent of total for occupation)
Number Percent Homicides Roadway3 Falls, slips, trips
Struck by object or equipment
Total ... 4,405 100 9 22 16 11
Management occupations ... 389 9 13 14 10 13
Top executives ... 30 1 13 23 13 – Operations specialties managers ... 19 (4) 26 – 26 – Other management occupations ... 322 7 12 11 9 15
Business and financial operations occupations ... 21 (4) 33 14 14 –
Computer and mathematical occupations ... 11 (4) – – – –
Architecture and engineering occupations ... 34 1 6 12 18 –
Engineers ... 20 (4) 5 20 15 –
Life, physical, and social science occupations ... 23 1 – 13 – –
Community and social services occupations ... 18 (4) – 39 17 –
Legal occupations ... 14 (4) 36 – 29 –
Education, training, and library occupations ... 19 (4) 21 – 26 –
Arts, design, entertainment, sports, and media occupations ... 50 1 10 22 16 –
Entertainers and performers, sports and related workers ... 33 1 12 15 15 –
Healthcare practitioners and technical occupations ... 59 1 12 27 5 –
Health diagnosing and treating practitioners ... 36 1 19 19 – – Health technologists and technicians ... 19 (4) – 37 – –
Healthcare support occupations ... 18 (4) – 39 – –
Protective service occupations ... 247 6 26 21 5 1
Fire fighting and prevention workers ... 53 1 – 11 2 – Law enforcement workers ... 97 2 31 34 5 – Other protective service workers ... 67 2 48 10 6 –
Food preparation and serving related occupations ... 70 2 41 6 17 –
Supervisors, food preparation and serving workers ... 23 1 48 13 17 –
Building and grounds cleaning and maintenance occupations ... 242 5 2 8 31 21
Building cleaning and pest control workers ... 54 1 6 9 28 –
Grounds maintenance workers ... 146 3 – 9 31 27
Personal care and service occupations ... 47 1 19 15 13 9
Sales and related occupations ... 211 5 46 15 9 2
Supervisors, sales workers ... 100 2 46 8 11 3 Retail sales workers ... 64 1 66 5 5 – Sales representatives, services ... 5 (4) – 80 – –
Sales representatives, wholesale and manufacturing ... 25 1 – 64 12 –
Office and administrative support occupations ... 70 2 14 31 24 4
Material recording, scheduling, dispatching, and distributing workers 41 1 – 46 17 –
Farming, fishing, and forestry occupations ... 225 5 2 6 4 32
Agricultural workers ... 123 3 3 10 6 15 Fishing and hunting workers ... 28 1 – – – –
Forest, conservation, and logging workers ... 62 1 – – – 79
Construction and extraction occupations ... 818 19 2 11 36 11
Supervisors, construction and extraction workers ... 119 3 – 13 30 12
Construction trades workers ... 571 13 2 8 42 9 Extraction workers ... 82 2 – 16 16 26
Installation, maintenance, and repair occupations ... 356 8 4 13 20 17
Vehicle and mobile equipment mechanics, installers, and repairers 100 2 – 11 6 40
Other installation, maintenance, and repair occupations ... 202 5 2 14 24 9
Production occupations ... 210 5 3 8 18 20
Supervisors, production workers ... 27 1 – – 15 19 Metal workers and plastic workers ... 78 2 – 5 23 31
Transportation and material moving occupations ... 1,184 27 4 49 6 10
Air transportation workers ... 65 1 – – – – Motor vehicle operators ... 831 19 5 66 4 8 Water transportation workers ... 24 1 – – – – Material moving workers ... 222 5 3 9 14 21
Military occupations5 ... 67 2 – 6 6 –
1 Occupation data are based on the Standard Occupational Classification system, 2010.
2 Based on the BLS Occupational Injury and Illness Classification System (OIICS) 2.01 implemented for 2011 data forward. The figure shown is the percent of the total fatal injuries for that occupation group.
3 "Roadway" includes deaths to vehicle occupants resulting from traffic incidents that occur on the public roadway, shoulder, or surrounding area. It excludes incidents occurring entirely off the roadway, such as in parking lots and on farms; incidents involving trains; and deaths to pedestrians or other non passengers.
4 Less than or equal to 0.5 percent.
5 Includes fatal injuries to persons identified as resident armed forces regardless of individual occupation listed.
p Data for 2013 are preliminary. Revised and final 2013 data are scheduled to be released in spring 2015.
Note: Totals for major categories may include subcategories not shown separately. Percentages may not add to totals because of rounding. Dashes indicate no data reported or data that do not meet publication criteria. CFOI fatality counts exclude illness-related deaths unless precipitated by an injury event. There were two fatal injuries for which there was insufficient information to determine a specific occupation classification.
Source: U.S. Department of Labor, Bureau of Labor Statistics, in cooperation with state, New York City, District of Columbia, and federal agencies, Census of Fatal Occupational Injuries
Table 4. Fatal occupational injuries by selected worker characteristics and selected event or exposure, 2013p
Characteristic
Fatal injuries Selected event or exposure1 (percent of total for characteristic category)
Number Percent Homicides Roadway2 Falls, slips, trips
Struck by object or equipment
Total ... 4,405 100 9 22 16 11
Employee status
Wage and salary3... 3,513 80 8 25 15 11 Self-employed4... 892 20 13 11 18 15
Gender5
Male ... 4,101 93 8 22 16 12 Female ... 302 7 22 26 12 5
Age6
Under 16 years ... 5 (7) – – 20 – 16 to 17 years ... 9 (7) – – 11 – 18 to 19 years ... 53 1 13 26 – 11 20 to 24 years ... 268 6 11 21 10 13 25 to 34 years ... 754 17 12 21 11 10 35 to 44 years ... 820 19 10 22 15 10 45 to 54 years ... 1,071 24 10 23 16 12 55 to 64 years ... 890 20 7 23 19 12 65 years and over ... 534 12 4 24 23 11
Race or ethnic origin8
White (non-Hispanic) ... 2,995 68 6 24 15 11
Black or African-American (non-Hispanic) ... 414 9 24 26 11 8
Hispanic or Latino ... 797 18 8 17 22 14
American Indian or Alaska Native (non-Hispanic) ... 36 1 – 14 14 8
Asian (non-Hispanic) ... 115 3 37 12 10 4
Native Hawaiian or Pacific Islander (non-Hispanic) ... 7 (7) – – – –
Multiple races (non-Hispanic) ... 11 (7) – 27 – – Other or not reported (non-Hispanic) ... 30 1 17 27 – –
1 Based on the BLS Occupational Injury and Illness Classification System (OIICS) 2.01 implemented for 2011 data forward. The figure shown is the percent of the total fatal injuries for that demographic characteristic.
2 "Roadway" includes deaths to vehicle occupants resulting from traffic incidents that occur on the public roadway, shoulder, or surrounding area. It excludes incidents occurring entirely off the roadway, such as in parking lots and on farms; incidents involving trains; and deaths to pedestrians or other nonpassengers.
3 May include volunteers and workers receiving other types of compensation.
4 Includes self-employed workers, owners of unincorporated businesses and farms, paid and unpaid family workers, and may include some owners of incorporated businesses or members of partnerships.
5 There were two fatal injuries for which there was insufficient information to determine the gender of the decedent. 6 There was one fatal injury for which there was insufficient information to determine the age of the decedent. 7 Less than or equal to 0.5 percent.
8 Persons identified as Hispanic or Latino may be of any race. The race categories shown exclude Hispanic and Latino workers.
p Data for 2013 are preliminary. Revised and final 2013 data are scheduled to be released in spring 2015.
Note: Totals for major categories may include subcategories not shown separately. Percentages may not add to totals because of rounding. Dashes indicate no data reported or data that do not meet publication criteria. CFOI fatality counts exclude illness-related deaths unless precipitated by an injury event.
Source: U.S. Department of Labor, Bureau of Labor Statistics, in cooperation with state, New York City, District of Columbia, and federal agencies, Census of Fatal Occupational Injuries
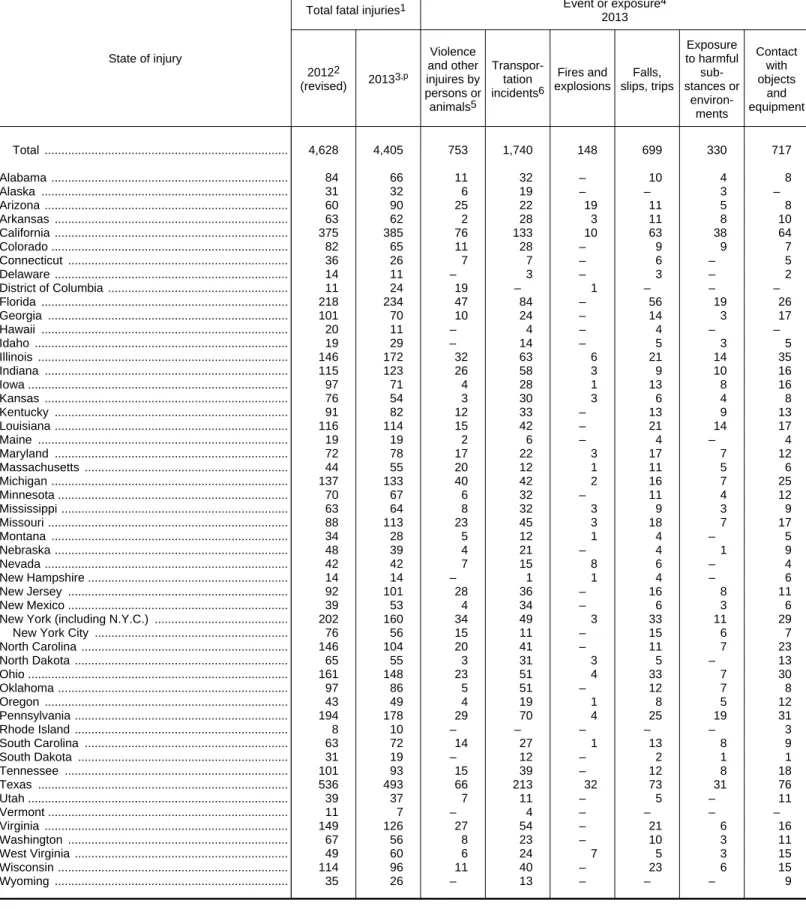
Table 5. Fatal occupational injuries by state and event or exposure, 2012-2013
State of injury
Total fatal injuries1 Event or exposure4
2013
20122
(revised) 20133
,p Violence and other injuires by persons or animals5 Transpor-tation incidents6 Fires and explosions Falls, slips, trips Exposure to harmful sub-stances or environ-ments Contact with objects and equipment
Total ... 4,628 4,405 753 1,740 148 699 330 717
Alabama ... 84 66 11 32 – 10 4 8
Alaska ... 31 32 6 19 – – 3 –
Arizona ... 60 90 25 22 19 11 5 8
Arkansas ... 63 62 2 28 3 11 8 10
California ... 375 385 76 133 10 63 38 64
Colorado ... 82 65 11 28 – 9 9 7
Connecticut ... 36 26 7 7 – 6 – 5
Delaware ... 14 11 – 3 – 3 – 2
District of Columbia ... 11 24 19 – 1 – – –
Florida ... 218 234 47 84 – 56 19 26 Georgia ... 101 70 10 24 – 14 3 17
Hawaii ... 20 11 – 4 – 4 – –
Idaho ... 19 29 – 14 – 5 3 5
Illinois ... 146 172 32 63 6 21 14 35 Indiana ... 115 123 26 58 3 9 10 16 Iowa ... 97 71 4 28 1 13 8 16
Kansas ... 76 54 3 30 3 6 4 8
Kentucky ... 91 82 12 33 – 13 9 13
Louisiana ... 116 114 15 42 – 21 14 17
Maine ... 19 19 2 6 – 4 – 4
Maryland ... 72 78 17 22 3 17 7 12
Massachusetts ... 44 55 20 12 1 11 5 6
Michigan ... 137 133 40 42 2 16 7 25
Minnesota ... 70 67 6 32 – 11 4 12
Mississippi ... 63 64 8 32 3 9 3 9
Missouri ... 88 113 23 45 3 18 7 17
Montana ... 34 28 5 12 1 4 – 5
Nebraska ... 48 39 4 21 – 4 1 9
Nevada ... 42 42 7 15 8 6 – 4
New Hampshire ... 14 14 – 1 1 4 – 6
New Jersey ... 92 101 28 36 – 16 8 11
New Mexico ... 39 53 4 34 – 6 3 6
New York (including N.Y.C.) ... 202 160 34 49 3 33 11 29
New York City ... 76 56 15 11 – 15 6 7
North Carolina ... 146 104 20 41 – 11 7 23
North Dakota ... 65 55 3 31 3 5 – 13
Ohio ... 161 148 23 51 4 33 7 30
Oklahoma ... 97 86 5 51 – 12 7 8
Oregon ... 43 49 4 19 1 8 5 12
Pennsylvania ... 194 178 29 70 4 25 19 31
Rhode Island ... 8 10 – – – – – 3
South Carolina ... 63 72 14 27 1 13 8 9
South Dakota ... 31 19 – 12 – 2 1 1
Tennessee ... 101 93 15 39 – 12 8 18
Texas ... 536 493 66 213 32 73 31 76 Utah ... 39 37 7 11 – 5 – 11
Vermont ... 11 7 – 4 – – – –
Virginia ... 149 126 27 54 – 21 6 16
Washington ... 67 56 8 23 – 10 3 11
West Virginia ... 49 60 6 24 7 5 3 15
Wisconsin ... 114 96 11 40 – 23 6 15
Wyoming ... 35 26 – 13 – – – 9
1 State totals include other events and exposures, such as bodily reaction, in addition to those shown separately.
2 Totals for 2012 are revised and final. Preliminary 2012 data issued August 22, 2013, reported a total of 4,383 fatal work injuries for calendar year 2012. Since then, an additional 245 job-related fatal injuries were identified, bringing the total job-related fatal injury count for 2012 to 4,628. Includes zero fatal injuries that occurred within the territorial boundaries of the United States, but a State of incident could not be determined.
3 Includes three fatal injuries that occurred within the territorial boundaries of the United States, but a State of incident could not be determined. 4 Based on the BLS Occupational Injury and Illness Classification System (OIICS) 2.01 implemented for 2011 data forward.
5 Includes violence by persons, self-inflicted injuries, and attacks by animals.
6 Includes highway, nonhighway, air, water, and rail fatal injuries, and fatal injuries resulting from being struck by a vehicle.
p Data for 2013 are preliminary. Revised and final 2013 data are scheduled to be released in spring 2015.
Note: Dashes indicate no data reported or data that do not meet publication criteria. CFOI fatality counts exclude illness-related deaths unless precipitated by an injury event.
Source: U.S. Department of Labor, Bureau of Labor Statistics, in cooperation with state, New York City, District of Columbia, and federal agencies, Census of Fatal Occupational Injuries
13 Table 6. CFOI participating agencies and telephone numbers
State Agency Telephone number
Alabama Department of Labor (334) 242-3463
Alaska Department of Labor and Workforce Development (907) 465-4539
Arizona Industrial Commission (602) 542-3737
Arkansas Department of Labor (501) 682-4542
California Department of Industrial Relations (626) 472-6862 ext. 5443
Colorado Department of Public Health and Environment (303) 692-2970
Connecticut Department of Labor (860) 263-6291
Delaware Department of Labor (302) 761-8219
Dist. of Columbia Department of Health (202) 442-9010
Florida Bureau of Labor Statistics - Atlanta Region (404) 893-8339
Georgia Office of Insurance and Safety Fire Commissioner (404) 463-0735
Hawaii Department of Labor and Industrial Relations (808) 586-9002
Idaho Department of Labor (208) 332-3570 ext. 3220
Illinois Department of Public Health (312) 814-5278
Indiana Department of Labor (317) 232-2668
Iowa Division of Labor Services (515) 281-5151
Kansas Department of Labor (785) 296-5000 ext. 2595
Kentucky Labor Cabinet (502) 564-4136
Louisiana Workforce Commission (225) 342-7568
Maine Bureau of Labor Standards (207) 623-7907
Maryland Division of Labor and Industry (410) 527-4463
Massachusetts Department of Public Health (617) 624-5632
Michigan Department of Licensing and Regulatory Affairs (517) 322-1851
Minnesota Department of Labor and Industry (651) 284-5568
Mississippi Department of Health (601) 206-8247
Missouri Department of Labor and Industrial Relations (573) 751-2663
Montana Department of Labor and Industry (406) 444-3297
Nebraska Workers' Compensation Court (402) 471-3547
Nevada Division of Industrial Relations (702) 486-9197
New Hampshire Division of Vital Records Administration (603) 271-4647
New Jersey Department of Health (609) 826-4984
New Mexico Occupational Health and Safety Bureau (505) 476-8702
New York State Department of Health (518) 402-7900
New York City Department of Health and Mental Hygiene (646) 632-6729
North Carolina Department of Labor (919) 733-0337
North Dakota Bureau of Labor Statistics - Chicago Region (312) 353-7253
Ohio Department of Health (614) 644-0135
Oklahoma Department of Labor (405) 521-6858
Oregon Department of Consumer and Business Services (503) 947-7838
Pennsylvania Department of Health (717) 783-2548
Rhode Island Department of Health (401) 222-2804
South Carolina Department of Labor, Licensing, and Regulation (803) 896-7673
South Dakota Bureau of Labor Statistics - Chicago Region (312) 353-7253
Tennessee Department of Labor and Workforce Development (615) 741-1749
Texas Dept. of Insurance, Div. of Workers' Compensation (512) 804-5020
Utah Labor Commission, Statistics Program (801) 530-6926
Vermont Department of Labor (802) 828-5985
Virginia Department of Labor and Industry (804) 786-1035
Washington Department of Labor and Industries (360) 902-5510
West Virginia Bureau of Labor Statistics - Philadelphia Region (215) 861-5637
Wisconsin State Laboratory of Hygiene (608) 221-6293
Wyoming Department of Workforce Services (307) 473-3810
Guam Department of Labor (671) 300-6339
Puerto Rico Negociado de Estadisticas (787) 754-5353 ext. 3056
14
TECHNICAL NOTES
Identification and verification of work-related fatalities
In 2013, there were 7 cases included for which work relationship could not be independently verified; however, the information on the initiating source document for these cases was sufficient to determine that the incident was likely to be job-related. Data for these fatalities were included in the Census of Fatal Occupational Injuries (CFOI) counts. An additional 46 fatalities submitted by states were not included because the source documents had insufficient information to determine work relationship and could not be verified by either an independent source document or a follow-up questionnaire. States may identify additional fatal work injuries after data collection closeout for a reference year. In addition, other fatalities excluded from the published count because of insufficient information to determine work relationship may subsequently be verified as work related. States have up to 7 months from this release to update their initial published state counts. This procedure ensures that fatal
occupational injury data are disseminated as quickly as possible and that legitimate cases are not excluded from the revised counts.
Thus, each year's initial release of data should be considered preliminary. Revised data are released in the late spring of the following year; revised counts for 2013 will be available in 2015.
Federal/State agency coverage
The Census of Fatal Occupational Injuries includes data for all fatal work injuries, whether the
decedent was working in a job covered by the Occupational Safety and Health Administration (OSHA) or other federal or state agencies or was outside the scope of regulatory coverage. Thus, any
comparison between the BLS fatality census counts and those released by other agencies should take into account the different coverage requirements and definitions being used by each agency.
Acknowledgements
BLS thanks the participating states, New York City, the District of Columbia, Puerto Rico, the U.S. Virgin Islands, and Guam for their efforts in collecting accurate, comprehensive, and useful data on fatal work injuries. BLS also appreciates the efforts of all federal, state, local, and private sector entities that provided source documents used to identify fatal work injuries. Among these agencies are the Occupational Safety and Health Administration; the National Transportation Safety Board; the U.S. Coast Guard; the Mine Safety and Health Administration; the Office of Workers’ Compensation
Programs (Federal Employees’ Compensation and Longshore and Harbor Workers’ Compensation divisions); the Federal Railroad Administration; the National Highway Traffic Safety Administration; state vital statistics registrars, coroners, and medical examiners; state departments of health, labor and industries, and workers’ compensation agencies; state and local police departments; and state farm bureaus.
Information in this release is available to sensory-impaired individuals. Voice phone: (202) 691-5200; Federal Relay Service: (800) 877-8339.