RISK ANALYSIS
MODULE 3, READING 2
Flood Vulnerability Analysis
By Dr. Heiko Apel
This document is meant to supplement the contents of session 2 “Flood Vulnerability Analysis” of the Flood Risk Analysis module. In this reading the important step of collection of data on the elements at risk and their mapping is treated (i.e. the exposure), as well as basics for the establishment of loss models (i.e. the susceptibility), the second important step in vulnerability analysis. The reading is based on experiences collected within the European Union and published by the European Exchange Circle on flood Mapping (EXCIMAP) in the “Handbook on good practices for flood mapping in Europe”.
Contents
1 Mapping the elements at risk ...1
1.1 Map’s contents ...1
1.2 Map use ...2
1.3 Scale considerations...3
2 Estimating susceptibility to floods – flood loss models ...3
2.1 Loss data collection ...3
2.2 Derivation of loss models...4
3 Further recommended readings/resources ...6
1 Mapping the elements at risk
Mapping the elements at risk means to provide spatial information (vulnerability parameters) such as population, assets and economic activity, and environmental issues, potentially affected by a flood. By the mapping procedure the assessment of the exposure of the elements to floods can by assessed in GIS framework.
1.1 Map’s contents
Population
• Distribution of population (either people per municipality, postal code or address/building, or average number of people per building/property depending on the scale of the analysis)
• Distribution of particular vulnerable groups (homes for the elderly, location of schools, hospitals, sports facilities, other infrastructure with concentration of people; concentration of tourists)
• Distribution and type of buildings (as indicator for population affected, for micro-scale studies) • Social vulnerability. Just recently used in flood risk assessments and to be determined for each region. An Example from England: Here the social vulnerability is expressed using a Social Flood Vulnerability Index (SFVI) based on three social groups (long-term sick, single parents, elderly) and four indicators for economic conditions (unemployment, overcrowding, car ownership, non-home ownership). Social vulnerability is given in four classes: very high, high, medium, low.
• Any other vulnerable group that might be of interest for particular states.
Assets and economic activity
• Criteria may help identify the economic activities
- Susceptibility to direct flood damage – type of industry, products, storage
- Impact of damage on economy – production interruption, trade interruption, potential (temporary) unemployment
- Agriculture: fresh water or saline flooding, susceptibility of major crops to inundation duration and depth, seasonality, locations of large livestock production (for livestock evacuation plans and assessment of potential ecological damage)
• Land use:
- residential areas: metropolitan, urban, rural, recreation
- essential services and infrastructure: roads, electricity, telephone, gas, sewer, water supply, hospitals, schools, fire brigade, railway, airport, harbors, cultural heritages, sports facilities
- special economic zones: industrial, commercial service - agricultural land, forest, mangroves, protected areas
Potentially affected installations causing pollution
A non-exhaustive list of installations of interest in this regard are: • Chemical industry and respective warehouses
• Petroleum industry and storage facilities for oil products • Thermo-electric power stations: oil, gas, coal, nuclear • Fuel/gas stations
• Agricultural warehouses for fertilizers, herbicides, pesticides, poisonous substances, nutrients • Special dump sites for chemical or industrial waste
• Waste water treatment plants
Not to forget are the potential impacts of flooded installations on particular environmental assets, such as:
Environmental assets
• Potential damage to habitat and wildlife • Uniqueness of the habitat and rarity of wildlife
• National parks and other protected areas like wetlands, virgin forest, etc. 1.2 Map use
• Basic product to determine damage and risks • Emergency management
• Flood expert (planning of flood defense measures) • Land-use planning and land management
• On small scale (large areas): priority setting
• Insurance industry (insurance policy calculation, potential maximum loss estimations) 1.3 Scale considerations
• Overview information on village and town level. On large areas only the approximate population per municipality, village, or town can be represented. Scale is of the order of 1:100,000 to 1:500,000. Appropriate for large flood plains.
• Broad-scale infrastructure like road or rail network, or agriculture and forestry may use small to medium scales (1:100,000 to 1:250,000)
• Detailed information about individual buildings, social structures or social groups or about individual facilities require maps with a large scale (1:5,000 to 1:25,000; city or village plan).
2 Estimating susceptibility to floods – flood loss models
Estimating the susceptibility to floods for the elements at risk is a vital aspect in flood risk assessment. However, it is also the most difficult, resp. uncertain task. This is caused by the multitude of elements at risk all differently susceptible, the lack of loss data to base the assessment on, the lack of appropriate loss models, and the region specific character of the both the elements at risk and their susceptibility. While the first and the last aspect are unavoidable, efforts can and should be undertaken to establish a sound database on flood losses and appropriate loss models.
2.1 Loss data collection
Loss data can only be collected after a flood event. This is the main reason why they are hardly available: significant flood events are rare and in the aftermath of such an event the disaster management usually consumes all resources. However, a reliable data base on flood damages is the basic prerequisite for assessing susceptibility to floods. Therefore some basic guidelines on the collection of flood loss data are given in the following:
Loss data collection can be done either directly by inspection at the damage location or indirectly by telephone or internet questionnaires. In both cases details about the data collection have to be collected in a Meta-database associated to the loss data. The actual loss data should meet the following criteria in order to ensure usability and comparability of the data:
• Information on the event
• Information on the damage (sector specific)
• Information on the object, i.e. element at risk (sector specific) • Information on damage reducing measures (sector specific) Information on the event – minimum requirements
• Duration of flood impact on object • Timing of flood warning, if any
• Inundation type (according to flood types listed in flood hazard assessment session) • Name of the stream/water body causing inundation
• Specific damage influencing circumstances (dike breaches, backwater effects by bridge
congestion or ice accumulation, etc.)
• Water level at object, affected storeys • Contaminations
Information on the damage / Information on object – minimum requirements
Damage information has to be collected according to the elements at risk. Therefore they are listed here in combination, as well as they are collected in combination in practice. Within each class of risk elements usually different sectors have to be distinguished. For example, damage to buildings has to be separated into damage to residential buildings, industrial and commercial buildings, public buildings etc. In the following the minimum criteria for residential buildings as the most frequent buildings are given:
• Value of the whole building (reconstruction costs, or market value depending on aim of analysis
or if differing considerably)
• Monetary damage of the building OR structural damage degree • Value of whole building contents (replacement costs)
• Monetary damage of contents OR degree of content damage • Location of object
• Building type (deducted from usage, construction, floor area, number of storeys, cellar, building
year/period)
• Standard of content (poor to luxury) • Usage of cellar, if any
Information on damage reducing measures – minimum requirements • Measures taken (permanent, temporary, other)
• If taken, efficiency of the measures
• Reaction time after waning/flood perception
This list encompasses the minimum requirements for a standardized data collection for residential buildings. Meeting these criteria will ensure usefulness and comparability. The list, however, can, and in some cases must, be extended according to the problem at hand. Different criteria have to be met in case of different elements at risk. Only the event criteria remain the same.
2.2 Derivation of loss models
On the basis of a flood loss data set collected according to the criteria above loss models describing the susceptibility can be derived. Loss models can be fundamentally distinguished between absolute loss models and relative loss models. Absolute loss models estimate the loss from a given impact directly in monetary or other tangible terms. On the contrast relative damage models estimate the degree of damage. The actual damage value is derived in a second step by combining the relative damage with the value of the object. In general relative loss models are to be preferred, because they are more flexible, easier to adjust to economic/value developments and transferable to regions with comparative types of risk elements, but different values. For developing relative loss models the relative damage has to be recorded, see below.
The first step in the development of a loss model is the determination of the damage influencing factors. This is typically done by correlation analysis and other multivariate statistical methods of the collected loss data. For this purpose a classification or encoding of the impact factors may be required. E.g. inundation depth can be classified according to damage thresholds, or the standard of building contents has to be coded from poor and luxury to 0 and 5 respectively. An example for this procedure is the loss model FLEMO (Flood Loss Estimation MOdel) developed by the GFZ, the German Research Centre for Geoscience. Here, amongst others, loss data of residential buildings from several flood events mostly in low lying areas in Germany were analyzed. The most damage influencing factor was, as expected, the inundation depth, but also contamination (usually by oil tanks installed in the basement) and precautionary measures proved to have significant impacts on the flood loss.
Damage model
After the identification of the influencing factors, a damage model can be established. There are several ways to do this. The most common way are damage functions relating the most important impact factor to absolute or relative damages. If several impact factors were identified, as in the example above, multivariate damage functions have to be created. This can be difficult, because many of the impact factors are not continuous but discrete. In this case rule based approaches as FLEMO are more appropriate. Rule based models are easier to establish and more suitable for considering the many possible combinations of impact factors. For example, FLEMO estimates losses in a two-tier approach: first the relative loss is determined by the inundation depth. In a second step, the loss degree is modified according to potential contamination and precautionary measures taken.
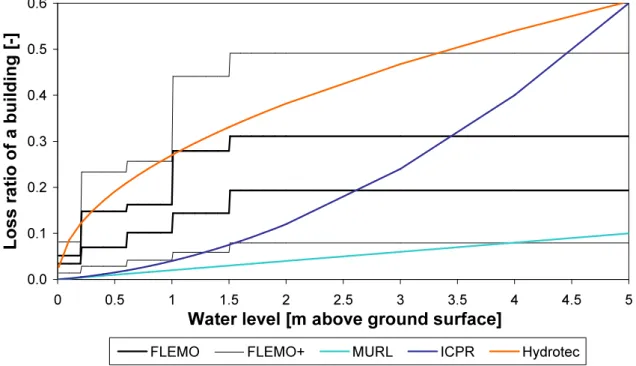
Figure 1 gives an example of different damage functions relating damage to inundation depths developed in Germany compared to FLEMO. The rule based approach and the classification of inundation depths yields a step-function. The wide range of damage degrees predicted for a single water level illustrates the uncertainties in the damage estimation and thus the risk assessment. Therefore it has to be strongly emphasized to base the risk assessment on a sound damage data base and a calibrated and validated loss model.
Figure 1: Different damage function in use in Germany (MURL, ICPR, Hydrotec) and the rule based damage model FLEMO. The two back lines for FLEMO show the upper and lower range for different
building types with inundation depth as the only impact factor. The dotted FLEMO+ lines show the upper and lower range considering contamination and precaution additionally.
3 Further recommended readings/resources
This reading is based on the “Handbook of good practices for flood mapping in Europe” developed by the European exchange circle on flood mapping (EXCIMAP). The handbook and the Annexes contain some additional information than presented here and can be accessed at:
http://ec.europa.eu/environment/water/flood_risk/flood_atlas/
ISDR (2009) Guidelines for reducing flood losses, UNESCO International Strategy for Disaster Reduction, Geneva. (http://www.unisdr.org/eng/library/Literature/8689.pdf)
Penning-Rowsell, E., Floyd, P., Ramsbottom, D. and Surendran, S. (2005) Estimating Injury and Loss of Life in Floods: A Deterministic Framework. Natural Hazards, 36(1 - 2): 43-64
Penning-Rowsell, E., Johnson, C. and Tunstall, S. (2005) The benefits of flood and coastal risk
management - a handbook of assessment techniques. ISBN 1-904750-51-6, Flood Hazard Research Centre, Middlesex Univ. Press, London.
Thieken, A.H., Seifert, I. and Merz, B. (2009) Hochwasserschäden - Erfassung, Abschätzung und
Vermeidung. oekom, München, 301 pp. (Flood damages – collection, assessment and prevention, in German)
http://www.floodsite.net⇒ Results and guidance to various flood risk aspects developed in the EU FP6