THE TIE THAT BINDS: AN EXAMINATION OF THE RELATIONSHIP BETWEEN FAN MOTIVATIONS AND SPONSORSHIP RECOGNITION AMONG COLLEGE
SPORT CONSUMERS
Laniesa Shafer
A thesis submitted to the faculty of the University of North Carolina at Chapel Hill in partial fulfillment of the requirements for the degree of Master of Arts in the
Department of Exercise and Sport Science (Sport Administration).
Chapel Hill 2013
Approved By:
Richard Southall, Ed.D. Edgar Shields, Jr., Ph.D.
ABSTRACT
LANIESA SHAFER: The Tie That Binds: An Examination of the Relationship Between Fan Motivations and Sponsorship Recognition Among College Sport
Consumers
(Under the direction of Richard M. Southall, Ed.D.)
ACKNOWLEDGEMENTS
TABLE OF CONTENTS
LIST OF TABLES ... vi
CHAPTER I. INTRODUCTION ... 7
Statement of Purpose ... 9
Research Questions ... 9
Hypothesis Statement ... 10
Hypothesis ... 10
Assumptions ... 10
Delimitations ... 11
Limitations ... 11
Definition of Terms ... 11
Significance of Study ... 11
II. REVIEW OF LITERATURE ... 12
Sport Sponsorship ... 12
Fan Avidity ... 14
Spectator Motives ... 17
Identification: Points of Attachment ... 20
Relationship between Motives and Identification ... 21
III. METHODOLOGY ... 23
Instrumentation ... 23
Variables ... 26
Data Collection Procedures ... 26
Data Analysis ... 27
IV. RESULTS ... 28
Description of Sample ... 28
Baseball-MSSC ... 29
Women’s Basketball-MSSC ... 31
Baseball-PAI ... 33
Women’s Basketball-PAI ... 34
Baseball-Sponsor Recognition ... 36
Women’s Basketball-Sponsor Recognition ... 38
V. DISCUSSION ... 41
Limitations and Future Research ... 44
APPENDICES ... 47
LIST OF TABLES
Table
1. Demographics ... 29
2. MSSC – Baseball – Male ... 30
3. MSSC – Baseball – Female ... 31
4. MSSC – Women’s Basketball – Male ... 32
5. MSSC – Women’s Basketball – Female ... 33
6. PAI – Baseball – Male ... 34
7. PAI – Baseball – Female ... 34
8. PAI – Women’s Basketball – Male ... 35
9. PAI – Women’s Basketball – Female ... 35
10. Sponsor Recognition – Baseball – Male ... 37
11. Sponsor Recognition – Baseball – Female ... 38
12. Sponsor Recognition – Women’s Basketball – Male ... 39
Chapter I
INTRODUCTION
In mid-2012, the University of Maryland athletics department announced it was planning to eliminate seven of its 27 varsity sport teams. The main reason cited for the cuts was budget issues (Clarke 2012). The issue facing Maryland is not exclusive to them, however. Many other programs have had threats or have had to cut teams, such as the University of California-Berkeley and the Massachusetts Institute of Technology.
One of the beliefs about collegiate athletics is that programs make a lot of money from television contracts, fundraising, and ticket sales. However, according the latest research from USA Today, only 22 of 227, or 10 percent, of public
universities in NCAA Division I reported a profit in 2011 (Upton, Berkowitz 2012). While rising tuition costs result in increased grant-in-aid expenses, Maryland’s largest single expense item coaching staff salaries (Schnaars, Upton et al. 2012). The problem with spending does not seem to be ending either. With the dominance of Men’s Basketball and Football, keeping up with the “Arms Race” in collegiate athletics will continue the spending and heavily affect the athletics budget (Clarke 2012).
technically profited an amount of $2,829, up $6,972,837 from the year before. However, when compared to fellow Atlantic Coast Conference (ACC) school the University of North Carolina-Chapel Hill, they are well behind in their revenue with UNC-CH making $13,971,482 more in 2011. A closer look at Maryland’s budget for 2011 reveals that the school’s main revenue came from rights and licensing
agreements with $19 million dollars, followed by ticket sales and contributions by donors, both bringing in around $10 million dollars each (Schnaars, Upton et al. 2012). With state funds (in Maryland’s case, a little over $6 million dollars) barely bringing in any money compared to the other categories, sponsorship
rights/licensing has become a lucrative option for athletic departments when trying to raise money to offset their high expenses.
Maryland is just an example of the many programs facing tough battles to balance their budget and sustain all of their sports. Because of this issue, many NCAA D-I athletic departments have begun to rely on sport sponsorship revenue in order to help offset expenses. In Maryland’s case, their rights brought in over $19 million dollars, more than ticket sales or donations (Schnaars, Upton et al. 2012).
Since about 90% of NCAA Division I college athletics programs are operating in a deficit, corporate sponsorships are becoming more relied on to bring in
help increase revenue, brand awareness, gain new target markets, and build relationships with the customers. Sports in general provide a great opportunity to reach not only a multitude of fans, but fans of similar tastes and interests (Madrigal 2001).
Statement of Purpose
With the amount of money NCAA Division I athletic departments are losing each year, many are relying heavily on corporate sponsorships as a main revenue source. The purpose of the study is to measure the motivators and points of attachment of those that attend baseball and women’s basketball games and examine if there is relationship with sponsor recognition.
Research Questions
1. Using the factors derived from the Motivation Scale for Sport Consumption (1a-1j), what are the motivators for fans to attend the University of North Carolina at Chapel Hill (UNC-CH) baseball and women’s basketball sporting events?
a. Vicarious Achievement b. Acquisition of Knowledge c. Aesthetics
d. Drama/Eustress e. Escape
i. Novelty
j. Enjoyment of Aggression
2. Using the factors derived from the Points of Attachment Index (PAI) scale (2a-2g), what are the points of attachment of fans that inspire them to attend UNC-CH baseball and women’s basketball sporting events?
a. Players b. Team c. Coach d. Community e. Sport f. University g. Level of Sport Hypothesis Statement
Null: There is a not significant relationship between fan motivations and sponsor recognition.
Hypothesis
The more avid the fan (in terms of years of attending games), the greater the ability to correctly identify sponsors.
Assumptions
1. It is assumed that respondents were truthful and accurate in their survey responses.
Delimitations
1. This study is only representative of one NCAA Division I institution and may not be representative of every institution.
2. This study only sought responses from spectators at three games for two sports.
Limitations
1. Survey respondents may not be a representative sample of the Division I population.
2. Due to the voluntary nature of the survey and the resulting response rate, there may be a non-response bias.
3. Due to the survey only being taken at one Division I institution, there may be a response bias.
Definition of Terms
Fan Avidity: the level of interest, involvement, passion and loyalty a fan has toward a
sport entity (DeSarbo 2009)
Sponsorship: a corporate investment in return for access to an exploitable property
(Madrigal 2001)
Significance of the Study
Chapter II
REVIEW OF LITERATURE Sport Sponsorship
Sport sponsorship is appealing to corporations because fans tend to be highly loyal to their teams, and think highly of a sponsor when they are associated with their favorite team (Dees, Bennett et al. 2008). Because of this, a sponsor might use an association with a sports team to change or develop their brand image (Gwinner, Eaton 1999). Sport sponsorship was originally supposed to be an exclusive outlet to which sponsors could have a targeted market and uncluttered advertising (Mullin, Hardy et al. 2007). However, with increasing athletic-department budgets, corporate sponsor revenue has become an option for athletic departments to consider. Long-term sponsorships especially can be beneficial as they can provide a steady stream of revenue (Dees, Bennett et al. 2008). Because of this, more signage is being placed in arenas. The accessible advertising of the old has now become largely expansive and has created clutter, or a large amount of advertising in one
concentrated area, which is something fans can easily tune out (Maxwell, Lough 2009).
Stoelinga (1992) defined sponsorship with a sport as an association in order to have their brand name mentioned in some form. Sport sponsorship has increased greatly because the communication to a target market is easier than other mediums. Meenaghan (1998) believes that sport sponsorship will only continue to grow
because of the value it provides sponsors.
However, sponsorship is not all about the exchange of money; quite often it’s an opportunity for companies to reach the hearts and minds of consumers (Nicholls, Roslow et al. 1999). Especially in sports, where emotions run high, having an association with a team can prove beneficial for a sponsor when building brand equity. Aside from the financial reasons, sponsors also pursue entities for to boost community involvement, build relationships, and create goodwill (Dolphin 2003).
Since fans are exposed to numerous advertisements each day, as well as during sport events, insuring fans’ sponsor recognition of sponsors is very important to both athletic departments and their corporate partners. As a result, measuring the recognition rates of fans at athletic events has become an important part of
association with a sponsor. This especially happens when the advertisement is presented at a sporting event, which many fans attend for pleasure and
entertainment (Pitts, Slattery 2004). With successful recognition, sponsors are indeed having a return on their investment.
Fan Avidity
One reason many corporations are heavily involved with sport events is because fans of a particular sport or league often have many similar demographic and psychographic characteristics, making it easier and cost effective for sponsors to reach a “target audience.” Also, one of the reasons for targeting sports fans is the theory of fan avidity, or the level of interest, involvement, passion and loyalty a fan has towards a sports entity (DeSarbo 2009). For marketers, avid fans make their jobs easier when trying to push products from corporations or promotions for events.
DeSarbo (2009) believed that there are four different dimensions of fan
avidity. Dimension I involves on-field participants, such as cheerleaders, dance-team members, team players, and stadium workers. Dimension II describes more passive fans who listen to games on radio, watch it on television, or read about it in a
newspaper, and rarely attend a game. Dimension III describes fans that may attend many games, may purchase items such as merchandise, and often become
members of a booster club. Dimension IV describes a fan who purchases season tickets, attends both home and away games, tailgates, and attends postgame parties.
have an allegiance to a specific team or athlete. Wann (2006) believed that such allegiance positively effects fans’ social psychological health. Because other fans support a team, an individual fan develops a sense of inclusion and it increases their social identity (Wann 2006). As a result, sport allows fans to experience “something grander than themselves,” that doesn’t require any special skill set or knowledge (Branscombe, Wann 1991). Even if a fan does not know the person next to him at a game, he may feel as though they have a connection, which improves his self-esteem. Because of this, highly avid fans tend to believe their team’s successes or failures are their own (Kim 2009).
Wann (2006) found that team identification was based upon psychological, environmental, and team-related factors. Psychological factors included needs for belonging and affiliation. The environmental factors include influences from parents, family and friends, and peers. Team-related reasons include team performance, player attributes, and organizational characteristics, such as ownership and the tradition of the team (Wann 2006). Wann (2006) also noted that only after a fan develops a sense of “belongingness” with a team would a significant level of identification and associated effects occur.
The positive meanings of team identification often translate to sponsors through association. Recent research (Kim, 2009) suggested that the more “attractive” a team is (in terms of winning or tradition) the greater its fan identification, which increases associated sponsor identification, leading to
heightened sponsor image. An important aspect of team identification is that it often encourages increased fan attendance, which allows fans to easily recognize the sponsor. Kim (2009) hypothesized that team identification leads to sponsorship identification, which leads to heightened sponsor image.
In general, having a high degree of brand loyalty is one of the greatest assets a marketer can possess (Funk, Pastore 2000). Coca-Cola, for example, is a product that most consumers choose as their favorite soft drink at a young age. The
beverage stays the same their entire lives, and their offspring will likely have the same feelings toward the brand. Brand loyalty then becomes a key determinant in brand equity. Building brand allegiance is important for sponsors. Funk and Pastore (2000) hypothesized that loyal consumers of a sport brand will shift their allegiance to the products and services promoted by corporate American during these events (Funk, Pastore 2000). While this might not ring true for older audiences, the younger fans tastes can be molded in order to favor a particular sponsor associated with the athletic program.
percent of his sample, are “social butterflies” and consider the social interaction aspect when consuming sport. Game attendance is important to this segment, as well as purchasing merchandise and memorabilia. Market Segment 2 in DeSarbo’s study were more “passive followers,” or 32 percent of the sample. These members were still interested in the social aspect, but detach themselves by watching the game on television, reading about it in the newspaper or online, or listening on radio. Market segment 3 was 23 percent of the sample and these members are most often those on the field participating during the game, such as players and cheerleaders. Overall, these market segments are similar to DeSarbo’s (2009) four dimensions, with descriptions of devout ticket purchasers and merchandise buyers to those actually on the field participating. From a marketing perspective, the distinction between a fan and a spectator is crucial. Trail, Robinson et al. (2003) looked at the motives and points of attachment that converted a spectator into a fan and
developed a seven-point scale for each. Spectator Motives
The scale was developed after Trail and James considered past scales fragile and wanted to create a more valid instrument. Participant motives have been
researched dating all the way back to Maslow’s (1943) hierarchy of needs and were brought up again in the work of Sloan (1989). Because of the growing interest in sport throughout history, understanding the consumer can immensely help
marketers and businesses associated with sport to make sound business decisions. A sport fan motivation scale was developed by Wann (1995), in an attempt to answer the age-old question: “Why do fans attend games?” However, Trail and James found this scale to be ineffective because it was never explained how such motives were generated. Trail and James questioned the motives since it never explained if any advice was included from a panel of experts. They also questioned the validity of the statistical procedures used and were not pleased with the scale developed in Wann’s research. When taking a look at Milne and McDonald’s (1999) Motivations of the Sport Consumers scale, they found that it had questionable
statistical goodness of fit tests and asked questions not pertinent to spectators, such as asking about stress reduction, which usually happens with the participants on the field and not spectators. Lastly, Trail and James examined Kahle et al. (1996) Fan Attendance Motivations (FAM) scale, which once again checked out with
questionable statistical procedures and questions. The FAM scale took a page from Kelman’s (1958) theory of influence, but the scale left out many portions of this scale in favor of their own intentions in the results.
important as a foundation for another, more valid scale. They developed the MSSC after consideration of the previous scales, sport sociology literature and evaluation from a panel of experts. The original motives in the MSSC are achievement, acquisition of knowledge, aesthetics, drama/eustress, escape, family, physical attractiveness of participants, the quality of the physical skill of the participants and social interaction. Since its creation the MSSC has been modified slightly to remove the “family” variable, since it is thought of as a by-product and not a factor (Trail 2012). New items filed under “vicarious achievement” have been added to the MSSC scale and were deemed valid in a recent study by Trail and Kim (2011), which had a high alpha coefficient. Overall, the internal consistency of the MSSC has been good with a number of the samples generating alpha values of α > .70, which is more desirable. For the factors and their alpha levels, Trail defined and found that vicarious achievement was a self-esteem builder that one can gain from an association with a team with a α of .85-.89. Acquisition of knowledge is the need to learn about the team or players through consumption, which returned a α of .80-.92. Aesthetics is the beauty of the sport and had a α of .87-.89. Drama/eustress is the stress or stimulation gained from the event with a α .75-.82. Escape is the need to find a diversion from ordinary life and returned a α of .72-.85. Physical
In the original study, the MSSC was administered to season ticket holders of a major league baseball team in all levels of seating so they could target various economic levels of fans. After administering the survey, Trail and James found their scale effective in terms of construct and criterion validity and reliable based on alpha coefficients.
After the MSSC was developed in 2001, it has been used it in many other studies such as looking at differences between male and female spectators (James, Ridinger 2002), motives of golf spectators (Robinson, Trail et al. 2004), hockey spectators (Lee, Trail et al. 2009) and women’s basketball spectators (Trail,Galen T., Kim, Yu Kyoum 2011).
Identification: Points of Attachment
Alongside the MSSC, Trail et al. (2003) developed the Points of Attachment Index (PAI) that tries to identify why spectators are attached to a sport entity. Similar to the MSSC and the motives of fans, knowing the points of attachment is crucial for marketers. The PAI was developed in 2003 as an extension of a study done in 2000 that defined identification as “an orientation of the self in regard to other objects including a person or group that results in feelings or sentiments of close
identification with the players on the team has an α of .82-.87, identification with the team α= .85-.88, identification with the coach α=..84-.87, identification with the community α=.82-.84, identification with the sport α= .75-.83, identification with the university α= .69-.83, and identification with the level of sport had α= .78-.83 (Trail 2012)
Relationship between Motives and Identification
Sloan (1989) believed that fans and spectators are different in that fans most often attend games for the achievement of their favorite team while spectators attended for the skill and physicality of the players. The 2003 study also was the first time that motives and points of attachment were combined to create a theoretical model for sport consumer behavior. The study tested three different models to see which one fit best with the data. The model featured an “Overarching Motive” variable that broke into motives of escape and social interaction. The second
variable, “Vicarious Achievement” featured organizational points of attachment such as team, coach, community, university, and the players on the team. The third variable, “Spectator Motives” comprised of skill, aesthetics, drama, and knowledge. In the end, the study found that motives could be segmented into three different categories: fans of successful team, spectators of unsuccessful team, and motives that apply to both fans and spectators.
Summary
implemented to measure how effective sponsorship is. It is believed that the more avid a fan is, the more he or she will recognize a sponsor. In addition to a
Chapter III
METHODOLOGY
In order to examine the corporate sponsorship recognition rates and the fan motivations at a Division I institution, an exploratory study was conducted to provide an overview of the effectiveness. Questions regarding recognition of sponsors and the motives and points of attachment of the consumer will be answered utilizing a survey administered in Carmichael Arena and Boshamer Stadium at UNC-CH.
The populations of interest were consumers (e.g. students, alumni, season-ticket holders, single-game consumers) of baseball and women’s basketball at UNC-CH. The success and tradition of these sports was a main reason for their selection. Both are considered revenue-generating sports on the campus of UNC-CH, so it was interesting to see if varying degrees of fan motivations and sponsor recognition were present. Having two sports with differing gender participants will allow inclusion of an additional independent variable to the analysis of differences in sponsorship recognition and fan motivations.
Instrumentation
reviewing the survey, the MSSC and PAI instruments has been used in numerous studies and registered a high reliability using a Cronbach’s alpha with α > .70.
The questionnaire of 27 questions was comprised of a recognition list of sponsors plus two scales: Motivation Scale for Sport Consumption (MSSC) and the Point of Attachment Index (PAI) found in Trail, Robinson et al. (2003).
The MSSC was comprised of ten subscales: achievement,
1. acquisition of knowledge, 2. aesthetics,
3. social interaction, 4. drama/eustress, 5. escape,
6. physical attractiveness and 7. physical skill
8. novelty
9. enjoyment of aggression
The PAI comprises of seven subscales of identification: 1. players
7. the level of the sport.
This section consisted of 17 questions with each subscale having one question each and a five-item Likert scale ranging from “Strongly Disagree” (1) to “Strongly Agree” (5). Refer to Appendix for the complete MSSC and PAI
instruments.
A nine-question demographics survey was also recorded for each participant in the survey. These questions came from the Trail et. al (2003) MSSC survey and asked:
1. gender 2. age
3. marital status 4. ethnicity
5. how many games the participant attended this year 6. how long the participant has been aware of the team 7. is the participant a fan of the team
8. how long the participant was a fan of the team
9. how many games (baseball or women’s basketball) they attended last year
Confusion of which sponsors belonged to UNC-CH was essential in order for an effective sponsor recognition test.
Variables
Research questions number one and two will be answered with descriptive statistics, so there are not any variables. The independent and dependent variables for research question 3 are listed below.
Research Question 3
Independent: level of sponsorship recognition (high or low)
Dependent: The factors in both the MSSC (Vicarious achievement, acquisition of knowledge, aesthetics, drama/eustress, escape, physical attractiveness of the athletes, physical skills of the participants, social interaction) and PAI (Players, coach, team, community, sport, university, level of sport) scales.
Data Collection Procedures
Undergraduate sport administration students assisted with the distribution and collection of the questionnaire for each contest. The students were trained to obtain a representative sample at the main entrance at each stadium. In this case, the stadiums are Carmichael Arena and Boshamer Stadium at UNC-CH. Having varied representation is key in this survey to include students, season ticket holders, donors, etc. The questionnaires were on a clipboard and a pen was provided for participants to fill out the surveys, which were collected by the students upon
The surveys were conducted at three baseball and three women’s basketball games in the month of February and March of 2012. At women’s basketball, a table was set up on the concourse near the main entrance in order to promote
participation. At baseball, a table was set up inside the stadium, but still near the main entrance and team store.
Data Analysis
SPSS Version 19 was used for all data analysis. For the sponsorship recognition survey and research questions 1 and 2 (including all sections), the responses were analyzed to develop descriptive statistics, including means.
Chapter IV
RESULTS Description of Sample
There were a total of 139 respondents in this study. Women’s Basketball had more overall participants (n = 95) than baseball (n = 44). While baseball and
Table 1
Demographic Table
Baseball
Women's Basketball Gender
Male 32 31
Female 12 63
Age
18-24 1 5
25-34 3 4
35-49 10 21
50-69 27 50
70+ 4 15
Marital Status
Married 31 51
Single 12 43
Ethnicity
Black 2 22
White 41 72
Other 0 1
Baseball-MSSC
When taking a look at the breakdown of the MSSC questions just for the baseball participants, as outlined in tables 2 and 3, the important factors for males differed from females. Out of 10 factors, the males only had five factors rated a “4” or above, meaning that it was significant enough to quantify that it was an important factor for male attendees. Aesthetics (M = 4.52), skill (M = 4.45), social (M = 4.33), drama (M = 4.30) and escape (M = 4.18) were all top factors for the males. From these results, it’s evident that men prefer the technical aspects of baseball, but also enjoy the game for the social aspects and to escape from day to day life. the
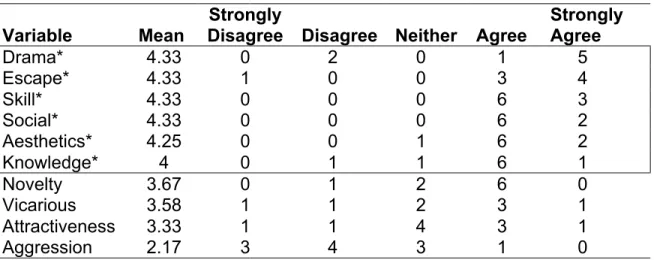
females, however, they attended baseball games more for the drama (M = 4.33) and escape (M = 4.33) factors than for the aesthetics of the game (M = 4.25). An
of knowledge (M = 4.00), meaning that women like to attend games in order to learn more about the game. It could be too that males believe that they are already
experts of the game and acquiring more knowledge is not as important to them as it was for females. The males and females agreed on the bottom two factors, the physical attractiveness of the athletes (M = 2.67 for males, 3.33 for females) and the aggression of the athletes (M = 1.94 for males, 2.17 for females). Physical
attractiveness was rated higher for females, which makes sense when watching a sport featuring the opposite sex. Aggression was also rated higher for females, with a strong statement made by the males who had more “strongly disagree” votes (n = 14) on that factor.
Table 2
MSSC Breakdown Table – Baseball - Male
Variable Mean Disagree Strongly Disagree Neither Agree Strongly Agree
Aesthetics* 4.52 0 0 1 12 16
Skill* 4.45 0 0 1 14 15
Social* 4.33 1 0 2 13 14
Drama* 4.3 0 1 3 13 13
Escape* 4.18 0 2 2 13 12
Novelty 3.94 1 0 8 10 11
Vicarious 3.88 2 2 4 13 8
Knowledge 3.52 2 1 10 14 3
Attractiveness 2.67 5 7 16 3 2
Aggression 1.94 14 11 5 2 1
Table 3
MSSC Breakdown Table – Baseball - Female
Variable Mean
Strongly
Disagree Disagree Neither Agree
Strongly Agree
Drama* 4.33 0 2 0 1 5
Escape* 4.33 1 0 0 3 4
Skill* 4.33 0 0 0 6 3
Social* 4.33 0 0 0 6 2
Aesthetics* 4.25 0 0 1 6 2
Knowledge* 4 0 1 1 6 1
Novelty 3.67 0 1 2 6 0
Vicarious 3.58 1 1 2 3 1
Attractiveness 3.33 1 1 4 3 1
Aggression 2.17 3 4 3 1 0
Note: *Significant at µ≥4
Women’s Basketball- MSSC
For women’s basketball, the males shared similar significant factors with baseball, as witnessed in tables 4 and 5. Skill, aesthetics, social interaction, and escape were still noteworthy factors as to why they attended women’s basketball games. Drama, a shared important factor with baseball, had the highest mean (M = 4.55) for males and a new factor, vicarious achievement (M = 4.26) entered the mix as an important motivation for males attending women’s basketball. Vicarious achievement measures the feeling one gets when a team does well, which is
interesting when comparing it for baseball and women’s basketball. Baseball at UNC traditionally performs better than women’s basketball, so it’s interesting that
vicarious achievement is higher for women’s basketball instead. Perhaps these fans expect wins from baseball; therefore the allure of vicarious achievement is overtaken
features women, who fans might see as an “underdog” in comparison to their male counterparts. At UNC-CH, the majority of the women’s basketball team at UNC-CH are Black/African-American, where fans might feel a sense of happiness when the minority has success. Both sexes ranked novelty (M = 3.58 for males, 3.72 for females) and aggression (M = 2.71 for males, 2.88 for females) the lowest motivations to attend a game. Novelty being ranked lower makes sense since baseball is “America’s pastime,” where anything new can turn off fans that prefer tradition. Women’s basketball had the majority of the fans in the 50+ age range, tradition and a generational gap makes sense as to why novelty was ranked low. Even though aggression had a higher mean among the females, a large number rated it as “disagree” (n = 21) when deciding if that was a factor in why they were attending that game.
Table 4.
MSSC Breakdown Table – Women’s Basketball - Male.
Variable Mean Strongly Disagree Disagree Neither Agree Strongly Agree
Drama* 4.55 0 1 0 11 15
Skill* 4.52 0 0 1 13 13
Aesthetics* 4.48 0 0 2 12 14
Vicarious* 4.26 0 2 3 10 12
Social* 4.23 2 1 1 10 13
Escape* 4.13 1 1 3 13 10
Knowledge 3.68 0 4 9 8 8
Attractiveness 3.61 1 1 11 11 5
Novelty 3.58 1 2 11 9 5
Aggression 2.71 4 9 11 5 2
Note: *Significant at µ≥4
Table 5
MSSC Breakdown Table – Women’s Basketball - Female
Variable Mean
Strongly
Disagree Disagree Neither Agree
Strongly Agree
Skill* 4.63 0 1 2 23 34
Drama* 4.61 0 1 3 14 42
Social* 4.53 0 1 2 23 34
Aesthetics* 4.52 0 0 3 25 32
Escape* 4.36 0 1 4 29 26
Vicarious* 4.13 0 3 13 19 26
Knowledge* 4.08 0 1 14 26 20
Attractiveness 3.83 0 5 20 16 21
Novelty 3.72 1 4 24 14 18
Aggression 2.88 7 21 14 16 5
Note: *Significant at µ≥4 Baseball- PAI
The PAI measures a different set of factors than the MSSC and was also featured on the survey that the participants took at baseball and women’s basketball. The PAI has seven factors, and four of them were significant for males. Identification with the team (M = 4.33), sport (M = 4.33), coach (M = 4.21), and university (M = 4.06) were the highest points of attachment for males. The same factors were important for females, however, “coach” was not significant for females. This is not the case for women’s basketball, which ranked “coach” as a significant factor. Perhaps having a male coach for baseball makes the men inspired to attend.
Identification with the players ranked the lowest factor for both males (M = 2.30) and females (M = 2.17). Even though the mean was lower for the females, the males voted stronger on the “strongly disagree” and “disagree” items for the players factor. Tables 6 and 7 highlight the significant PAI factors for baseball as well as the
Table 6
PAI Breakdown Table – Baseball - Male
Variable Mean
Strongly
Disagree Disagree Neither Agree
Strongly Agree
Team* 4.33 0 1 1 14 13
Sport* 4.33 1 1 2 8 18
Coach* 4.21 0 1 6 8 15
University* 4.06 0 1 8 11 10
Level of Sport 3.85 0 3 4 19 5
Community 3.79 0 1 9 16 5
Players 2.3 8 12 7 4 1
Note: *Significant at µ≥4
Table 7
PAI Breakdown Table – Baseball - Female
Variable Mean
Strongly
Disagree Disagree Neither Agree
Strongly Agree
Team* 4.08 0 0 3 3 2
Sport* 4 0 1 3 3 3
University* 4 0 2 1 4 3
Community 3.75 0 1 3 3 1
Coach 3.67 0 1 4 2 2
Level of Sport 3.17 0 5 0 3 2
Players 2.17 3 4 2 1 0
Note: *Significant at µ≥4
Women’s Basketball-PAI
participants in baseball. For Women’s basketball, it was significant for both sexes. One theory as to why it was ranked high in women’s basketball was that the women’s basketball coach had recently reached a coaching milestone, which
might’ve set off high emotions toward the coach. The “identification with the players” factor also ranked the lowest in women’s basketball, as it also did in baseball. With teams changing rosters every few years, it’s easy to see why fans might not attend games just for the players on the team, but instead a number of other factors.
Table 8
PAI Breakdown Table – Women’s Basketball - Male
Variable Mean
Strongly
Disagree Disagree Neither Agree
Strongly Agree
Team* 4.52 0 0 1 12 14
University* 4.32 0 1 3 12 11
Sport* 4.26 0 1 5 10 11
Coach* 4.13 1 2 3 11 10
Level of Sport 3.97 0 4 2 15 7
Community 3.77 1 2 6 14 5
Players 2.45 7 10 8 4 1
Note: *Significant at µ≥4 Table 9
PAI Breakdown Table – Women’s Basketball - Female
Variable Mean
Strongly
Disagree Disagree Neither Agree
Strongly Agree
Team* 4.5 0 1 5 18 36
Sport* 4.48 1 1 3 19 36
University* 4.19 0 3 10 23 25
Coach* 4.09 1 5 10 18 28
Community* 4.02 0 2 16 24 18
Level of Sport 3.97 0 7 9 26 19
Baseball-Sponsor Recognition
There were 15 sponsors listed on the survey, with three of those being “dummy” or fake sponsors of UNC athletics. The recognition rates for both males and females were similar. In this case, the lower the mean the better, as a “correct” response has a value of “1.” For the males, only two sponsors were significant with a mean in the “1” range, Coca-Cola (M = 1.85) and Wells Fargo (M = 1.85). Coca-Cola and Wells Fargo were one of four comprehensive sponsors for UNC athletics, where their sponsorship elements span across a wide array of mediums such as radio, signage, print, Internet, and in-game promotions. Therefore, having these sponsors as the top two correctly identified is no surprise since they are around many UNC athletics mediums. However, the women were able to pick up on two more correct sponsors by correctly identifying Verizon (M = 1.83) and the North Carolina
Education Lottery (M = 1.83) as well. An interesting note is that the NC Education Lottery contract was only signed in December 2012, a mere two months before these surveys were taken. Some of the other sponsors have been sponsors for years, yet were barely identified, such as Systel (M = 2.82 for males, 2.83 for females).
Ricoh, an actual sponsor of UNC athletics, was ranked the lowest for baseball fans, with only three male and three female fans being able to identify it as a
recognition rates and the breakdown of how many were correctly (or incorrectly) identified.
Table 10
Sponsor Recognition Test Table – Baseball - Male
Sponsor Mean Correct Incorrect
Didn't Answer
Coca-Cola* 1.85 19 0 13
Wells Fargo* 1.85 19 0 14
Verizon 2.03 16 0 17
TWC 2.21 13 0 20
NC Lottery 2.45 9 0 23
Crown Honda 2.52 8 0 24
Utz 2.52 8 0 24
Kangaroo Express 2.58 7 0 24
Chapel Ridge 2.64 6 0 25
Marathon 2.82 3 0 28
Systel 2.82 3 0 28
Hyundai** 2.85 0 5 26
John Deere** 2.85 0 5 26
Performance Auto** 2.94 0 2 29
Ricoh 3 0 0 31
Note: *Significant at µ=1 ** Dummy Sponsor
Table 11
Sponsor Recognition Test Table – Baseball - Female
Mean Correct Incorrect
Didn't Answer
Coca-Cola* 1.83 7 0 5
Verizon* 1.83 7 0 5
Wells Fargo* 1.83 7 0 4
NC Lottery* 1.83 7 0 5
TWC 2.17 5 0 6
Crown Honda 2.33 4 0 6
Chapel Ridge 2.5 3 0 8
Kangaroo Express 2.5 3 0 7
Utz 2.5 3 0 8
Marathon 2.67 2 0 9
Systel 2.83 1 0 9
Performance Auto** 2.92 0 1 10
Hyundai** 3 0 0 11
John Deere** 3 0 0 11
Ricoh 3 0 0 11
Note: *Significant at µ=1 ** Dummy Sponsor Women’s Basketball- Sponsor Recognition
even acknowledged with any of the baseball participants whatsoever, was at least identified by 2 female participants in the women’s basketball study.
Table 12
Sponsor Recognition Test Table – Women’s Basketball - Male
Mean Correct Incorrect
Didn't Answer
Verizon* 1.71 20 0 11
Wells Fargo* 1.9 17 0 13
Coca-Cola 2.03 15 0 16
TWC 2.03 15 0 16
Crown Honda 2.35 10 0 20
NC Lottery 2.42 9 0 21
Chapel Ridge 2.48 8 0 23
Kangaroo Express 2.55 7 0 23
Performance Auto** 2.71 0 8 21
Systel 2.74 4 0 26
Utz 2.74 4 0 27
Hyundai** 2.9 0 3 26
Marathon 2.94 1 0 29
John Deere** 2.94 0 2 27
Ricoh 3 0 0 30
Note: *Significant at µ=1 ** Dummy Sponsor
Table 13
Sponsor Recognition Test Table – Women’s Basketball - Female
Mean Correct Incorrect
Didn't Answer
Wells Fargo** 1.89 35 0 28
Verizon 2.03 31 0 31
Coca-Cola 2.19 26 0 38
TWC 2.38 20 0 44
Chapel Ridge 2.41 19 0 45
Crown Honda 2.5 16 0 47
Kangaroo Express 2.59 13 0 51
Utz 2.59 13 0 49
NC Lottery 2.63 12 0 50
Marathon 2.78 7 0 55
Performance Auto* 2.81 0 12 51
Systel 2.88 4 0 58
Hyundai* 2.89 0 7 55
John Deere* 2.94 0 4 58
Ricoh 2.94 2 0 60
Chapter V
DISCUSSION
The purpose of this study was to examine the motivators and points of attachments derived from MSSC and PAI scales. When trying to achieve this goal, the study fell short by being unable to compare the factors to the recognition survey. As noted in the results, the low number of “correct” scores for the sponsor
recognition survey prevented the study to complete any type of statistical analysis that would have allowed for this comparison. Originally, a multiple regression or correlation was considered in order to cross reference these factors, but it was later decided to err of the safe side. Therefore, this study focused on presenting
descriptive statistics from the MSSC, PAI and sponsor recognition surveys.
Even though the study’s original purpose was not fully fulfilled, this study still provides useful information for college-sport marketers. The results from the means for the MSSC and PAI scores indicate men and women report different motivations for attending college-sport events. In addition to differences based on gender, fans from two distinct sports also had differing MSSC and PAI scores. In general, men attended games for the technical aspect, with physical skill, aesthetics, and the drama of a game also identified as high motivating factors. While women
sexes in both sports. This seems to strongly indicate fans want close, but fair, sport events. With aggression ranked pretty low by both sexes in both sports, it would have been interesting to have this survey across a ride array of sports at a school. While ranked low with women’s basketball and baseball, perhaps ice hockey or wrestling would have had aggression ranked much higher and a main reason why fans want to come out to games.
The PAI scale did not have much variation between both sex and sport. It would be interesting to see this study done for pro sports, where factors such as “players” would have possibly ranked a lot higher since many teams are known for their star player. Trail et. al mentioned in their 2003 study that “vicarious
achievement is typically highly correlated with attachment to a team, coach,
community and university.” While these were all significant factors in the PAI part of this study, vicarious achievement actually ranked lower in the list of significant factors, with it not being a significant factor at all for baseball. Since the MSSC and PAI scales show differences between the two sexes and sports, it is imperative that marketers understand this when focusing on a team. Instead of having a universal approach, understanding their consumer will not only save money, but also help their effort when trying to increase attendance and sales (tickets, merchandise, concessions, etc.).
the sponsors. There are a couple things that can be taken away from this. First, it’s very possible that the advertisements are simply becoming noise to fans. Bennett (1999) stated that if a fan can successfully recognize a sponsor then it means that they have a significant interest in the team. The low scores should not necessarily refute this statement, but rather suggest that the fans are easily tuning out these advertisements. This concept is called noise, and it’s very likely that it’s affecting sport sponsorships. Madrigal (2001) noted that corporate sponsors tend to target sports because of its ease to focus on fans of similar likes and interests. While this is certainly still the case, perhaps more memorable sponsorship activation is needed in order for fans to correctly identify sponsors. These memorable sponsorships could include more interaction with fans face-to-face, via display tables at an event or a promotion that actively engages fans.
Kim (2009) suggested that it’s important for fans to recognize sponsors in order to build brand loyalty, which in turn builds brand equity. While it’s important to build brand loyalty, brand loyalty can also hurt sponsorship recognition, as it could lead to older fan bases easily tuning out advertisements since they already have their minds made up (Maxwell & Lough 2009). With a high mean age in women’s basketball especially, it’s easy to see why the fans there recognized fewer sponsors than their counterpart in baseball.
present at many of UNC-CH’s arenas and stadiums, UNC-CH’s conservative and traditional approach encourages the signs to blend into to the surroundings, rather than stand out. Even though this satisfies fans and allows the sponsors to have an exclusive opportunity to advertise in an UNC-CH arena, it creates this situation that is present in this study. By having to blend in, it makes sense as to why the
recognition rates were low. Not only are fans accustomed to tuning out
advertisements in general, but also they are not exposed to any memorable, eye-catching signage at UNC-CH.
However, if there’s any positive from the low sponsorship recognition scores, it’s that the UNC-CH athletic department could allow for more signage and
promotions. If fans are not even recognizing the sponsors, what are one or two more signs, public address announcements, etc. going to do to hurt the image? As
mentioned earlier in the introduction, many schools are facing major budget
concerns and not too many actually turn a profit each year (Upton, Berkowitz 2012). These additional sponsors and/or elements to an existing sponsorship can help bring in more money to support an athletic department.
Limitations and Future Research
Sponsorship recognition for women’s basketball and baseball at the campus of UNC-CH was examined. Therefore, any generalizations made from this study should come with caution. The findings in this study can be different at another school or organization.
restraints and ease of survey completion, it was changed to baseball. Certainly, this could have changed the results somewhat, but baseball and women’s basketball still give a good basis and a further study could have different sports.
This information only features UNC-CH athletics, in which the important factors could change at a different school. A different study could do compare two schools’ factors against one another. It’s important for marketers to understand their own product and consumers and make decisions based off of that and not compare it with another school.
In general, low recognition rates can be attributed to non-meaningful
activations of the sponsorship elements. When living in advertisement heavy times, it’s important for creative minds to make sponsors stand out. Traditional mediums such as signage, print, radio are important, but also taking into account
Internet/social media and promotions can help make the sponsor stand out and have an effective return on investment.
fan base taking this survey, Internet advertisements are not as relative to them as it would be with a younger participant in their 20s or 30s. Recognizing the important inventory item and doing a study based on that would be important for any future research in this area. In this case, basing the survey on the radio advertisements might have yielded a higher sponsorship recognition rate. Also taking into account the possible demographics in the study is important. For this study, the fan base was older, where surveying about radio would have made more sense than signage. The numbers might have been lower due to noise, but it’s more relevant than signage. However, if the situation were reversed and it was anticipated that younger fans would be taking the survey, then Internet might make more sense than radio or print.
Future research should also find ways to increase the numbers involved in the survey. With such low numbers (n = 140), comparing the factors with
sponsorship recognition could not be completed. While women’s basketball and baseball are easier to survey since they have lower attendance numbers, the lower attendance at these versus men’s basketball or football, which average around 20,000 and 60,000 respectively, also hindered the study. Providing an incentive for survey takers, or simply surveying at more games would have helped increase numbers. Also, many of the survey participants had a high mean age, so
Appendix A
SURVEY
We are very interested in your thoughts and feelings about the University of North Carolina at Chapel Hill (TEAM NAME). The information you provide will help us understand factors that may motivate people to follow sport. Your cooperation is
extremely important and is greatly appreciated.
We ask that you complete the questionnaire, which should take less than 10 minutes to finish. There are no known physical or psychological risks associated with completing this survey; however some questions may be considered sensitive. As such, your assistance is entirely voluntary and you may withdraw from completing the survey at any time. You may be assured of complete confidentiality. Individual responses will not be reported. The published results will not refer to any individual
and all discussions will be based on group data.
If you have any questions about the survey, please contact the email below. Thank you for your assistance with this research.
We are interested in what motivates you to attend a (INSERT SPORT HERE). The following statements are indicative of specific motives. Please rate the extent to which you DISAGREE or AGREE with each relative watching a (INSERT SPORT) game by indicating the appropriate number in the scale beside each statement.
St ro ng ly D isa gre e Neu tra l St ro ng ly Ag re e Motives Vicarious Achievement
1. I feel a personal sense of achievement when the
team does well 1 2 3 4 5
Aesthetics 1 2 3 4 5
2. I appreciate the beauty inherent in the game 1 2 3 4 5
Drama 1 2 3 4 5
3. I enjoy the drama of close games 1 2 3 4 5
Escape 1 2 3 4 5
4. The game provides an escape from my
day-to-day routine 1 2 3 4 5
Acquisition of knowledge 1 2 3 4 5
5. I can increase my knowledge about the activity 1 2 3 4 5
Physical Skill of the athletes 1 2 3 4 5
6. The superior skills are something I appreciate
while watching the game 1 2 3 4 5
Social Interaction 1 2 3 4 5
7. I enjoy interacting with other people when I watch
the game 1 2 3 4 5
Physical Attractiveness 1 2 3 4 5
8. I enjoy watching players who are physical
attractive 1 2 3 4 5
Enjoyment of Aggression 1 2 3 4 5
9. I enjoy the fighting and rough play during the
game 1 2 3 4 5
Novelty 1 2 3 4 5
10. I enjoy the novelty of a (name of sport) 1 2 3 4 5
Points of Attachment 1 2 3 4 5
Identification with the players 1 2 3 4 5 11. I am more a fan of the individual players on the
Identification with the team 1 2 3 4 5 12. I consider myself to be a "real" fan of the (team
name) team 1 2 3 4 5
Identification with the coach 1 2 3 4 5
13. I am a big fan of Coach (name) 1 2 3 4 5
Identification with the community 1 2 3 4 5 14. I feel connected to numerous aspects in the
(name of) community 1 2 3 4 5
Identification with sport 1 2 3 4 5
15. First and foremost I consider myself a (name of
sport) fan 1 2 3 4 5
Identification with the university 1 2 3 4 5 16. I connect with numerous aspects of the
university 1 2 3 4 5
Identification with level of sport 1 2 3 4 5 17. I am a fan of college (name of sport) regardless
Please tell us a little about yourself by checking the appropriate response:
Gender ______ Male ______ Female
Your age in years ______
Marital Status ______ Single ______Married
Ethnicity
___Black/African-‐American (non-‐Hispanic) ___Native American ___White/Caucasian (non-‐Hispanic) ___Asian or Pacific Islander ___Hispanic ___Other
How many games do you plan on attending this year? _____
For how long have you been aware of (team name)? _____years
Do you consider yourself a fan of (team name) Yes No
If so, how long have you been a fan of (team name)? ______years
How many (team name) games did you go to last year? _____games
REFERENCES
Bennett, R. (1999). Sports sponsorship, spectator recall and false consensus. European Journal of Marketing, 33(3/4), 291-313.
Branscombe, N. R., & Wann, D. L. (1991). The positive social and self concept consequences of sports team identification. Journal of Sport & Social Issues, 15(2), 115-127.
Clarke, L. (2012, June 28). Maryland athletics’ financial woes reveal a broken college sports revenue model. Washington Post. Retrieved from
http://www.washingtonpost.com/sports/colleges/maryland-athletics-financial-
woes-reveal-a-broken-college-sports-revenue-model/2012/06/28/gJQAmEvx9V_story_2.html
Dees, W., Bennett, G., & Villegas, J. (2008). Measuring the effectiveness of sponsorship of an elite intercollegiate football program. Sport Marketing Quarterly, 17(2), 79.
DeSarbo, W. (2009). Measuring fan avidity can help marketers narrow their focus. Sports Business Journal,
Dolphin, R. R. (2003). Sponsorship: Perspectives on its strategic role. Corporate Communications: An International Journal, 8(3), 173-186.
Fornell, C., & Larcker, D. F. (1981). Evaluating structural equation models with unobservable variables and measurement error. Journal of Marketing Research, 39-50.
Funk, D. C., & Pastore, D. L. (2000). Equating attitudes to allegiance: The usefulness of selected attitudinal information in segmenting loyalty to professional sports teams. Sport Marketing Quarterly, 9(4), 175-184. Retrieved from
https://auth.lib.unc.edu/ezproxy_auth.php?url=http://search.ebscohost.com/lo gin.aspx?direct=true&db=bth&AN=5001555&site=ehost-live&scope=site Gwinner, K. P., & Eaton, J. (1999). Building brand image through event sponsorship:
The role of image transfer. Journal of Advertising, , 47-57.
Irwin, R. L., Lachowetz, T., Cornwell, T. B., & Clark, J. S. (2003). Cause-related sport sponsorship: An assessment of spectator beliefs, attitudes, and behavioral intentions. Sport Marketing Quarterly, 12(3), 131-139. Kahle, L. R., Kambara, K. M., & Rose, G. M. (1996). A functional model of fan
51-Kelman, H. C. (1958). Compliance, identification, and internalization: Three
processes of attitude change. The Journal of Conflict Resolution, 2(1), 51-60. Kim, S. (2009). The relationships between team attributes, team identification and
sponsor image. International Journal of Sports Marketing and Sponsorship, 10(3), 215-229.
Knecht, J., & Stoelinga, B. G. (1992). Communicatie begrippenlijst Kluwer Bedrijfswetenschappen.
Lee, D., Trail, G. T., & Anderson, D. F. (2009). Differences in motives and points of attachment by season ticket status: A case study of ACHA. International Journal of Sport Management and Marketing, 5(1), 132-150.
Madrigal, R. (2001). Social identity effects in a belief?attitude?intentions hierarchy: Implications for corporate sponsorship. Psychology and Marketing, 18(2), 145-165. doi:
10.1002/1520-6793(200102)18:2<145::AID-MAR1003>3.0.CO;2-T
Maslow, A. H. (1943). A theory of human motivation. Psychological Review, 50(4), 370.
Maxwell, H., & Lough, N. (2009). Signage vs. no signage: An analysis of sponsorship recognition in women's college basketball. Sport Marketing Quarterly, 18(4), 188-198. Retrieved from
https://auth.lib.unc.edu/ezproxy_auth.php?url=http://search.ebscohost.com/lo gin.aspx?direct=true&db=bth&AN=47550049&site=ehost-live&scope=site Meenaghan, T. (1998). Current developments and future directions in sponsorship.
International Journal of Advertising, 17, 3-28.
Milne, G. R., & McDonald, M. A. (1999). Sport marketing: Managing the exchange process Jones & Bartlett Learning.
Miloch, K. S., & Lambrecht, K. W. (2006). Consumer awareness of sponsorship at grassroots sport events. Sport Marketing Quarterly, 15(3), 147-154.
Mullin, B., Hardy, S., & Sutton, W. (Eds.). (2007). Sport marketing (3rd ed.) Human Kinetics.
Nicholls, J. A. F., Roslow, S., & Dublish, S. (1999). Brand recall and brand
Nunnally, J. C. (1967). Psychometric theory Tata McGraw-Hill Education. Pitts, B. G., & Slattery, J. (2004). An examination of the effects of time on
sponsorship awareness levels. Sport Marketing Quarterly, 13(1), 43-54. Retrieved from
https://auth.lib.unc.edu/ezproxy_auth.php?url=http://search.ebscohost.com/lo gin.aspx?direct=true&db=bth&AN=12529531&site=ehost-live&scope=site Robinson, M. J., Trail, G. T., & Kwon, H. (2004). Motives and points of attachment of
professional golf spectators. Sport Management Review, 7(2), 167-192. Schnaars, C., Upton, J., Mosemak, J., & DeRamus, K. (2012, May 16). NCAA
college athletics department finances database. USA Today
Sloan, L. R. (1989). The motives of sports fans. Sports Games and Play Social Psychological Viewpoints, 2
Trail, G. (2012). Motivation scale for sport consumption. Sport Consumer Research Consultants LLC,
Trail, G. (2012). Points of attachment index. Sport Consumer Research Consultants LLC,
Trail, G., J.,Jeffrey D. (2001). The motivation scale for sport consumption: Assessment of the scale's psychometric properties. Journal of Sport Behavior, 24(1), 108. Retrieved from
https://auth.lib.unc.edu/ezproxy_auth.php?url=http://search.ebscohost.com/lo gin.aspx?direct=true&db=f6h&AN=4114024&site=ehost-live&scope=site Trail, G., Kim, Yu Kyoum. (2011). Factors influencing spectator sports consumption:
NCAA women's college basketball. International Journal of Sports Marketing and Sponsorship,
Trail, G., Robinson, M. J., Dick, R. J., & Gillentine, A. J. (2003). Motives and points of attachment: Fans versus spectators in intercollegiate athletics. Sport Marketing Quarterly, 12(4), 217-227. Retrieved from
https://auth.lib.unc.edu/ezproxy_auth.php?url=http://search.ebscohost.com/lo gin.aspx?direct=true&db=bth&AN=12519917&site=ehost-live&scope=site Upton, J., & Berkowitz, S. (2012, May 14). Budget disparity growing among NCAA
division I schools. USA Today
Wachovia to advertise in dean dome. (2005). The Dispatch, pp. 11A.