CAN THE PARTY STILL DECIDE? NATIONAL PARTY CHANGES AND THEIR EFFECT ON PRESIDENTIAL PRIMARIES
William E. Patton
A thesis submitted to the faculty of the University of North Carolina at Chapel Hill in partial fulfillment of the requirements for the degree of Master of Arts in the Department of Political Science.
Chapel Hill 2019
Approved by:
Sarah Treul Roberts
Jason Roberts
ABSTRACT
William E. Patton: Can the Party Still Decide? National Party Changes and Their Effect on Presidential Primaries
(Under the direction of Sarah Treul Roberts)
ACKNOWLEDGEMENTS
TABLE OF CONTENTS
LIST OF TABLES . . . vi
LIST OF FIGURES . . . vii
INTRODUCTION . . . 1
APPLYING THE MEDIAN VOTER THEOREM TO PRIMARIES . . . 3
PARTISAN REALIGNMENT AND PRESIDENTIAL PRIMARIES . . . 4
SUCCESS IN PRESIDENTIAL PRIMARIES . . . 6
CAMPAIGN STRATEGY AND STATE-LEVEL INFLUENCE . . . 8
THEORETICAL EXPECTATIONS . . . 9
MEASUREMENT AND OPERATIONALIZATION . . . 13
CONTROLS . . . 16
METHODS AND DATA/RESULTS . . . 17
DISCUSSION AND IMPLICATIONS . . . 26
CONCLUSION . . . 28
APPENDIX . . . 29
LIST OF TABLES
1 Model: Both Parties . . . 17
2 OLS Results by Party . . . 19
3 Percentage of Republican Delegates . . . 20
4 Percentage of Democratic Delegates . . . 21
5 Candidate, Election Cycle, and Dynamic CFScores, Part 1 . . . 32
6 Candidate, Election Cycle, and Dynamic CFScores, Part 2 . . . 33
7 Percentage of Republican Delegates . . . 33
LIST OF FIGURES
1 Republican Delegates Over Time . . . 22
2 Democratic Delegates Over Time . . . 22
3 Republican Bias Over Time . . . 23
4 Democratic Bias Over Time . . . 24
5 Delegates Available During the Competitive Window of Republican Nominations . . . . 25
6 Delegates Available During the Competitive Window of Democratic Nominations . . . . 26
7 2016 Relationship Between Democratic Presidential Vote Share and AIP Scores . . . 29
8 2016 Relationship Between Republican Presidential Vote Share and AIP Scores . . . 30
9 2004 Relationship Between Democratic Presidential Vote Share and AIP Scores . . . 30
INTRODUCTION
The 2016 presidential election could be characterized as unconventional. Hillary Clinton became the first female nominee of a major party in U.S. history. Beyond this, a billionaire reality television star with no previous political experience was able to defeat a former First Lady, Secretary of State, and senator to become President of the United States. What was perhaps even more unconventional was the way the Republican primary played out. Donald Trump, a political newcomer, was able to defeat 15 other major candidates, many of whom were viewed as ‘establishment’ favorites. Further, in a nominating system that was perhaps the most responsive to the electorate as it has ever been, the candidates who won their respective party’s nomination were the most unpopular candidates for president in history. While Hillary Clinton was the favored candidate among Democratic leaders, Donald Trump was far from the consensus pick among Republican Party elites. How then, in a system that until this point had been largely explained by elite endorsements and behavior in the invisible primary(Cohen et al., 2009), did both parties nominate candidates that were unpalatable to a large swath of the general electorate? To understand this, this paper examines the structural factors within the nomination contest that have begun to erode party control over nominations. I aruge that both national parties have increasingly given undue influence to state delegations that represent the ideological extreme of their party, leading to candidates with less broad appeal. Further, I argue in this paper that primary electorates in presidential contests behave similarly to the general electorate, and that in order for a candidate with broad appeal to win her party’s nomination, the parties must take an active role in reversing the current trend, emphasizing states that reward moderation.
for candidates to run moderate campaigns, as the number of delegates available to candidates from ideologically moderate states (including states that are conservative for Democrats and liberal for Republicans), although decreasing as of late, heavily outweigh the number of delegates available from states ideologically consistent with the party. Finally, I argue that over time, due to a focus on rewarding partisan loyalty in allocating delegates to state delegations, the national parties have given increasingly inordinate amounts of influence to states that represent the ideological extreme of their party. This, coupled with increased front-loading of primary calendars with ideologically extreme states has contributed to the growing polarization of presidential primaries, and has diminished the party’s role in selecting their candidate for president.
APPLYING THE MEDIAN VOTER THEOREM TO PRIMARIES
Polarization among elites and American citizens has been steadily increasing over the past several decades, stemming partly from sharp divisions among social groups and the growing presence of ‘culture wars’ in American society (Muste, 2014). Parties have also become much more ideologically sorted (Fiorina and Levendusky, 2006) and citizens are now better able to identify key policy positions of each party. This appears to portray the American public as divided and extreme. Given that American politicians have begun to exhibit more polarized behavior in office and citizens hold more dissimilar views than their partisan rivals, it seems logical that American society has significantly drifted away from Downs (1957)’s assertion that politicians must appeal to the median voter, and that, due to the propensity of extreme partisans to vote and the occasional exclusion of independents, primary elections should serve as a breeding ground for ideological extremity among voters.
PARTISAN REALIGNMENT AND PRESIDENTIAL PRIMARIES
Given candidates may have a viable path to their party’s nomination through the moderate portion of their electorate, it is important to address the ideological alignment of both parties, and how each party has changed over time. Partisan realignment, issue evolution and the development of the post-reform direct primary for presidential nominations took place almost simultaneously. The one-party system under Democratic rule in the South began to falter when Franklin Roosevelt proposed a plan to “pack” the Supreme Court, presumably with northern Democrats who could vote to overturn precedents that enabled discrimination during the Jim Crow era in the south (Aldrich and Griffin, 2018). White southern Democrats began to turn to the Republican Party following Democratic president Lyndon Johnson’s embrace of Civil Rights and the anti-Civil Rights campaign of Barry Goldwater that began the Republican embrace of white southerners (Carmines and Stimson, 1989). The Goldwater campaign, as well as Richard Nixon’s victory in southern states during his first presidential campaign changed voting habits among partisans, and particularly among African Americans, for decades to come (Aldrich and Griffin, 2018). Thus, the ideology of both parties began to become more sorted, leading to more liberal Democrats and more conservative Republicans, with more Democrats occupying the northeast and west coast, while Republicans built a stronghold in the conservative south and southwest.
The presence of African Americans and ‘blue dog Democrats’ in the South, as well as white conservatives in the northeast have created scenarios in which factions can elect minority party candidates to public office, and can serve as a moderating effect for the state. For example, overwhelmingly liberal and Democratic Massachusetts has elected only one Democratic governor since 1991, while electing 5 Republicans. Heterogeneity of constituents may prevent one-party systems from taking over, and could allow for presidential candidates to seek a broad coalition to become their party’s nominee for president.
SUCCESS IN PRESIDENTIAL PRIMARIES
Beyond voters, institutional rules and forces play large roles in determining who wins the nomination of the two major parties in American politics. From 1972-2016, nominations for president could largely have been explained by the ‘invisible primary.’ Cohen et al. (2009) find that success in presidential primaries in the post-reform era is largely attributable to the party-in-organization, and that party endorsements and fund raising that take place in the ‘invisible primary,’ the time that candidates spend preparing to run for president before publicly declaring their candidacy, allow for party leaders to coalesce around their chosen candidate and send a ‘message’ to voters for whom they should select to represent the party. This finding did not hold up in 2016, however, as Donald Trump was able to garner enough populist support to secure the nomination without endorsements and support from party elites.
CAMPAIGN STRATEGY AND STATE-LEVEL INFLUENCE
Finally, campaign strategy and resource allocation can help explain who is successful in presidential primaries, and where they are successful. Gurian (1986) finds that there are two resource allocation strategies that candidates adopt in presidential nominations, depending on their position. The first, usually adopted by ‘long-shot’ candidates who are unlikely to win the nomination, seeks to maximize momentum, while the strategy adopted by more ‘serious’ candidates is to maximize delegates. This seems to be the tale of the 2016 Democratic primary. Hillary Clinton sought to maximize delegates to protect her front-runner status, while Bernie Sanders sought to capitalize on momentum building contests in order to propel his campaign and catch Clinton in the delegate race. Gurian also finds that early media coverage and the size of the state delegation are significant determinants of candidate spending across states. Thus, it appears as though parties have an opportunity to influence which states are the most important in the nomination process through determination of the size of state delegations.
THEORETICAL EXPECTATIONS
Presidential elections in post-reform America have followed a striking trend. Candidates for president in both of the two major political parties have, more often than not, closely represented the ideological center of the electorate. Jimmy Carter, Bill Clinton, Al Gore, and Mitt Romney are just a few examples of this trend. This is surprising, as one might expect primary electorates to favor ideologically extreme candidates, however this anecdotally appears to not be the case. Work done by Sides, Vavreck and Warshaw (2018) demonstrates that the primary electorate in presidential elections is not significantly different than that of “the party following,” which demonstrates that the median voter theorem may still apply in presidential primaries, and that there may be an incentive for candidates to moderate their message in primary campaigns for president. In short, presidential primary voters appear to be less ideologically extreme than those of voters in other primary elections, and they elect presidential nominees who do not represent the ideological extremes of their respective parties, and a candidate with broad appeal, who is ideologically similar to a larger portion of the electorate should be advantaged over ideologues in presidential nominations.
Second, I argue that the number of delegates available to candidates in presidential primaries are primarily from states that do not represent the ideological extreme of the party. There are over 50 contests that candidates must compete in, and a large percentage of delegates available to candidates come from states that do not reliably vote for the Republican or Democratic candidate. Thus, my second hypothesis (H2) is that the percentage of delegates available to candidates in presidential nominations from states that do not represent the ideological extreme of their party is larger than the percentage of delegates in these ‘extreme’ states. If this is true, it seems logical that there is a path to the nomination for candidates who are moderate and run moderate campaigns.
To anecdotally demonstrate both of these expectations, I look to the 2016 Democratic nomination where Hillary Clinton, the eventual nominee for the Democratic Party and the more moderate candidate, won 1335 pledged delegates from states with conservative/moderate electorates, making up 47.5 percent of her pledged delegate total. Clinton needed only 336 delegates from traditionally ‘liberal’ states to receive a majority of pledged delegates. Similarly, the Republican nominee needed 1237 delegates to clinch the nomination. There were over 1700 delegates available to candidates from traditionally ‘liberal/moderate’ states, signifying that a viable path to the nomination did not only exist through states considered Republican strongholds. This indicates that the path to the nomination for both parties can lie in states that do not represent the ideological leaning of their party. Moderation in the primary can lead to a candidate’s success, as well as benefit the candidate in the general election, and the parties would be advantaged to give more influence to these states, if their goal is to nominate a candidate with broad appeal in the general election, and avoid nominating unpopular candidates as they did in 2016.
a previous presidential election, has a Republican governor, senator(s), or GOP-controlled state legislative chambers. The Democratic Party follows a similar apportionment technique.
This ‘partisan loyalty’ component of delegate apportionment by the national parties, I argue, has contributed to growing influence in states that represent the ideological extremes of the party over time. As the parties have become more sorted (Levendusky, 2009), and as states have become more reliably Republican or Democratic in presidential and statewide elections, the percentage of delegates given to states that reliably vote for their party, and thus may represent the ideological extreme of the party, has dramatically increased. This increased delegate total should, in turn, give these states more influence and attention from candidates and their campaigns (Gurian, 1986). Thus, I argue that the national parties moving towards allocating additional delegates to states based on partisan loyalty has contributed to the erosion of party control of primaries and led to increased polarization of the presidential primary electorate.
Previous research on candidate resource allocation in presidential primaries has made clear that candidates are strategic in where they spend most of their time and money, and that stems partly from delegate apportionment by the national parties (Ridout, Rottinghaus and Hosey (2009), Gurian (1986)). Candidates who perceive themselves as legitimate contenders for the nomination will seek to maximize delegates and run the most efficient campaign possible (Gurian, 1986). Thus, candidates should in turn spend more time and campaign resources in states that they perceive are ‘worth it,’ and this includes states with larger delegate totals as well as states in which they are polling well. If candidates perform well in states with larger delegate totals, they will be that much closer to the nomination and they will display to the public, the media, and their opponents that they are viable, which in turn benefits their campaign.
I present here a simplified expected utility equation of allocating resources to a state in a presidential primary:
E[u]allocating=epercent∗D−c
that has on average 24 delegates to the national convention even if they are likely to win, compared to Texas, which has more than 200 delegates available. Winning roughly 10 percent of the delegates in Texas would net the same number of delegates if the candidate won 100 percent of the delegates in Vermont. Thus, it appears as though candidates will respond to increases in the apportionment of delegates to states by national parties, increasing attention in states where they can win more delegates1.
It follows that parties have the ability, and perhaps the interest, to manipulate where candidates spend their time and money, given they control how delegates are apportioned to states. The national parties also have final say over the sequence of contests, as well as delegate allocation (particularly in the Republican Party), which could influence candidate resource allocation as well (Geer, 1986).
Thus my third hypothesis is, as states have become more supportive of one party over another in presidential elections over time, the percentage of delegates that the Democratic Party has apportioned to liberal states and the percentage of delegates that the Republican Party has apportioned to conservative states has increased, and similarly the percentage of delegates that the GOP has allocated to liberal states and the Democratic Party to conservative states has decreased. Further, I expect that the percentage of delegates apportioned to states that represent the ideological extreme of the party has increased more than state’s percentage of the national population. I will refer to this argument as Hypothesis 3 (H3). Stemming from Hypothesis 3, I seek to demonstrate that, due to the success of moderates in moderate states, the parties would benefit from allocating more delegates to states that are opposite their ideology or ideologically moderate, if they seek to nominate a candidate who would have broad appeal in the general election. Finally, I expect that over time, the number of delegates from ideological states in a presidential primary that takes place during the ‘competitive window’ has increased, leading to an increased emphasis on ideological extremity in primaries, which I will call Hypothesis 4 (H4).
MEASUREMENT AND OPERATIONALIZATION
For the purposes of this study, I am limiting my analysis to competitive2 presidential nominating contests between 1980 and 2016. I use this time frame, as it encompasses all presidential nomination contests in which the reforms proposed by the McGovern-Fraser Commission had been fully implemented.
In order to operationalize my hypotheses, I first must define ideology, both for candidates and constituencies. For constituencies, I use the sum of the respective party’s percent of the vote share in the two previous presidential elections. In this instance, I use partisanship as a proxy for ideology among constituents3.
To measure ideology of candidates for president, I use Bonica (2016)’s Database on Ideology, Money in Politics and Elections measures. The database serves as an “on-going effort to perform a comprehensive ideological mapping of political elites, interest groups, and donors, using the common-space CFscore scaling methodology” (Bonica, 2016). More negative values correspond to more ideologically liberal candidates, and more positive scores correspond to more ideologically conservative candidates, with scores closer to zero representing moderates4.
In order to test my first hypothesis regarding ideological congruence, I created a measure which is the absolute distance between the candidate’s ideology and the ideology/partisanship of the state
2 I defined ‘competitive’ nominations to be contests in which the more than one candidate won a nominating
contest throughout the cycle and in which the incumbent president faced no serious challenge. This eliminates the 2000 Democratic nomination, as Al Gore won every contest, and the incumbent party’s nominations in 1984, 1992, 1996, 2004, and 2012.
3The correlation coefficient between the average previous presidential vote share and ideology scores generated by
Tausanovitch and Warshaw’sAmerican Ideology Project that I aggregated to the state level correlate consistently at levels near or above 0.9, so I argue presidential vote share is an effective proxy for ideology of constituents. The first four figures in the Appendix show the relationship of these scores and presidential vote share for Democrats and Republicans in 2016, Democrats in 2004, and Republicans in 2000. Given how closely these are correlated, I argue that partisanship acts as a viable proxy for ideology of constituencies.
4See the table in the Appendix to see the candidates included in the analysis, their ideology scores, ranging from
they are competing in. I take the absolute value of the candidate’s ideology score for this, giving a measure of ideological extremity in the same direction for all candidates. Thus, as the ideological distance goes up, the more dissimilar the candidate’s ideology is from the primary state, and the worse I expect them to perform in that state. Methodologically, this also places ideology of states and candidates on the same scale, from 0 to 2. For example, Hillary Clinton, the more ‘moderate’ candidate in the 2016 Democratic Primary, has an ideology score of -1.20, while Bernie Sanders is more liberal, with a score of -1.60. Taking the absolute value I have a measure of both Clinton and Sanders’ ‘liberal-ness’, at 1.203 and 1.518, respectively. I expect that as this distance between the absolute value of the candidate ideology and their respective party’s previous presidential vote share increases, the more ‘out of sync’ the candidate is with the state and their expected vote share in the state should decrease. In Alabama, for example, I expect the more moderate Clinton to perform better than the more liberal Sanders. The distance between the absolute value of Clinton’s CFScore and the sum of Democratic vote share percentage in Alabama in the previous two elections is smaller (1.20-0.771 = 0.429) than Sanders’ (1.60-0.771 = 0.829). Thus, I expect candidates with smaller distances between themselves and the states they are competing in will receive a higher vote share than in states where the distances are larger.
Next, to observe my expectations laid out in H2, I present the mean number of delegates available to candidates in moderate and ideologically conservative and liberal states5. For H3, I collected the percentage of delegates each party allocated to each state, and calculated the difference between the percentage of delegates allocated to a particular state by a party and the percentage of the national population that state encompasses. I refer to this as the ’bias’ instituted by parties giving higher percentages of delegates to states that constitute a smaller percentage of the American public. Thus, I expect both the percentage of delegates in liberal states to decrease for Republicans and increase for Democrats as well as the percentage of delegates in conservative states to decrease for Democrats and the percentage of delegates in liberal states to decrease for Republicans. I also
5In order to create these categories, I took the average Democratic presidential vote share in these states over the
expect ‘bias’ to increase over time, and as presidential vote share becomes more favorable to a party in a particular state.
CONTROLS
METHODS AND DATA/RESULTS
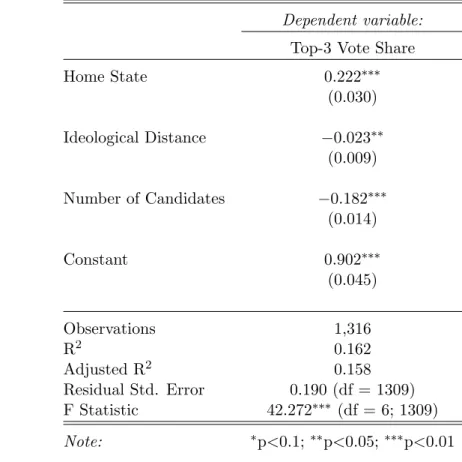
As stated, I conducted an OLS regression analysis with the outcome variable being top-three vote share6 and the primary independent variable of interest being the ideological distance between candidates and the primary states they are competing in. I restricted the analysis to the percentage of the vote that a candidate received of the top-three vote getters in a state, in order to control for variation in vote share amounts that may exist simply because of the number of candidates involved. The results are presented in Table 1, below.
Table 1: Model: Both Parties
Dependent variable:
Top-3 Vote Share
Home State 0.222∗∗∗
(0.030) Ideological Distance −0.023∗∗
(0.009) Number of Candidates −0.182∗∗∗
(0.014)
Constant 0.902∗∗∗
(0.045)
Observations 1,316
R2 0.162
Adjusted R2 0.158
Residual Std. Error 0.190 (df = 1309) F Statistic 42.272∗∗∗ (df = 6; 1309)
Note: ∗p<0.1; ∗∗p<0.05;∗∗∗p<0.01
6I rescale the vote share measure in order to account for differences in the number of candidates to account for the
I find statistically significant support for Hypothesis 1 at the aggregate level, as a one-unit increase in ideological distance between a candidate and the primary state they are competing in leads to an expected decrease in vote share of about 2.3 percent, after controlling for the other variables such as whether or not the state they are competing in is their home state, and the number of candidates in the race7 As expected, candidates are expected to do significantly better in their home states, about 22.2 percent better, all else equal. Similarly, adding another candidate to the race decreases expected top-3 vote share by about 18.2 percent, ceteris paribus.
These findings suggest that primary candidates in presidential nominations are punished on a statewide basis for being too ideologically dissimilar from the the statewide constituency. This suggests that candidates may need to possess broad appeal in order to win not only the general election, but also their respective primary, and suggests that a moderate candidate may perform better in the primary, as they are better able to appeal to large swaths of the country. In order for this to be true, however, the number of delegates available to candidates must not be won from states that represent the ideological extreme of the party.
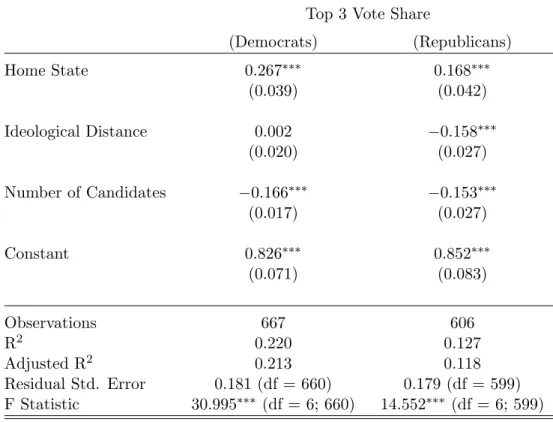
I find interesting results whenever I conduct this analysis separately, by party. The results are presented in Table 2. Similar to the overall analysis, candidates do significantly better in their home states, with the home state coefficient for Democrats being 0.267 and 0.168 for Republicans. The number of candidates variable is also statistically significant for both parties, as it was in the overall model. What is different, however, is the variable of interest, ideological distance between the candidate and the state they are competing in. This variable is statistically significant and negative for Republicans, with a one unit increase in ideological distance leading to an approximate 15.8 percent decrease in vote share for the candidate, ceteris paribus. This significance is not present for Democratic contests, however. The coefficient of 0.002, is close to zero, and is in the opposite direction that I expected. It appears as though Republican voters are punishing candidates for being ideologically dissimilar from the states they are competing in, but this is not true for Democrats.
Next, I aim to show support for Hypothesis 2, that the number of delegates available to candidates in both parties from moderate and states of the opposite ideology far outweighs the
7
Table 2: OLS Results by Party
Dependent variable:
Top 3 Vote Share
(Democrats) (Republicans)
Home State 0.267∗∗∗ 0.168∗∗∗
(0.039) (0.042)
Ideological Distance 0.002 −0.158∗∗∗
(0.020) (0.027)
Number of Candidates −0.166∗∗∗ −0.153∗∗∗
(0.017) (0.027)
Constant 0.826∗∗∗ 0.852∗∗∗
(0.071) (0.083)
Observations 667 606
R2 0.220 0.127
Adjusted R2 0.213 0.118
Residual Std. Error 0.181 (df = 660) 0.179 (df = 599) F Statistic 30.995∗∗∗ (df = 6; 660) 14.552∗∗∗ (df = 6; 599)
number of delegates available to candidates that represent the ideological extreme of their party. I present descriptive statistics in Tables 3 and 4 below, demonstrating the percentage of delegates available in each of the three types of states (conservative, liberal, and moderate), by party. Table 3 demonstrates the breakdown of delegates available in each competitive Republican nomination over time by ideology, while Table 4 shows the breakdown of Democratic delegates available in each type of state8 What is clear from Table 3 is that the percent of delegates available to Republican candidates are overwhelming from moderate or liberal states, with conservative states only making up at most 29.61 percent of the delegate total in 2016.
Table 3: Percentage of Republican Delegates Year Moderate/Liberal Conservative
1976 77.38 22.62
1980 75.73 24.27
1988 76.91 23.09
1996 75.09 24.91
2000 71.68 28.32
2004 71.34 28.66
2008 71.82 28.18
2012 70.61 29.39
2016 70.39 29.61
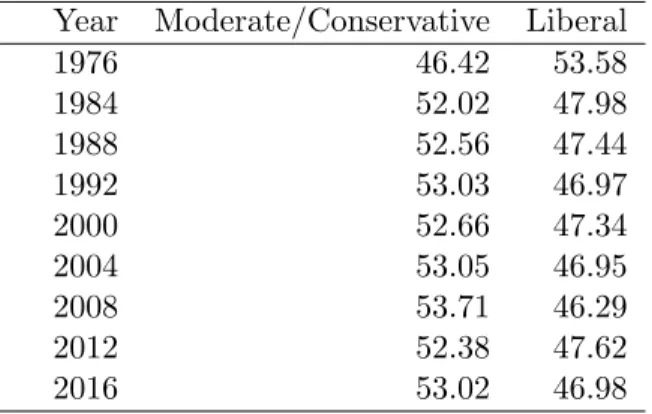
Table 4 shows that, on average, a little over half of the delegates available to Democratic candidates are from moderate or liberal states. Although, not as important to candidates in Democratic primaries as in Republican primaries, these tables demonstrate that candidates cannot solely rely on states from the ideological extremes of their party to win the nomination, and there is a clear incentive for candidates to moderate and try to appeal to a broad section of the electorate, even in the primary 9.
8
For the purposes of this project, I took the average Democratic presidential vote share in each state in each presidential election between 1976 and 2016. I then ranked them, from least Democratic to most. I then split them into 3 categories, with the most Republican in the first category, the middle category making up the moderate category, and the most Democratic making up the liberal category. As mentioned earlier, I use presidential vote share as a proxy for ideology.
9I replicated both Table 3 and Table 4, using an alternative classification method for states. Rather than using
Table 4: Percentage of Democratic Delegates Year Moderate/Conservative Liberal
1976 46.42 53.58
1984 52.02 47.98
1988 52.56 47.44
1992 53.03 46.97
2000 52.66 47.34
2004 53.05 46.95
2008 53.71 46.29
2012 52.38 47.62
2016 53.02 46.98
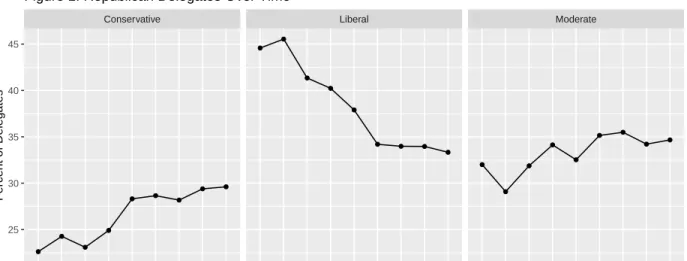
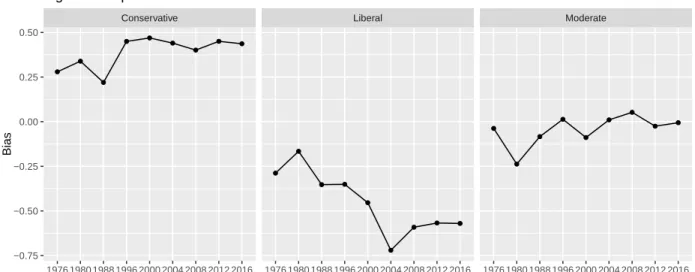
In order to demonstrate support for Hypothesis 3, that, over time, the percentage of delegates apportioned by both national parties has increasingly favored the ideological extreme of their party, I show this trend in Figures 1 and 2 below. Figure 1 shows the trend among Republicans and Figure 2 among Democrats. Figure 1 shows support of this hypothesis among Republicans, as the percent of Republican delegates coming from liberal states was around 45 percent. This percentage has fallen, steadily over time, reaching a new low in 2016, with less than 35 percent of Republican delegates being apportioned to liberal states. Conversely, the percentage of Republican delegates apportioned to conservative states has gradually increased over time, with a low of 25 percent in 1976, and reaching a new high in 2016, just under 30 percent. The number of delegates awarded to moderate districts has apparently slightly increased as well, however numerous changes occur, likely as a reaction to the Republican nominee winning or losing these states in the previous election.
Figure 2 demonstrates the change (or lack there of) of the percentage of delegates apportioned by the Democratic National Committee to liberal, moderate, and conservative states. The national Democratic Party has had little variation in the percent of delegates apportioned to each type of state, consistently over representing liberal states, and under representing conservative states. I find preliminary support for Hypothesis 3 with the Republican National Committee’s apportionment, but not with the Democratic National Committee from the above figures.
Conservative Liberal Moderate
1976 1980 1988 1996 2000 2004 2008 2012 2016 1976 1980 1988 1996 2000 2004 2008 2012 2016 1976 1980 1988 1996 2000 2004 2008 2012 2016 25
30 35 40 45
Year
P
ercent of Delegates
Figure 1: Republican Delegates Over Time
Figure 1: Republican Delegates Over Time
Conservative Liberal Moderate
1976 1984 1988 1992 2000 2004 2008 2012 2016 1976 1984 1988 1992 2000 2004 2008 2012 2016 1976 1984 1988 1992 2000 2004 2008 2012 2016 25
35 45 55
Year
P
ercent of Delegates
Figure 2: Democratic Delegates Over Time
Conservative Liberal Moderate
1976 1980 1988 1996 2000 2004 2008 2012 2016 1976 1980 1988 1996 2000 2004 2008 2012 2016 1976 1980 1988 1996 2000 2004 2008 2012 2016 −0.75
−0.50 −0.25 0.00 0.25 0.50
Year
Bias
Figure 3: Republican Bias Over Time
Figure 3: Republican Bias Over Time
a measure of ‘bias’ in delegate apportionment by both parties, in which I subtracted the population percentage of the United States for each state from the percentage of delegates allocated by each party. A more negative bias means that the national party is apportioning fewer delegates to states than would be expected if delegates were allocated solely on population alone. This bias is generated by the ‘partisan loyalty’ component of delegate apportionment discussed earlier, in which states are rewarded with more delegates if they have a history of electing and supporting Republican/Democratic candidates. Figure 3 above shows the average bias in conservative, liberal, and moderate states that the Republican Party has instituted in their delegate apportionment process.
Conservative Liberal Moderate
1976 1984 1988 1992 2000 2004 2008 2012 2016 1976 1984 1988 1992 2000 2004 2008 2012 2016 1976 1984 1988 1992 2000 2004 2008 2012 2016 −0.2
−0.1 0.0 0.1 0.2
Year
Bias
Figure 4: Democratic Bias Over Time
Figure 4: Democratic Bias Over Time
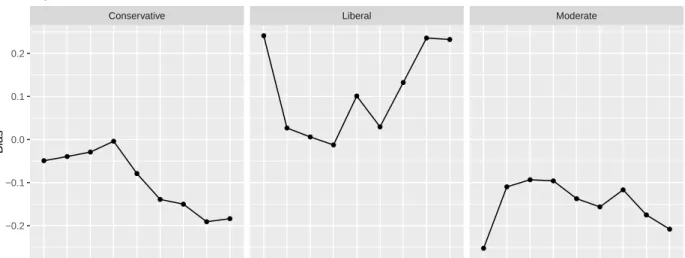
Figure 410 above shows the Democratic Party’s bias towards or against conservative, liberal, and moderate states in their apportionment of delegates to state delegations, similar to Figure 3 for Republicans. Once again, I find support for Hypothesis 3 as the average bias against conservative states in Democratic nomination contests has steadily been increasing, from near zero in the 1980’s and early 1990’s to -0.2 percent in 2016. Liberal states have been more advantaged over time with a steady increase of bias in favor of liberal states around zero in the late 1980’s and reaching a new high in the 2012 and 2016 cycles of 0.2. An interesting finding evident in Figure 4 is that the Democratic National Committee has also been relatively biased against moderate states over time, as well.
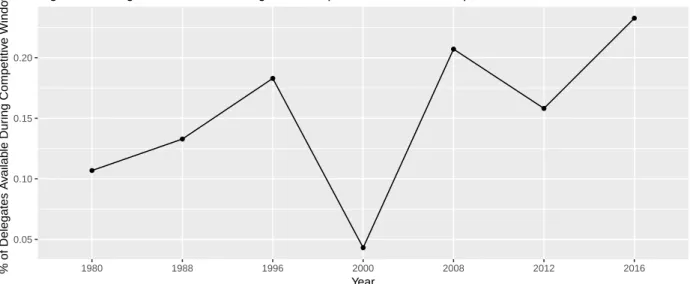
Lastly, I examine my fourth hypothesis (H4), to determine whether the percentage of delegates from liberal/conservative states available during the competitive window of the primary has increased over time, thus drawing more attention and importance to these ideological outliers. Figure 5 below shows the percentage of delegates from conservative states that are able to be won in the competitive window of the Republican nomination cycle over time.
Figure 5 shows no real discernible pattern with the inclusion of the 2000 primary, a short primary in which George Bush was able to win rather quickly. When omitting 2000, however, an
10
0.05 0.10 0.15 0.20
1980 1988 1996 2000 2008 2012 2016
Year
% of Delegates A
v
ailab
le Dur
ing Competitiv
e Windo
w Figure 5: Delegates Available During The Competitive Window of Republican Nominations
Figure 5: Delegates Available During the Competitive Window of Republican Nominations
argument could be made that the percentage of conservative delegates at play in the Republican nomination has increased over time, reaching a peak in 2016 of over 20 percent.
0.30 0.35 0.40 0.45
1984 1988 1992 2004 2008 2016
Year
% of Delegates A
v
ailab
le Dur
ing Competitiv
e Windo
w Figure 6: Delegates Available During The Competitive Window of Democratic Nominations
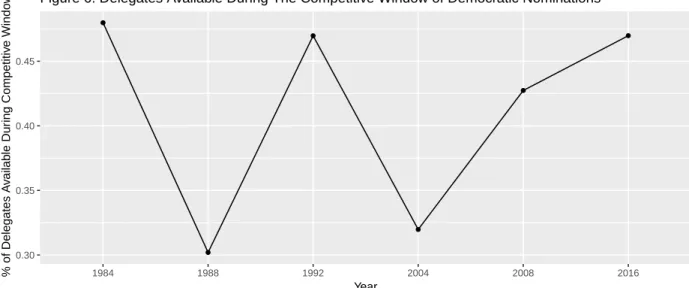
Figure 6: Delegates Available During the Competitive Window of Democratic Nominations
DISCUSSION AND IMPLICATIONS
To review my findings, I find support for Hypothesis 1, that as candidates become more ideologically dissimilar from the primary state they are competing in during a presidential primary, they will see a statistically significant reduction in vote share within that state. When looking at this analysis by party, however, this appears to be largely a Republican phenomenon, while the distance variable for Democrats is not statistically significant.
I use descriptive statistics to show support for my second hypothesis, that the number of delegates available to candidates in both parties is significantly higher among moderate states and states of the opposite ideological leaning than of states that represent the ideological extreme of a respective party. This begins to show incentives for moderation among primary candidates.
could be made that this has happened in the Republican Party, however, the 2000 nomination complicates this argument.
CONCLUSION
Overall, while the 2016 Republican nomination cycle was surprising to many, I argue that it shouldn’t have been so. The nomination seemed to be the result of a culmination of a decades long process of devaluing one portion of the primary electorate (liberal states), and overvaluing another (conservative states). By doing so, both parties, but particularly the Republican Party, incentivized extremism among candidates by signaling to campaigns that they should spend more time and campaign resources in ideologically similar states. The partisan loyalty component of delegate apportionment by national parties has reinforced polarization within the electorate, and has led to this increase of influence by ideologically extreme states. I do not discount the role that candidates play in this scenario, nor the role of voters. I am simply making the argument that party elites should not be surprised that ideological extremity has arisen in recent presidential nominations, where it lay dormant for quite some time, given the path the parties have followed to choose their nominee. This could become even more consequential in a future primary in which the winner is not clearly known following the primary cycle, or a scenario in which no candidate receives a majority of delegates on the first ballot. Improper delegate apportionment could prove the difference between the parties nominating candidates with broad appeal or nominating an ideologue who a large portion of the electorate does not like.
APPENDIX
0.3 0.4 0.5 0.6 0.7
−0.2 0.0 0.2 0.4
American Ideology Project Score
P
ar
ty Presidential V
ote Share
2016 Relationship Between Democratic Presidential Vote Share and AIP Scores
0.3 0.4 0.5 0.6
−0.2 0.0 0.2 0.4
American Ideology Project Score
P
ar
ty Presidential V
ote Share
2016 Relationship Between Republican Presidential Vote Share and AIP Scores
Figure 8: 2016 Relationship Between Republican Presidential Vote Share and AIP Scores
0.3 0.4 0.5 0.6 0.7 0.8
−1.0 −0.5 0.0
American Ideology Project Score
P
ar
ty Presidential V
ote Share
2004 Relationship Between Democratic Presidential Vote Share and AIP Scores
0.1 0.2 0.3 0.4 0.5
−1.0 −0.5 0.0
American Ideology Project Score
P
ar
ty Presidential V
ote Share
2000 Relationship Between Republican Presidential Vote Share and AIP Scores
Table 5: Candidate, Election Cycle, and Dynamic CFScores, Part 1 Candidate Year Dynamic CFScore
Dole, Bob 1996 0.62
Buchanan, Pat 1996 1.28
Forbes, Steve 1996 0.72
Alexander, Lamar 1996 0.91
Keyes, Alan 1996 1.44
Clinton, Bill 1992 -0.59
Brown, Jerry 1992 -0.48
Tsongas, Paul 1992 -0.66
Harkin, Tom 1992 -0.79
Kerrey, Bob 1992 -0.64
Bush, George HW 1988 0.80
Dole, Bob 1988 0.50
Robertson, Pat 1988 1.37
Kemp, Jack 1988 0.73
Dukakis, Michael 1988 -0.70
Jackson, Jesse 1988 -0.88
Gore, Al 1988 -0.44
Simon, Paul 1988 -0.73
Gephardt, Dick 1988 -0.32
Hart, Gary 1988 -0.68
Mondale, Walter 1984 -0.66
Hart, Gary 1984 -0.67
Jackson, Jesse 1984 -0.88
Glenn, John 1984 -0.21
McGovern, George 1984 -0.86
Reagan, Ronald 1980 0.98
Bush, George HW 1980 0.81
Anderson, John 1980 -0.57
Baker, Howard 1980 0.75
Connally, John 1980 0.93
Carter, Jimmy 1980 -0.27
Kennedy, Ted 1980 -0.69
Table 6: Candidate, Election Cycle, and Dynamic CFScores, Part 2 Candidate Year Dynamic CFScore
Kerry, John 2004 -0.94
Edwards, John 2004 -0.92
Dean, Howard 2004 -1.40
Lieberman, Joe 2004 -0.60
Clark, Wesley 2004 -1.14
Obama, Barack 2008 -1.22
Clinton, Hillary 2008 -1.05
Edwards, John 2008 -1.11
McCain, John 2008 1.05
Huckabee, Mike 2008 1.24
Romney, Mitt 2008 1.09
Paul, Ron 2008 1.56
Romney, Mitt 2012 0.83
Gingrich, Newt 2012 1.39
Santorum, Rick 2012 1.30
Paul, Ron 2012 1.59
Clinton, Hillary 2016 -1.20
Sanders, Bernie 2016 -1.60
Trump, Donald 2016 1.44
Cruz, Ted 2016 1.47
Rubio, Marco 2016 1.09
Kasich, John 2016 0.80
Carson, Ben 2016 1.49
Bush, Jeb 2016 0.90
Christie, Chris 2016 0.61
Gilmore, Jim 2016 1.06
Fiorina, Carly 2016 1.21
Bush, George 2000 0.85
McCain, John 2000 0.54
Keyes, Alan 2000 1.42
Forbes, Steve 2000 1.01
Table 7: Percentage of Republican Delegates Year Moderate/Liberal Conservative
1976 88.62 11.38
1980 87.06 12.94
1988 88.56 11.44
1996 88.90 11.10
2000 85.53 14.47
2004 85.13 14.87
2008 85.33 14.67
2012 84.11 15.89
Table 8: Percentage of Democratic Delegates Year Moderate/Conservative Liberal
1976 75.61 24.39
1984 78.49 21.51
1988 78.82 21.18
1992 79.27 20.73
2000 79.06 20.94
2004 79.20 20.80
2008 79.61 20.39
2012 79.85 20.15
REFERENCES
Aldrich, John and John Griffin. 2018. Why Parties Matter: Political Competition and Democracy
in the American South. University of Chicago Press.
Bonica, Adam. 2016. Database on Ideology, Money in Politics, and Elections: Public version 2.0. Stanford University Libraries.
Carmines, Edward and James Stimson. 1989. Race and the Transformation of American Politics. Princeton University Press.
Cohen, Marty, David Karol, Hans Noel and John Zaller. 2009. The Party Decides: Presidential
Nominations Before and After Reform. University of Chicago Press.
Downs, Anthony. 1957. An Economic Theory of Democracy. New York: Harper.
Fiorina, Morris and Matthew Levendusky. 2006. “Disconnected: The Political Class Versus the People.” Red and Blue Nation1:49–71.
Geer, John. 1986. “Rules Governing Presidential Primaries.”The Journal of Politics48(4):1006–1025. Geer, John. 1988. “Assessing the Representativeness of Electorates in Presidential Primaries.”
American Jouranl of Political Science pp. 929–945.
Gurian, Paul-Henri. 1986. “Resource Allocation Strategies in Presidential Nomination Campaigns.”
American Journal of Political Science 30(4):802–821.
Jewitt, Caitlin. 2014. “Packed Primaries and Empty Caucuses: Voter Turnout in Presidential Nominations.” Public Choice160(3/4):295–312.
Kenney, P.J. 1983. “Explaining Turnout in Gubernatorial Primaries.”American Politics Research
11:315–326.
Levendusky, Matthew. 2009. The Partisan Sort: How Liberals Became Democrats and Conservatives
Became Republicans. University of Chicago Press.
McKee, Seth and Danny Hayes. 2009. “Polls and Elections: Dixie’s Kingmakers: Stability and Change in Southern Presidential Primary Elections.”Presidential Studies Quarterly39(2):400–417. Miller, Gary and Norman Schofield. 2008. “The Transformation of the Republican and Democratic
Party Coalitions in the U.S.”Perspectives on Politics 6(3):433–450.
Muste, Christopher. 2014. “Reframing Polarization: Social Groups and “Culture Wars”.” Political
Science and Politics47(2).
Norrander, Barbara. 1992. Super Tuesday. Lexington: University Press of Kentucky.
Norrander, Barbara. 1993. “Nomination Choices: Caucus and Primary Outcomes, 1976-88.”
Ameri-can Journal of Political Science 37(2):343–364.
Norrander, Barbara. 2015.The Imperfect Primary: Oddities, Biases, and Strengths of US Presidential
Nomination Politics. Routledge.
Patterson, T.E. 2009. Voter Participation: Records Galore This Time, But What About Next Time?
Washington: Brookings Institute Press.
Ridout, Travis, Brandon Rottinghaus and Nathan Hosey. 2009. “Following the Rules? Candidate Strategy in Presidential Primaries.” Social Science Quarterly.