UTILIZATION OF MICROBIAL SOURCE-TRACKING MARKERS TO INFORM TARGETED REMEDIATION AND PREDICT POTENTIAL PATHOGENS IN HIGH
PRIORITY SURFACE WATERS
Jennifer Gentry Shields
A dissertation submitted to the faculty of the University of North Carolina at Chapel Hill in partial fulfillment of the requirements for the degree of Doctor of Philosophy in the Department of Environmental Sciences and Engineering.
Chapel Hill 2012
©2012
ABSTRACT
JENNIFER GENTRY SHIELDS: Utilization of microbial source-tracking markers to inform targeted remediation and predict potential pathogens in high priority surface
waters
(Under the direction of Jill Stewart)
ACKNOWLEDGEMENTS
TABLE OF CONTENTS
LIST OF TABLES ... xi!
LIST OF FIGURES ... xiii!
LIST OF ABBREVIATIONS ... xiv!
Chapter 1: Introduction and Literature Review...1!
1. Introduction... 1!
2. Research Objectives... 5!
3. Literature Review ... 6!
3.1 Fecal indicator bacteria: fecal coliforms, Escherichia coli, and enterococci ... 6!
3.2 Microbial Source-Tracking Markers ... 10!
3.3 FIB and MST utilization... 26!
3.4 Conclusions ... 35!
3.5 Approach ... 36!
Chapter 2: Microbial Source-Tracking Markers Display a Relationship to Land Use but not Rainfall...49!
1. Introduction... 49!
2. Materials and methods ... 51!
2.1 Study sites and sample collection... 51!
2.2 Detection of MST Species... 54!
2.3 Inhibition Control ... 56!
3. Results ... 59!
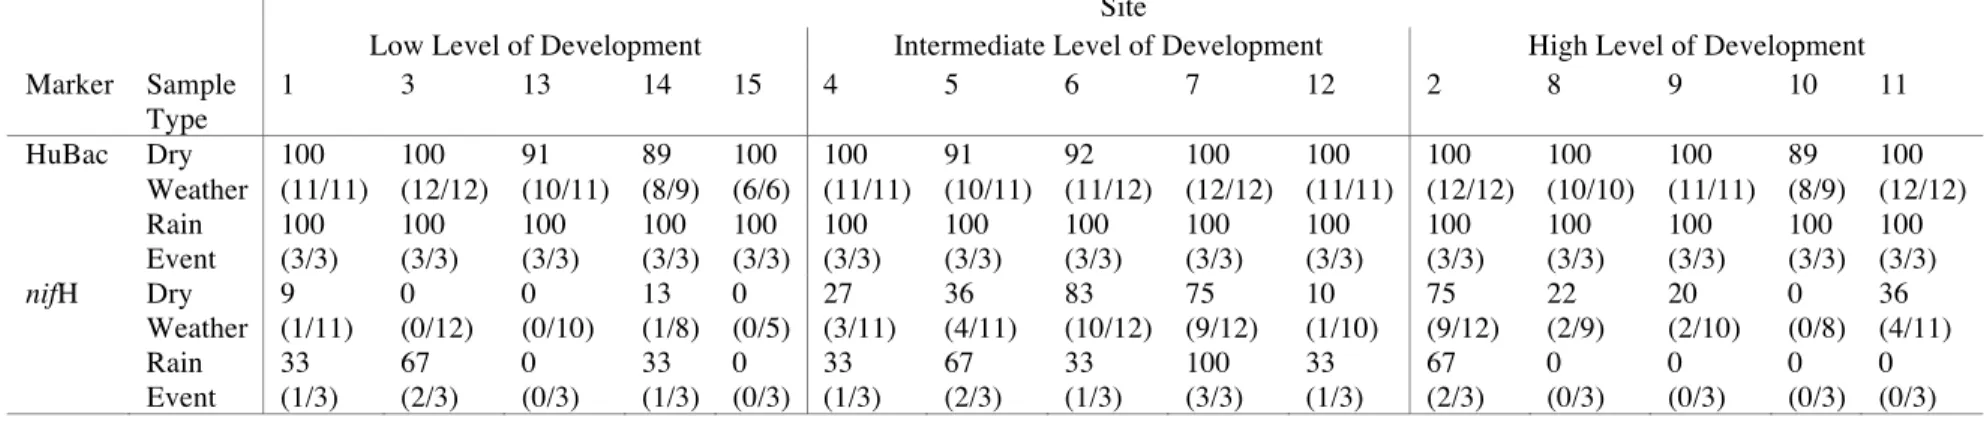
3.1 MST marker detection... 59!
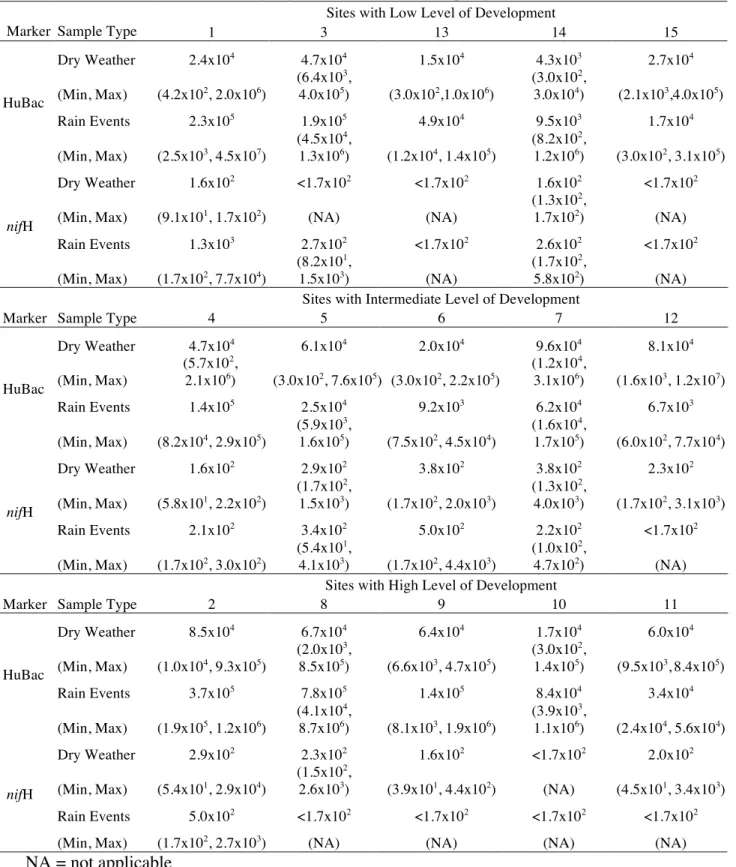
3.2 MST marker concentration... 60!
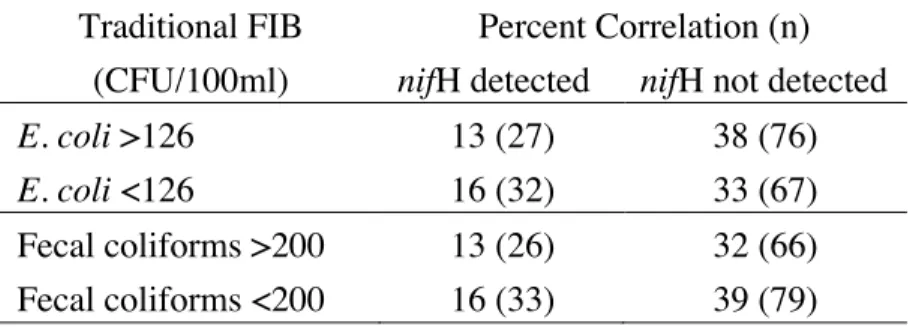
3.3 Comparison to fecal indicator bacteria... 61!
3.4 Virus detection ... 61!
4. Discussion ... 62!
Conclusions... 68!
Chapter 3: Presumptive Antibiotic-Resistant Staphylococcus and Hepatitis E Virus in Waters Proximal to Swine Concentrated Animal Feeding Operations ...74!
1. Introduction... 74!
2. Materials and Methods... 76!
2.1 Study sites and sample collection... 76!
2.2 Enumeration and isolation of antibiotic-resistant Staphylococcus... 77!
2.3 Detection of hepatitis E virus ... 78!
2.4 Coliphage detection and isolation ... 79!
2.5 Typing of F-RNA coliphage isolates... 80!
2.6 Statistical Analyses... 81!
3. Results ... 81!
3.1 Comparison by sample location ... 82!
3.2 Temporal and seasonal distribution... 83!
3.3 Correlation to rainfall ... 84!
3.4 Correlation to fecal indicator bacteria ... 84!
4. Discussion ... 85!
1. Introduction... 100!
2. Materials and Methods... 104!
2.1 Study sites and sample collection... 104!
2.2 Determination of qPCR inhibition level... 106!
2.3 EEM and PARAFAC ... 108!
2.4 Statistical Analyses... 113!
3. Results ... 114!
3.1 Complete Data Set... 114!
3.2 Partial Data Set Using Only Inhibited Samples ... 115!
4. Discussion ... 117!
Conclusions... 121!
Chapter 5: Similar Concentration and Extraction Recoveries Allow for Use of Turnip Crinkle Virus as a Spike and Recovery Control for Enteroviruses in Water...126!
1. Introduction... 126!
2. Materials and methods ... 129!
2.1 Standards ... 129!
2.2 Viral RNA extraction experiments... 132!
2.3 Viral concentration experiments ... 135!
2.4 TCV detection in native samples... 136!
2.5 Statistics... 137!
3. Results ... 137!
3.1 RT-qPCR efficiency ... 137!
3.2 Determination of viral extraction efficiencies... 138!
3.3 Concentration and extraction efficiencies of viruses in water and wastewater samples... 139!
4. Discussion ... 140!
Conclusions... 146!
Chapter 6: Conclusions ...152!
LIST OF TABLES
Table 1.1. Sensitivities and specificities for Microbial Source Tracking
Assays ...42!
Table 2.1. Percent of samples positive for Bacteroides sp. (HuBac) or M.
smithii (nifH) at each site. ...70!
Table 2.2. Significant correlations between MST markers and land use
using the nonparametric Spearman Rank method. ...71!
Table 2.3. Geometric mean concentrations of Bacteroides sp. (HuBac) and M. smithii (nifH) markers at each site during dry weather and
rain sampling events. ...72!
Table 2.4. Agreement between regulatory thresholds for the traditional fecal indicator bacteria (FIB), E. coli and fecal coliforms, and
presence of the M. smithii nifH sewage markers. ...73! Table 3.1. Percentage of surface water samples positive for
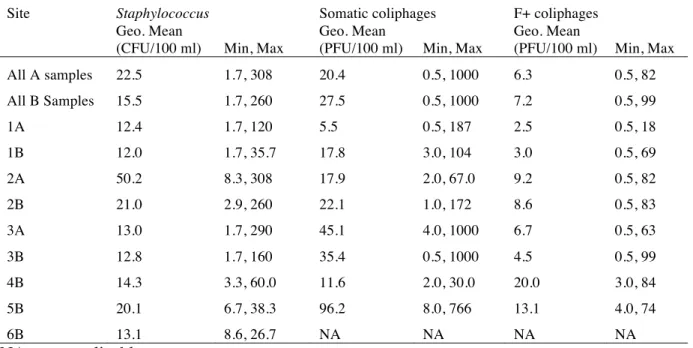
antibiotic-resistant Staphylococcus, somatic coliphages, and F+
coliphages by site...94!
Table 3.2. Geometric mean concentrations of antibiotic-resistant Staphylococcus (CFU per 100 ml) and coliphages (PFU per
100 ml) at each site. ...95! Table 3.3. Water samples positive for F-RNA coliphages. ...96! Table 3.4. Geometric mean concentrations of Staphylococcus (CFU per
100 ml) and somatic and F+ coliphages (PFU per 100 ml) by
season...97! Table 3.5. Significant Spearman Rank correlationcoefficients of
Staphylococcus and somatic and F+ coliphage concentrations
with 24- and 48-hour antecedent rainfall amounts. ...98!
Table 3.6. Significant Spearman Rank correlation coefficients between Staphylococcus or somatic and F+ coliphage concentrations
and fecal indicator bacteria. ...99!
Table 4.1. Fluorescence characteristics of component EEMs from
Table 4.2. Significant Spearman correlation coefficients between qPCR
inhibition and dissolved organic matter (DOM) for full dataset...124! Table 4.3. Significant Spearman correlation coefficients between qPCR
inhibition and dissolved organic matter (DOM) in inhibited
sample dataset. ...125! Table 5.1. Primer and probe identities, target genes, sequences, and
amplicon lengths for qPCR assays used in this study...147!
Table 5.2. Viral concentrations used for spiking, recovered concentrations post-spiking, percent lost (% loss), and percent recovered (% recovered) for extraction and RT-qPCR of echovirus 12, turnip
crinkle virus, and salmon sperm DNA...148!
Table 5.3. Viral concentrations used for spiking, recovered concentrations post-spiking, percent lost (% loss), and percent recovered (% recovered) for concentration in deionized water, extraction, and
RT-qPCR of echovirus 12 and turnip crinkle virus. ...149! Table 5.4. Viral concentrations used for spiking, recovered concentrations
post-spiking, percent lost (% loss), and percent recovered (% recovered) for concentration in environmental water,
extraction, and RT-qPCR of echovirus 12 and turnip crinkle
virus...150! Table 5.5. Viral concentration used for spiking, recovered concentration
post-spiking, percent lost (% loss), and percent recovered (% recovered) for concentration in sewage influent, extraction, and
LIST OF FIGURES
Figure 1.1. Schematic representation of common methods for tracking
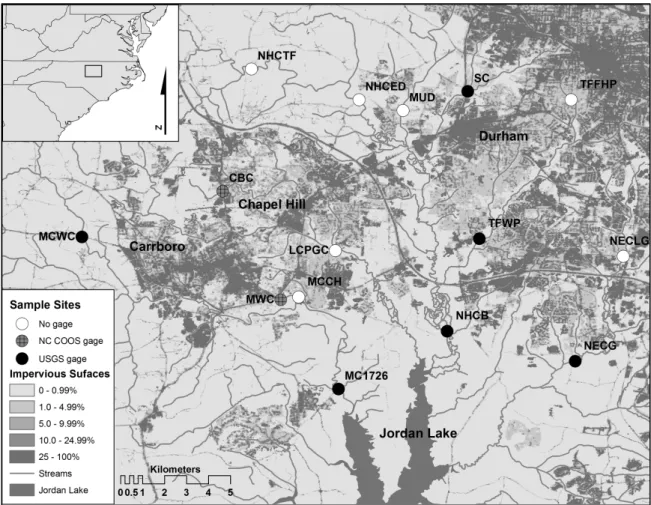
sources of fecal pollution using microbial analyses ...11! Figure 1.2. Characteristics of an ideal vs. a useful MST marker...15! Figure 2.1. Study area showing sampling points along tributaries of Jordan
Lake, N.C. (USA)...52!
Figure 5.1. RT-QPCR Standard curves for (a) enterovirus using an Echovirus 12 DNA transcript and (b) turnip crinkle virus
LIST OF ABBREVIATIONS
AWQC: ambient water quality criteria CWA: Clean Water Act
DI: deionized
DOC: dissolved organic carbon DOM: dissolved organic matter EEM: Emission-excitation matrix EPA: Environmental Protection Agency EV: enterovirus
FIB: fecal indicator bacteria GI: gastrointestinal
MST: microbial source tracking
NPDES: National Pollutant Discharge Elimination System NPS: nonpoint source
PARAFAC: parallel factor analysis PCR: polymerase chain reaction PS: point source
qPCR: quantitative polymerase chain reaction / real-time polymerase chain reaction RT-PCR: reverse transcription polymerase chain reaction
RT-qPCR: reverse transcription quantitative polymerase chain reaction RWQC: recreational water quality criteria
Chapter 1: Introduction and Literature Review
1. Introduction
To protect the public from recreational waterborne illness, the U.S.
Environmental Protection Agency (EPA) has established recommended water quality criteria, including the Ambient Water Quality Criteria (AWQC) in 1986 (1986) and the new Recreational Water Quality Criteria (RWQC; USEPA, 2012) to be adopted October 2012. If adopted by states as a water quality standard, the RWQC can be applied to other Clean Water Act (CWA) programs, including National Pollutant Discharge Elimination System (NPDES) permits, water body assessments to determine use attainment, and development of Total Maximum Daily Loads (TMDLs), in addition to beach monitoring and notification programs.
Both the AWQC (1986) and the RWQC (2012) utilize fecal indicator bacteria (FIB), specifically enterococci and E. coli, to signify when the risk of acute
gastrointestinal (GI) illness exceeds an acceptable level. FIB are utilized because they are thought to indicate the presence of fecal matter and, potentially, pathogens in surface waters. FIB are easier and cheaper to detect than pathogens, and epidemiologic studies (e.g., Cabelli, et al., 1982; Dufour, 1984; Haile, et al., 1999; Kay, et al., 1994; Wade, et al., 2008; Wade, et al., 2006) support the use of FIB as predictors of GI rates among swimmers.
there are only a limited number of studies relating human health to contact with water contaminated by non-point source (NPS) runoff (Calderon, et al., 1991; Cheung, et al., 1990; Colford, et al., 2007; Haile, et al., 1999; McBride, et al., 1998; Wiedenmann, et al., 2006). Yet, generating this type of data is imperative because NPS runoff is the major cause of impairment for most US waters (USEPA, 2002). NPS pollution differs
fundamentally from PS pollution in that, unlike PS pollution, for which rates of input and composition are typically known, NPS pollution is often diffuse, intermittent, and
heterogeneous with agricultural, commercial, residential, and wildlife sources all as potential contributors of FIB and pathogens (Schwab, 2007). As a result, NPS pollution frequently carries a complex mixture of animal and/or human fecal material.
This mixture of contamination sources can be challenging for source allocation because enterococci and E. coli are often found in high concentrations in animal feces (see Section 3.1). Inland waters are generally dominated by more rural and agricultural land use and are thought to be primarily impacted by NPS pollution from wildlife and livestock (Dorevitch, et al., 2010). Additionally, FIB have been documented to survive and grow in sediments (Wheeler Alm, et al., 2003; Yamahara, et al., 2009).
Consequently, measuring FIB levels contributes little to our knowledge of the source of contamination (Boehm, et al., 2009). Understanding the sources of fecal contamination is critical for the development of management plans to protect recreational waters. The need to identify the source of fecal pollution in affected watersheds has led to the development of a wide range of microbial source-tracking (MST) methods (Section 3.2).
contributing human pathogens to surface waters. However, it is not yet clear how MST assays relate to measurements of FIB in natural waters impacted primarily by NPS pollution. The objective of this study was to determine whether MST markers can
provide information for source allocation and human pathogen presence in the Cape Fear watershed in North Carolina, a diverse watershed with both highly urbanized areas as well large regions of industrialized agriculture, and whether the MST markers can be utilized in a tiered assessment with FIB.
Insights obtained from the inclusion of MST marker data in watershed-wide sampling studies is hypothesized to identify factors that influence fecal pollution trends in two areas of the Cape Fear basin. Furthermore, the results of this study will illustrate that molecular approaches designed to test for MST markers can be used to improve and prioritize remediation projects and provide a higher level of information toward decision making processes aimed at protecting human health.
2. Research Objectives
1. Elucidate the spatial and temporal trends of source-specific MST
markers in order to prioritize areas for targeted remediation in a mixed-use watershed.
2. Identify whether sites with intense exposure to NPS from agricultural
sources may pose human health risks due to presence of
microorganisms of public health concern in order to inform targeted best management practices.
3. Compare MST markers to FIB indicators to determine whether MST
markers can be used in a tiered assessment.
4. Determine whether the level of inhibition detected in select surface
water samples is related to the presence of detectable dissolved organic matter components in order to determine what types and levels of organics cause PCR inhibition in environmental water samples. 5. Develop and demonstrate proof-of-concept for a novel process control
3. Literature Review
This literature review will summarize the FIB and MST literature in order to
discern the utility of proposed MST markers and to identify approaches for uniting FIB
and MST assays. Section 3.1 will briefly review the traditional FIB, focusing on their
ability to indicate GI illness risk, fecal source, and pathogen presence. Section 3.2 will then review the current MST technologies, beginning with a synopsis of MST methods followed by a review of the MST markers in current use, focusing on their sensitivity, specificity, and correlation to pathogens. This literature review will then try to unite the FIB and MST paradigms in Section 3.3 by comparing two approaches for utilizing MST technologies with FIB and summarizing four potential applications for MST in the water quality monitoring process.
3.1 Fecal indicator bacteria: fecal coliforms, Escherichia coli, and enterococci
Various organisms and groups of organisms have been suggested and used as FIB. This review will only address those recommended by the US EPA, E. coli and enterococci, for use in all surface waters as well as fecal coliforms, which are currently utilized by many states as a water quality standard.
in swimmers was significantly higher than non-swimmers when coliform densities averaged 2,300-2,400 per 100 ml (Stevenson, 1953). The recommended level was based on a statistical relationship to Salmonella, which was detected in 60-100% of samples when the fecal coliform density was greater than 200 colony-forming units (CFU) per 100 ml. A later study (Cabelli, 1983) determined that fecal coliforms were actually a relatively poor indicator of GI illness risk and the US EPA stopped recommending fecal coliforms as a recreational indicator following the study. Nevertheless, many states continue to use fecal coliforms as a water quality indicator.
Besides a poor correlation to GI illness, fecal coliforms have other limitations as fecal indicators. Fecal coliforms cannot distinguish between human and animal
contamination, as they are found in the intestines of all warm-blooded animals, and some fecal coliforms, such as Klebsiella pneumoniae, do not have a fecal source (Knittel, 1975). Fecal coliforms have also been detected and found to survive for extended periods in unpolluted tropical waters, which suggests that fecal coliforms may occur naturally in tropical waters (Roll and Fujioka, 1997).
Fecal coliforms were replaced as a recommended water quality standard in 1986, when the US EPA published its recommended water quality criteria for recreational waters. The new recommendations included the use of Escherichia coli (E. coli) as the preferred FIB for use in fresh water, with levels of 126 CFU per 100 ml (based on the geometric means of at least five samples over a 30-day period) (USEPA, 1986). This standard was based on epidemiological studies that used a prospective epidemiological-microbiological design scheme to find a direct, linear relationship between GI illness and E. coli density (Dufour, 1984). The use of this standard was strengthened by a
meta-analysis of 27 studies, which determined that E. coli was a consistent predictor of GI illness in freshwater: a log (base 10) increase was associated with a 2.12 (95% CI, 0.925– 4.85) increase in relative risk (Wade, et al., 2003).
However, as a coliform bacteria, E. coli has the same limitations as the fecal coliforms, including presence in animals, replication in the environment (Desmarais, et al., 2002; Solo-Gabriele, et al., 2000), and a poor correlation to pathogens, especially enteric viruses (Nasser and Oman, 1999). Wu et al. (2011) found an overall lack of correlation between E. coli and pathogens (OR = 0.52; 95% CI, 0.25-1.06).
The US EPA’s AWQC for recreational waters (1986) also proposed the use of
enterococci as an FIB in marine water and fresh water. The 1986 recommendation was
2003). More recently, studies have found that enterococci measured using quantitative
PCR (qPCR) were positively correlated with swimming-associated GI illness (Wade, et al., 2008; Wade, et al., 2006; Wade, et al., 2010).
Although enterococci may serve as a good indicator of GI illness at sewage-impacted beaches, the bacterium cannot be used to distinguish between human and animal fecal sources. For example, a study in Homosassa, FL found higher numbers of enterococci in a wildlife park than in canals in a residential area utilizing septic systems (Griffin, et al., 2000). Another study in Florida found that one bird fecal event
contributed approximately the same enterococci load as one adult human swimmer (Wright, et al., 2009).
Studies have also found a lack of correlation between enterococci and pathogens, such as enteric viruses, Giardia, and Cryptosporidium (e.g., Bonadonna, et al., 2002; Harwood, et al., 2005; Jiang, et al., 2001). Wu et al. (2011) found no correlation between pathogens and enterococci (OR = 0.47; 95% CI, 0.24-0.94).
In summary, the FIB recommended by the EPA as water quality standards can tell us much about the human health risk, particularly at PS-impacted beaches. In fact, their use in the US has significantly contributed to an overall decrease in recreational
due to the possibility of a non-fecal source (Scott, et al., 2002; Simpson, et al., 2000) and growth in environments such as soil, beach sand, sediments, and bodies of water
(Anderson, et al., 2005; Byappanahalli, et al., 2003a; Byappanahalli, et al., 2003b; Fujioka, et al., 1999; Hardina and Fujioka, 1991; Wheeler Alm, et al., 2003; Whitman, et al., 2003).
Understanding the sources of fecal contamination is critical for effective
management plans to protect recreational waters. The inability to determine the source of fecal pollution has led to a push to develop methods that allow for the reliable
discrimination between human and nonhuman microbial contamination. A wide variety
of microbial, chemical, and eukaryotic source-tracking markers have been proposed, although this review will focus solely on microbial source-tracking (MST) markers.
3.2 Microbial Source-Tracking Markers
MST methods include detection of several types of microbes, including bacteria,
viruses, and protozoa, which are associated with various fecal sources, including humans,
animals, groups of animals, or even specific species.
3.2.1 Overview of MST methods
organism or gene. A schematic representing the various types of MST methods is shown in Figure 1 (Santo Domingo, et al., 2007).
Figure 1.1. Schematic representation of common methods for tracking sources of fecal pollution using microbial analyses (from Santo Domingo, et al., 2007; permission obtained from Elsevier, 2012).
Library-dependent methods are based on the hypotheses that (1) the phenotypic or genotypic attributes of target strains (such as E. coli or enterococci) are host-specific and (2) the phenotypic and genotypic attributes of target strains isolated from environmental samples are similar to those found in host groups (Ahmed, 2007). Library-dependent methods are generally culture-based, including antibiotic-resistance tests and DNA fingerprinting, although they need not be (e.g., community fingerprinting).
concentrations. Another advantage is that library-dependent techniques can be used to classify isolates from multiple fecal sources because they are based on subspecies or strains of bacteria that are associated with specific animal species (Sargeant, et al., 2011).
However, disadvantages to library-dependent methods are that subspecies likely
change with respect to geography, time, rainfall, and habitat (Kuntz, et al., 2003). These
changes require effective libraries to contain a large number of isolates, anywhere from
900-2,000 fecal isolates according to Jenkins et al. (2003). A large library size not only
increases the time and skill required to distinguish species and subspecies, but it also
increases the likelihood of including isolates that occur in the gastrointestinal tract of
multiple host species (Stoeckel and Harwood, 2007; USEPA, 2005), which increases the
complexity of the statistical analyses necessary and decreases the method specificity. In
general, library-dependent methods have performed poorly in comparative studies (Field, et al., 2003; Griffith, et al., 2003; Moore, et al., 2005; Samadpour, et al., 2005; Stoeckel, et al., 2004), and they have been largely supplanted by library-independent methods.
Library-independent methods include both culture-based and non-culture-based assays.
and Levin, 1981; Rhodes and Kator, 1999), bacterial culture-based methods have been largely replaced with molecular methods. Bacterial methods also include an assay that targets the esp gene, a virulence factor in Enterococcus faecium (Scott, et al., 2005). Although final detection involves PCR, a cultivation step is needed to enrich for the low densities of Ent. faecium harboring the esp gene.
Culture-based, library-independent methods also include culture of
bacteriophages, mainly those that infect certain strains of Bacteroides fragilis and F+RNA coliphages. Culturing bacteriophages is relatively inexpensive and does not require advanced expertise, making them broadly available, and methods are available that can be used to enrich for bacteriophages, increasing the number of target
microorganisms. However, an enrichment step only allows for semi-quantitative results and can create a “culture bias” due to differential selection (Stewart-Pullaro, et al., 2006). Other disadvantages to culturing phages for MST include: (1) they can only discriminate between human and non-human sources; (2) they may exhibit differential survival (Brion, et al., 2002; Long and Sobsey, 2004; Schaper, et al., 2002a); and (3) they are irregularly distributed geographically (Payan, et al., 2005).
sensitive than culture-based methods. Additionally, multiple assays targeting various targets can be performed using the same nucleic acid extractions (Santo Domingo, et al., 2007). These extracts can also be preserved for future analyses should more sensitive assays, or assays for additional hosts, become available. However, there are also a number of drawbacks to molecular methods. Detection of specific markers may require concentrating large volumes of water (for viruses) or performing specificity tests (for bacteria such as Bacteroides) (Field and Samadpour, 2007).
While independent methods have generally performed better than library-dependent methods in validation studies, they have a number of disadvantages as well. Most library-independent methods work better for wastewater than for individual fecal samples, as host-specific markers may not be present in every individual. Additionally, there are very few library-independent methods with target species beyond humans and a few domestic animal species. Lastly, while some MST markers have been rigorously investigated, others require further validation before they can be used dependably. 3.2.2 Library-independent MST markers: Performance characteristics
The MST field is an emerging science, and much of the field has focused on the development of new MST markers and the improvement of detection and quantification
methods. Due to an abundance of proposed MST markers, several review articles have
been published (e.g., Field and Samadpour, 2007; Santo Domingo, et al., 2007; Stoeckel
and Harwood, 2007) that describe the ideal characteristics of an MST marker. Reviewing
utilize, these marker characteristics can be a helpful guideline. Moreover, MST marker performance for each of these characteristics will determine what information individual markers can provide when utilized in monitoring studies.
Figure 1.2. Characteristics of an ideal vs. a useful MST marker (Harwood and
Stoeckel, 2011; permission obtained with kind permission of Springer Science and Business Media).
As evaluating each MST marker for all of these characteristics is impractical, this
literature review will focus on three characteristics of an MST marker that will be critical
Multiple cross-validation studies have compared the sensitivities and specificities of select MST markers (e.g., Field, et al., 2003; Griffith, et al., 2009; Griffith, et al., 2003; Harwood, et al., 2009), with varying results (Table 1.1). Some studies have also
determined correlation to pathogens (e.g., Aw and Gin, 2010; Savichtcheva, et al., 2007; Schriewer, et al., 2010; Wu, et al., 2011). This literature review summarizes the data on these two characteristics for the most popular MST methods to help discern what information MST markers can provide in monitoring and assessment.
While MST markers exist that target a number of different sources, this literature
review will focus only on those MST markers with a human target, as all of the MST
markers in this report are either specific to a human-source or discriminate between
human-source and animal-source fecal contamination (data on the sensitivity and
specificity of popular animal-specific MST markers are included in Table 1.1 for
reference). Current human-source MST markers can be divided into those that target
anaerobic bacterial (or archaeal) genes, bacterial toxin/virulence genes, or viruses. Obligate Anaerobes
Bifidobacterium species are anaerobic Gram-positivebacteria belonging to the Actinobacteria group. Bifidobacterium are the first to colonize the infant
digestivetract and provide multiple benefits to the host, including regulationof the gut microflora, enhancement of the immune system,and production of antimicrobial substances and vitamins (Bivati and Mattarelli, 2006).
Ten species of Bifidobacteria have been identified in human fecal material, and four of these, B. adolescentis, B. dentium, B. longum, and B. catenulatum were
considered primarily of human origin (Bonjoch, et al., 2004; Doraj-Raj, et al., 2009;
Lynch, et al., 2002; Nebra, et al., 2003). The sensitivity and specificity of several assays
targeting B. adolescentis range from 67-100% and 84-100%, respectively (Table 1.1). A
newer assay targeting B. catenulatum was the most promising PCR assay in an Irish
evaluation study, exhibiting 100% sensitivity with human sewage samples and a
specificity of 87% (Doraj-Raj, et al., 2009).
Comprehensive studies on the correlation of Bifidobacterium spp. presence with that of pathogens have yet to be performed.
Likely due to this assay’s questionable specificity (Lamendella, et al., 2008) and rapid degradation in the environment, this organism is rarely utilized in more recent source-tracking studies.
By far, the most popular MST methods are those that target the members of the order Bacteroidales, family Bacteroidetes, using the 16S rRNA gene. The genus
Bacteroides, the family, and the order comprise anaerobic fecal bacteria that are abundant
fecal microflora (Madigan, et al., 2003), outnumbering fecal coliforms, E. coli, and Enterococcus spp. Bacteroides spp. are obligate anaerobes, so their ability to persist or
grow in the environment is limited (Fiksdal, et al., 1985; Kreader, 1998). Persistence of Bacteroidales bacteria and genetic markers in the environment have been shown to range
from 1 to 24 days, depending on temperature, the presence of predators, salinity, and
marker used (Bernhard, et al., 2003; Kreader, 1998; Seurinck, et al., 2005; Walters and
Field, 2009).
Multiple human-specific Bacteroidales assays have been developed (Bernhard and Field, 2000a; b; Converse, et al., 2009; Dick and Field, 2004), as well as
Bacteroidales assays that can distinguish between cattle, canine, swine, horse, and elk
feces (Bernhard and Field, 2000b; Dick, et al., 2005a; Dick, et al., 2005b; Layton, et al., 2006; Okabe, et al., 2007). The sensitivity and specificity for many of the human-specific Bacteroidales assays have been examined (Ahmed, et al., 2009; Doraj-Raj, et al., 2009;
Griffith, et al., 2009; Kirs, et al., 2011; Stoeckel and Harwood, 2007). Results indicate that sensitivity and specificity vary widely depending on the assay, method, and location: between 12-100% sensitivity and 0-100% specificity (Table 1.1).
The correlation between Bacteroides sp. and several pathogens has been examined. A study by Schriewer et al. (2010) evaluated the ability of several
Bacteroidales assays (universal, human, dog, and cow) to predict pathogen occurrence.
Bacteroidales 16S rRNA genetic markers were predictive for the occurrence of E. coli
O-157, Salmonella, and the LT and STh genes of E. coli ETEC.
Assays targeting Bacteroidales are currently the most popular source-tracking markers, likely due to the wide range of assays and targets available.
The genus Methanobrevibacter, in the order Methanobacteriales, includes the
human-specific M. smithii and the ruminant-specific M. ruminantium. M. smithii may be
useful as an indicator of sewage and human fecal pollution in the environment because of its host specificity and high abundance in the human intestine. M. smithii is the dominant archaean in the human gut, occurring in concentrations of 107
–1010
per gram of dry weight (Bond, et al., 1971; Lin and Miller, 1998).
An assay developed by Ufnar et al. (2006) that detects the nifH gene of M. smithii was able to detect human fecal contamination in individual fecal samples, sewage, and sewage-contaminated marine water and was negative for uncontaminated marine waters, other fecal samples (cow, sheep, swine, horse, deer, goat, turkey, goose, chicken, and dog), and environmental waters contaminated with bovine waste. This assay was utilized in four other studies and found to be 98-100% sensitive in wastewaters, 9% sensitive in individual fecal samples, 20% sensitive in spiked environmental samples, and 96-100% specific using individual and composite animal fecal samples and water samples
M. smithii presence has not been evaluated for correlation to enteric pathogens.
Results from studies evaluating this marker are promising, but more research is required to further confirm the marker’s sensitivity, specificity, and correlation to pathogens.
Bacterial toxin/virulence genes
Toxin genes of pathogenic FIB strains (e.g., E. coli and enterococci) may also serve as host-specific indicators of fecal pollution. The enterococcal surface protein, esp, of E. faecium, has been proposed as a human-specific indicator of fecal pollution. This
marker has been evaluated in studies with mixed results. The first PCR assay targeting
this gene was positive for 97% of sewage and septic samples and negative for livestock
and bird waste (Scott, et al., 2005), but required a membrane filtration step 48 h before
PCR detection (Scott, et al., 2005). Without the initial enrichment step, the assay’s
sensitivity and percentage of correct classification declined to 4.4 and 5.9%, respectively
(Balleste, et al., 2010). Other studies have found the esp PCR assay to be 90-100%
sensitive to sewage, septic system samples, and sewage-spiked samples and 68-100%
specific to individual fecal and spiked water samples (Ahmed, et al., 2008; Griffith, et al.,
2009; Kirs, et al., 2011). Several recent studies have suggested that the esp gene may not
be exclusive to human fecal pollution (Ballesté, et al., 2010; Byappanahalli, et al., 2008;
Layton, et al., 2009). Due to its required enrichment step and possible lack of specificity,
the esp assay may not serve as an optimal MST marker in environmental monitoring
programs.
Viruses: Bacteriophages and human enteric viruses
indicators of viral pollution because their size, morphology, structure, and behavior in the environment closely resemble that of human enteric viruses (Gerba, 2000). The most popular phages used in current MST studies are the F+RNA coliphages and phages that infect specific strains of B. fragilis.
F+RNA coliphages have been used to predict the source of fecal pollution because animal and human feces contain different serotypes (Scott et al., 2002). Groups I and IV are generally associated with nonhuman animals, while group II isolates are generally associated with human and pig feces, and group III isolates are generally associated with human feces (Griffin, et al., 2001), although some studies have reported that Group II and III genotypes have been identified from a small number of animal-source samples (Schaper, et al., 2002b; Stewart, et al., 2006) and that genotype I has been isolated from municipal sewage (Griffin, et al., 2000; Stewart-Pullaro, et al., 2006). Until recently, relatively few strains were completely characterized, limiting the ability of molecular assays to be sensitive to all members within each genotype. However, Friedman et al. recently characterized 19 F+RNA strains (Friedman, et al., 2009b) and developed new genotype-specific primer sets accordingly (Friedman, et al., 2009a). These new F+RNA assays have yet to be tested for sensitivity and specificity with reference samples.
found to be 100% and 30-100%, respectively, with specificities of 67-100% and 100%, respectively (Table 1.1).
Correlations between coliphages and pathogens have been examined, and positive correlations have been found between somatic coliphages and adenoviruses (Aw and Gin, 2010), enteroviruses (Mocé-Llivina, et al., 2005), and culturable enteric viruses (Payment and Franco, 1993), and between F+ coliphages and noroviruses (Aw and Gin, 2010; Dore, et al., 2000) and adenoviruses (Wu, et al., 2011). A promising coliphage for use as a water quality standard is the F+ coliphage (Havelaar and Pot-Hogeboom, 1988) due to its similarity in size, shape, structure, and genetic makeup to many human enteric viruses. F+ coliphages have been found to be more stable than human enteroviruses in
environmental waters (Sinton, et al., 2002), exhibit high resistance to water purification processes (Kott, et al., 1974), and are resistant to inactivation in natural environments and sewage treatment processes, likely making them conservative indicators for enteric viruses. In their meta-analysis, Wu et al (2011) found that coliphages had a positive correlation to multiple pathogens, with an odds ratio for total coliphages and F+ coliphages of 1.29 (95% CI = 0.82-2.05) and 1.27 (95% CI = 0.48-3.35), respectively.
predictive of human fecal contamination. One study found that the sensitivity and specificity of bacteriophages infecting B. thetaiotamicron were among the most
predictive of human wastewater, and were included in a model that was 100% predictive of the fecal source in wastewaters (Blanch, et al., 2006). A second study, which analyzed river water, municipal wastewater treatment effluent, and animal fecal samples for multiple indicators, found that bacteriophages infecting strain GB124 were present in all municipal wastewaters and were not detected in fecal samples from animals (Table 1.1) (Ebdon, et al., 2007).
Correlation have been demonstrated between the presence of B. fragilis
bacteriophage and enteric viruses and to detectable enteric virus genomes (Armon and Kott, 1996; Gantzer, et al., 1998). B. fragilis phage also persist comparable to or longer than enteric viruses, coliphages, and polioviruses in surface waters (Chung and Sobsey, 1993).
Viral pathogens themselves are also a promising tool for assessing water quality. Over 100 types of pathogenic viruses are excreted in human and animal wastes (Melnick, 1984), and they are shed in extremely high numbers: typically between 105
and 1011 virus particles per gram of stool from infected hosts (Farthing, 1989). Enteric viruses are known to cause a significant portion of waterborne disease (Fogarty, et al., 1995), but viruses are also believed to be responsible for a significant percentage of waterborne outbreaks in which the etiological agent is unknown. Commonly studied groups of enteric viruses include Picornaviridae (polioviruses, enteroviruses, coxsackieviruses, hepatitis A virus, and echoviruses), Adenoviridae (adenoviruses), Caliciviridae
While the use of animal-specific viruses as MST markers has been proposed, the majority of research has focused on the use of human-specific viruses. These include human polyomaviruses, adenoviruses, enteroviruses, and noroviruses.
Human polyomaviruses (HPyVs) are nonpathogenic to individuals with a
healthy immune system and infect a large portion of the human population (Behzad-Behbahani, et al., 2004; Knowles, et al., 2003). Nested PCR (McQuaig, et al., 2006) and qPCR assays (McQuaig, et al., 2009) that detect both JCV and BKV species have been designed and tested to have 50-100% sensitivity in fecal, wastewater, and blind samples, and 100% specificity in non-human fecal samples (Table 1.1).
Human adenoviruses are frequently found in urban rivers associated with human
fecal contamination (Castingnolles, et al., 1998; Chapron, et al., 2000; Tani, et al., 1995). The sensitivities of these assays range from 40-92%, while the specificities of some have been calculated between 67-100% (Table 1.1).
Human enteroviruses, including poliovirus, echovirus, and Coxsackie A and B viruses, have been found in activated sludge, sewage outfalls, and fresh and marine waters associated with human fecal contamination (Griffin, et al., 1999; Jiang, et al., 2001; Kopecka, et al., 1993; Noble and Fuhrman, 2001; Reynolds, et al., 1998). A microbial source-tracking comparison study (Noble, et al., 2003) found that one
enterovirus RT-PCR assay (Tsai, et al., 1993, with minor modifications) had a sensitivity of 38% and a specificity of 100% (Table 1.1). Similarly, a quantitative
Noroviruses may also serve as possible MST markers, due to the fact that several norovirus genogroups are specific to humans (only genogroups I, II, and IV have been detected in humans, though genogroups I and II predominantly cause gastrointestinal disease) (Koopmans, 2002), and because norovirus genogroups I and II are thought to be the leading cause of viral gastroenteritis worldwide (Atmar, 2006). Noroviruses have been detected in treated wastewaters and surface waters (Astrom, et al., 2009; da Silva, 2007; Lodder and de Roda Husman, 2005; Ueki, et al., 2005). A methods comparison study (Griffith, et al., 2009) found norovirus assays to have a 0-80% sensitivity in sewage-spiked samples and 100% specificity to gull-feces spiked seawater (Table 1.1).
The advantages of utilizing pathogenic viruses for water quality management are significant. Viruses are very host specific; thus, detection of various viral targets can solidify the determination of the source of contamination. Quantification in stormwater and contaminated surface waters may be an important tool for quantifying contaminant load and potential human health risk, respectively. On the other hand, pathogenic viruses generally infect only a small percentage of any given population, making them relatively rare targets. Additionally, before consistent use in field studies, viral detection assays will require reliable process controls, as the required concentration and extraction steps
generally have low and variable recoveries. Summary
Currently, there is no consensus among researchers or regulatory agencies regarding the best MST markers. No single technique is capable of determining all
pathogens, the choice of marker will provide different types of information. For example, viral markers, such as enteroviruses and adenoviruses, tend to have relatively high false-negative rates in individual fecal samples, leading to a low sensitivity, but their narrow host range allows them to be exceedingly specific. Thus, they can more definitively indicate the source of fecal pollution, but they cannot reliably rule out the presence of human sewage. Conversely, markers such as human-associated Bacteroidales have a lower average specificity than viruses, but their overwhelming numbers in human hosts allow for increased sensitivity. Moreover, each of the markers mentioned above have varying levels of precision. For examples, coliphages can distinguish between human and non-human fecal contamination, whereas different Bacteroides markers may be specific to animal species (e.g., elk, dog, human). Lastly, only some MST markers have been evaluated for correlation to pathogens. It is critical that water quality managers using these techniques have a good understanding of the abilities and limitations of MST markers.
3.3 FIB and MST utilization
Federal recommendations for and state agency approaches to microbial water quality testing will continue to primarily utilize FIB standards (USEPA, 2012). The results of these standards will likely be used as the sole or principal tool for mitigation of water pollution, even though research indicates that the presence, source, and public health significance may not be reliably assigned using fecal indicator organism
remediation when those same standards are not met (Kinzelman, et al., 2011). For example, failure to meet FIB-based water quality standards results in impairments of water bodies based on their designated use, but it does not provide adequate data for developing a pollution reduction strategy, implementing BMPs, or effectively allocating NPS contributions in the development of TMDLs. Thus, according to Gawler et al. (2007), monitoring programs would benefit by combining MST assays with FIB standards. Incorporation of MST data with FIB standards would enable inclusion of historical data relating FIB to human health risk. On the other hand, many researchers believe that problems with the traditional FIB markers outweigh any benefits in their continued use as water quality indicators. It may be more practical to completely replace FIBs with the newer MST methods, as some of these markers have shown correlations to health. Nevertheless, because state regulatory agencies will have the option to continue utilizing culture-based FIB methods, many will continue to utilize these traditional methods exclusively. Thus, we propose that regulatory agencies would do well to incorporate MST assays with the traditional FIB assays rather than utilize FIB markers alone. Incorporation of MST markers with FIB may enhance monitoring data, assist in the development of TMDLs and BMPs by elucidating pollutant sources, and may be utilized to gauge water-quality improvements, and possibly gauge the risk of fecal pollution (Gawler, et al., 2007).
3.3.1 MST utilization: Toolbox and tiered approaches
The two most popular methodologies for combining FIB and MST indicators are the “toolbox” and “tiered assessment” approaches.
The toolbox approach utilizes multiple assays to allow for a more accurate
interpretation of the data. Groups of MST markers that are optimized for different project goals, locations, etc., are on hand and ready for use as specific situations demand
(Harwood and Stoeckel, 2011). An example of utilization of the toolbox approach is the study by Vogel et al. (2007), which used multiple MST assays, including E. coli rep-PCR, coliphage typing, and Bacteroidales16S rDNA to determine the source of fecal contamination in a Nebraska watershed. The use of multiple assays allowed for increased confidence in the interpretation of assay results and prevented erroneous results when one of the assays was not detected.
Thus, an advantage to this approach is an increased correct classification of sources over using only one MST assay. The use of multiple methods for detection of contamination from one source can be used to support one another, alleviating the uncertainty of results from imperfections in all current MST methods (Harwood and Stoeckel, 2011). Another advantage of the toolbox approach is that as MST markers would be utilized throughout a study, data on the spatial, climate, and seasonal trends of MST markers would be available, allowing for better interpretation of changes in marker concentrations following remediation projects (Kinzelman, et al., 2011).
recommendations will become national recommendations for all surface waters
designated for primary contact recreation (swimming, bathing, surfing) (USEPA, 2012), the limited resources, especially manpower and financial resources, of regulatory
agencies are likely to be spread thin across water bodies with varying actual use levels. For example, monitoring schemes that aim to fully characterize a water body may require temporally and spatially exhaustive sampling plans. These resource-intensive
requirements may preclude a monitoring agency from utilizing expensive assays as continual monitoring tools.
Given these advantages and disadvantages, the use of a toolbox approach may be best suited to remediation projects, as the comprehensive data would allow for better interpretation of remediation projects post-implementation.
In contrast to the toolbox approach, a tiered approach utilizes multiple levels of monitoring, generally employing lower cost methods that broadly measure
contamination, such as FIB, as continual monitoring tools followed by more expensive, technically demanding tools, such as MST markers, in targeted areas where higher levels of FIBs are detected (Harwood and Stoeckel, 2011). A tiered approach was utilized by Noble et al. (2006) to assess and quantify fecal contamination in Santa Monica Bay, California. The study employed E. coli, Enterococcus sp., Bacteroides sp., and enteroviruses to identify sources of FIB in an urban watershed.
culture-based FIB methods (Griffith and Weisberg, 2011) and limited state and local budgets, the cost savings in using MST assays only sparingly could be a pivotal factor for monitoring agencies deciding between tiered and toolbox approaches. It is important to note, however, that the proposed RWQC allow for use of qPCR-based assays for
Enterococcus as a regulatory standard (USEPA, 2012). If monitoring agencies choose to
adopt molecular methods for water quality standards, initial monetary investment costs for assays targeting additional markers, such as those for MST markers, would be minimal. However, the initial monetary jump from culture-based detection of FIB to molecular-based detection may be beyond the reach of many monitoring agencies: one recent estimate for initiating qPCR in a laboratory, including capital costs associated with buying all necessary equipment and revamping old laboratory space to new molecular sample requirements (e.g., qPCR hoods), was approximately $100K (Griffith and Weisberg, 2011).
A major disadvantage for the tiered approach is that a lack of association between first-tier and second-tier markers (e.g., FIB and MST markers) could drastically reduce the approach’s ability to identify and reduce fecal pollution sources. Another
disadvantage of this approach is that use of the marker just before and after remediation may not reveal much about an increase or decrease in a particular source, as the seasonal, climate, and spatial variability of an MST marker will not be defined (Benham, et al., 2011).
3.3.2 Potential applications of MST
The use of a tiered or toolbox approach will likely be dependent on how an MST method is to be utilized for water quality monitoring. Harwood and Stoeckel (2011) have proposed that there are four potential applications for MST in water quality monitoring:
(1) Assessing the source(s) of fecal contamination in recreational or drinking waters;
(2) Prioritizing impaired water bodies for total maximum daily load (TMDL) implementation (or other interventions);
(3) Apportioning sources for TMDL plans; and
(4) Assigning or relieving responsibility for fecal pollution.
One application for MST markers in a monitoring program is (1) assessing sources of fecal contamination in recreational water. At present, water quality monitoring is done with the use of FIB, which cannot indicate the source of fecal contamination. Few monitoring agencies currently integrate MST assays with FIB as a first step in water quality monitoring. However, this may change as MST methods develop and become standardized.
The second application for which MST markers can be utilized is (2) prioritization of impaired water bodies for total maximum daily load (TMDL)
implementation or other interventions. Once water bodies are listed as impaired (as determined by FIB concentrations above regulatory standards), states must develop a TMDL to guide remediation efforts. As approximately 40% of assessed surface waters in the US are impaired (USEPA, 2009), prioritizing waterways for TMDL interventions is
critical. A practical approach for ranking water bodies was outlined by Wapnick et al.
(2009). This “weight of evidence approach,” based on the World Health Organization’s
pollution sources and human use. It facilitates decision-making about which areas will be investigated by MST methods and which will receive more limited attention and
resources.
The third application for which MST markers can be utilized is (3) source
apportionment for TMDL plans. This application is primarily concerned with
producing pollutant load reductions in order to achieve water quality monitoring standards. As these standards are generally based upon the 1986 USEPA
recommendations for recreational water quality utilizing FIB (USEPA, 1986; 2003), this application is primarily concerned with reducing these FIB to acceptable levels. Given that the project will need to apportion contributions from various fecal sources,
quantitative markers will be necessary to identify the sources of FIB loading (Harwood and Stoeckel, 2011). These quantitative measurements will need to be connected to assessments of flow, fate and transport, and seasonal changes, as well as assessments of antecedent rainfall, groundwater levels, etc. for sufficient power of the MST markers to allocate sources of FIB loading.
necessary to determine the relative sources of fecal loading, as will highly precise markers that can identify the species of domesticated animal or even a specific herd or flock that is the major contributor of fecal pollution (USEPA, 2005).
For applications 3 and 4, correlation of the MST markers with FIB standards is preferred in order to allocate the sources of FIB to different sources, especially during certain times (e.g., particular storm events) or within certain areas (e.g., tributaries as opposed to receiving waters). This was emphasized by Kinzelman et al. (2011), who stated that for MST markers to be of relevance to the recreational water quality community, which includes the regulators charged with achieving water-quality objectives based on FIB levels, MST must closely correlate with the FIB regulatory parameters. Thus, a toolbox approach may be the best approach for these applications because there is a better likelihood of one or several MST markers correlating with FIB levels. Moreover, a toolbox approach would be appropriate for these applications, especially application 4, because the use of multiple methods for detection of one source can be used to support one another, alleviating the uncertainty of results from
imperfections individual MST methods (Harwood and Stoeckel, 2011).
For applications 1 and 2, a toolbox approach could also be utilized, but, as mentioned earlier, a tiered approach may be preferred for identifying and prioritizing sources of fecal contamination due to the reduced costs of this approach compared to the toolbox approach. However, the process for determining whether or not a tiered approach is appropriate for these applications has not been established. Several studies have
2011). Correlation between MST markers and FIB standards would be beneficial, as the first tier in many tiered approaches is likely to be FIB assays. We propose here that there are also two other possibilities for evaluating the use of a tiered approach.
First, if a correlation is not found between MST and FIB organisms, a tiered approach could be evaluated based on the percentage of MST-positive samples that would be missed if only FIB standards were used. For example, if prioritization of water bodies for TMDL plans is to be based on those areas predominantly impacted by human-source fecal pollution, the FIB assays in the first tier should indicate, or “flag,” at least a majority of the sites positive for human-source MST markers. This criterion was utilized by Sauer et al. (2011), who recommended against a tiered approach because high FIB levels would have failed to flag 35% of the samples with high concentrations of a human-specific Bacteroidales marker and would have flagged 33% of samples as priority that had low or no evidence of the marker. Obviously, several components of this criterion are subjective and may vary between studies, including what % of MST-positive samples should be indicated by high FIB levels and also what constitutes “high” levels of FIB indicators. We suggest that at least 50% of samples positive for an MST marker of interest (e.g., a human-source marker) be indicated by high FIB levels. We also suggest that “high” FIB levels be defined as levels above regulatory thresholds, as these
thresholds are used to categorize water bodies as in compliance or impaired. This criterion would likely only be necessary if MST and FIB are not correlated.
level of information necessary to identify the source of fecal contamination in individual samples. For example, if an MST marker is only 50% specific to a particular source, it may not provide enough additional information from FIB to necessitate its use in a tiered approach, although an MST marker may still provide useful information for a study, for example if the marker has shown a relationship to human health. The level of MST marker specificity required for usefulness in a tiered approach has not yet been established and is likely to vary depending on the goals of individual projects.
Thus, determining whether or not a tiered approach is applicable for identifying and prioritizing sources of fecal contamination is not straightforward. One or all of the above criteria could be utilized to determine whether this approach can be used with individual MST markers.
3.4 Conclusions
Recommendations for water quality monitoring for primary contact recreation are currently based on traditional FIB standards (Section 2). The results of these monitoring assessments are frequently used as the sole or primary factor for mitigating
technologies, when applied throughout water quality assessment, prioritization, and remediation stages, can improve the identification and remediation of fecal
contamination.
A tiered approach, if applicable, could prove most beneficial for regulatory agencies when attempting to identify and prioritize NPS contributions of fecal
contamination. Monitoring programs that include MST technologies have the potential to discriminate between human versus nonhuman sources and better indicate the presence of pathogens. It would be desirable for MST markers to correlate with FIB standards for ease of incorporation into existing water quality monitoring regulations. However, it is not yet clear how MST assays relate to measurements of FIB in natural waters impacted primarily by NPS pollution. The objective of this study was to determine whether MST markers can provide information for source allocation and human pathogen presence in the Cape Fear watershed in North Carolina, a diverse watershed with both highly
urbanized areas as well large regions of industrialized agriculture, and whether the MST markers can be utilized in a tiered assessment with FIB.
3.5 Approach
With a focus on the Cape Fear watershed, the objectives for this research were met using field-based and lab-based studies. The approach to address each objective is outlined below.
Objective 1. Elucidate the spatial and temporal trends of human-specific MST markers in order to prioritize areas for targeted remediation in a mixed-use
This study focused on a mixed-use sub-watershed in the Research Triangle, North Carolina. This area is experiencing rapid growth leading to increased NPS pollution and water body impairment of freshwater supplies. Impacted waters include Jordan Lake, which is located within an urbanizing watershed and serves as a source of drinking water for surrounding municipalities. Monthly raw water samples from 15 stream locations within the Jordan Lake watershed were analyzed for human-specific source tracking markers. The sites were chosen to represent varying land uses. This research helped to identify hot spots for targeted restoration plans. For this goal, we utilized the anaerobic human-source markers Bacteroides sp. and M. smithii, and the enteric viruses,
enterovirus and norovirus.
ability of F-RNA coliphages to distinguish between human and animal sources, and the correlation of both somatic and F+ coliphages to pathogens.
Objective 3. Compare MST markers to FIB indicators to determine whether MST markers can be used in a tiered assessment.
This comparison was conducted utilizing data generated from evaluating Objectives 1 and 2. Comparisons between MST markers and FIB counts were based on (1)
4. Methods Development
In addressing Objectives 1-3, this study utilized several molecular assays, including assays for Bacteroides sp., Methanobrevibacter smithii, and enteric viruses. These assays, utilizing qPCR, are potentially more sensitive, quantitative, and amenable to automation than culture-based methods (Santo Domingo, et al., 2007). However, in practice, the concentration and extraction steps necessary for molecular methods can have low and variable recoveries, and the nucleic acid extractions can contain inhibitors that increase a sample’s limit of detection or result in false negatives. Utilization of
quantitative markers is a high priority goal for much of the MST field (Santo Domingo, et al., 2007). However, before incorporation of quantitative data, multiple performance characteristics will have to be defined for MST markers and their methods to ensure accurate quantification and interpretation (see review in Harwood and Stoeckel, 2011). In terms of accurate quantification, Wuertz et al. (2011) established that there are two major challenges that face accurate quantification of molecular MST markers from natural water samples: (1) assessing the recovery efficiency of sample processing steps,
including concentration of targets and extraction and purification of nucleic acids, and (2) assessing the impact of PCR inhibitors. During the course of this study, both of these issues impacted detection and quantification of MST markers, especially the viral targets. Thus, this project addressed these methodological limitations with two additional
Objective 4. Determine whether the level of inhibition detected in select surface water samples is related to the presence of detectable dissolved organic matter components in order to determine what types and levels of organics cause PCR inhibition in environmental water samples.
When concentrating large volumes of water for molecular methods, it is possible, and sometimes unavoidable, to co-concentrate PCR inhibitors, such as humic substances and metals, with the target of interest (Abbaszadegan, et al., 1993). Major inhibitors of PCR common in the water environment are humic substances, including humic and fulvic acids, which are the major constituents of organic material in the aquatic environment (Steinberg and Muenster, 1985). A number of studies have examined the removal of humic substances from samples, but few have examined the type and levels of humic substances that correlate to levels of PCR inhibition. It was expected that levels of certain humic substances would correlate to increased levels of PCR inhibition in samples. Understanding this correlation will help researchers to predict what types of samples may have increased levels of inhibition, and suggest appropriate measures for reducing or removing inhibitory substances. The level of inhibition was evaluated in conjunction with abiotic parameters, land use, and the level of antecedent rainfall.
Objective 5. Develop and demonstrate proof-of-concept for a novel process control for recovery of enteric viruses from water.
42
Table 1.1. Sensitivities and specificities for Microbial Source Tracking Assays
Test Target Host category Sample type
Sensitivity (n)
Specificity
(n) Reference Anaerobic Bacterial and Archaeal Genes
Bifidobacterium
adolescentis PCR Bi-ADO 1/2 Human Wastewater 1.00 (22) 0.84 (60)
Bonjoch et al. (2004) Bifidobacterium
adolescentis colony
hybridization S-S-B.ado-0182-a-S-27 Human Individual Feces 0.92 (12) 1.00 (85)
Lynch et al. (2000) Bifidobacterium
adolescentis colony
hybridization S-S-B.ado-0182-a-S-28 Human Wastewater 0.67 (3) 1.00 (3)
Lynch et al. (2000) Bifidobacterium
adolescentis PCR BiADO 1/2 Human
Individual feces/wastewater
0.85 (26),
1.00 (33) 0.84 (119)
Doraj-Raj et al. (2009) Bifidobacterium
catenulatum PCR BiCAT 1/2 Human
Individual feces/wastewater
0.46 (26),
1.00 (33) 0.87 (119)
Doraj-Raj et al. (2009) Bacteroidales PCR (two
trials) HF183F, HF134F/Bac708R Human Blind samples
0.70, 1.00 (10, 14)
1.00, 1.00 (6, 7)
Field et al. (2003) Bacteroidales PCR HF183F/Bac708R Human Individual feces
0.20–0.85 (7–25) 0.85–1.00 (46–73) Bernhard et al. (2000) Bacteroidales PCR HF183F/Bac708R Human Wastewater 1.00 (41) 1.00 (75)
Bernhard et al. (2000) Bacteroidales PCR HF183F/Bac708R Human Blind samples
0.80 (5),
1.00 (2) 1.00 (5)
Griffith et al. (2009)
Bacteroidales PCR HF183/Bac708R Human
Individual fecal samples and
Wastewater 1.00 (22) 0.87 (67)
Kirs et al. (2011) Bacteroidales PCR HF183/Bac708R Human
Wastewater, Septic
Systems 0.96 (55) 0.87(117)
McQuiag et al. (2009) Bacteroidales PCR HF183/Bac708R Human
Individual feces/wastewater
0.12 (26),
0.70 (33) 1.00 (119)
Doraj-Raj et al. (2009) Bacteroidales PCR Bac32F/Bac708R Human
Wastewater,
Non-human feces 1.00 (53) 0.96 (316)
43
Bacteroides PCR HF183 Human
Wastewater,
Non-human feces 1.00 (50) 0.99 (136)
Ahmed et al. (2009)
Bacteroides PCR BacHum Human
Wastewater,
Non-human feces 1.00 (50) 0.94 (136)
Ahmed et al. (2009)
Bacteroides PCR HuBac Human
Wastewater,
Non-human feces 1.00 (50) 0.63 (136)
Ahmed et al. (2009)
Bacteroides PCR BacH Human
Wastewater,
Non-human feces 1.00 (50) 0.94 (136)
Ahmed et al. (2009)
Bacteroides PCR Human-Bac Human
Wastewater,
Non-human feces 1.00 (50) 0.79 (136)
Ahmed et al. (2009)
Bacteroidales, qPCR BacHum Human
Individual Feces and Combined Fecal Samples, Wastewater
0.67, 1.00
(18,14) 0.98 (41)
Kildare et al. (2007)
Bacteroidales, qPCR HuBac Human
Individual Feces and Combined Fecal Samples, Wastewater
0.89, 1.00
(18,14) 0.61 (41)
Kildare et al. (2007)
Bacteroidales, qPCR HF183 Human
Individual Feces and Combined Fecal Samples, Wastewater
0.61, 1.00
(18,14) 0.73 (41)
Kildare et al. (2007)
Bacteroidales, qPCR HF183 Human Blind samples
0.80 (5),
0.50 (2) 1.00 (5)
Griffith et al. (2009)
Bacteroidales, qPCR HF183 Human Blind samples
1.00 (5),
1.00 (2) 0.00 (5)
Griffith et al. (2009) Bacteroidales qPCR
HF183F/reverse primer
described Human Individual feces 0.86 (7) 1.00 (19)
Seurinck et al (2005) Bacteroidales qPCR
HF183F/reverse primer
described Human Wastewater 1.00 (4) NR (NR)
Seurinck et al (2005) Bacteroides
thetaiotamicron PCR BT 1/2 Human
Individual feces/wastewater
0.65 (26),
0.39 (33) NR (NR)
Doraj-Raj et al. (2009) Bacteroides
thetaiotamicron PCR BFD Human Blind samples
1.00 (5),
0.25 (2) 0.50 (5)
Griffith et al. (2009) Bacteroides
thetaiotamicron qPCR BFD Human Blind samples
1.00 (5),
0.75 (2) 1.00 (5)
Griffith et al. (2009) Bacteroides vulgatus
PCR BV 1/2 Human
Individual feces/wastewater
0.88 (26),
1.00 (33) 0.86 (119)
Doraj-Raj et al. (2009) Bacteroidales PCR (two
trials) CF128F, CF193F/Bac708R
Ruminants and
pseudoruminants Blind samples 1.00 (7, 9)
0.89, 0.92 (9, 12)
Field et al. (2003)
Ruminants and 0.97, 1.00 1.00, 1.00
44
(2005) Bacteroidales PCR CF128F/Bac708R
Ruminants and
pseudoruminants Wastewater 1.00 (75) 0.93 (14)
Bower et al. (2005) Bacteroidales PCR CF193F/Bac708R
Ruminants and
pseudoruminants Individual feces 1.00 (31) 1.00 (28)
Bernhard et al. (2000)
Bacteroidetes PCR CF128 Ruminant Wastewater 0.26 (19) 1.00 (95)
Balleste et al. (2010)
Bacteroidetes PCR CF193 Ruminant Wastewater 0 (19) 0.99 (94)
Balleste et al. (2010)
Bacteroidales PCR CF128/Bac708 Ruminant
Individual fecal samples and
Wastewater 0.85 (27) 0.65 (51)
Kirs et al. (2011) Bacteroidales PCR CF128F/Bac708R Cattle Individual feces 1.00 (19) 0.73 (40)
Bernhard et al. (2000) Bacteroidales PCR CF193F/Bac708R Cattle Individual feces 1.00 (19) 0.70 (40)
Bernhard et al. (2000)
Bacteroidales PCR RumB1F/BacPreR Ruminant
Individual fecal samples and
Wastewater 0.97 (74) 0.97 (103)
Doraj-Raj et al. (2009)
Bacteroidales PCR Bac32F/RumD1R Ruminant
Individual fecal samples and
Wastewater 0.91 (74) 1.00 (103)
Doraj-Raj et al. (2009)
Bacteroidales PCR Bac32F/RumD2R Ruminant
Individual fecal samples and
Wastewater 1.00 (74) 0.95 (103)
Doraj-Raj et al. (2009)
Bacteroidales PCR CF128F/Bac708R Ruminant
Individual fecal samples and
Wastewater 0.95 (74) 0.94 (103)
Doraj-Raj et al. (2009)
Bacteroidales, qPCR BacCow Cattle
Individual Feces, Combined Fecal
Samples 1.00 (8) 0.94 (51)
Kildare et al. (2007)
Bacteroidales, qPCR BoBac Cattle
Individual Feces, Combined Fecal
Samples 1.00 (8) 0.96 (51)
Kildare et al. (2007) Bacteroidales PCR DF475F/Bac708R Dog Blind samples 0.40 (15) 0.86 (7)