ATTAINABILITY, PARTISAN DYSFUNCTION, AND THE CHANGING NATURE OF SENATE LEADERSHIP
Jacob F. H. Smith
A thesis submitted to the faculty of the University of North Carolina at Chapel Hill in partial fulfillment of the requirements for the degree of Master of Arts in the Department of Political Science.
Chapel Hill 2014
c
⃝ 2014
ABSTRACT
JACOB F. H. SMITH: Attainability, Partisan Dysfunction, and the Changing Nature of Senate Leadership
(Under the direction of Jason M. Roberts.)
Partisan dysfunction and an increasingly attainable majority in the United States
Senate have changed the nature of party leadership in the upper chamber. This paper
examines why, in contrast to the overall trend of a decreasing number of close
Sen-ate elections, party leaders are increasingly burdened by difficult, closely-contested
reelection campaigns. I argue that party leaders’ unique position in the battle for
majority control has contributed to new electoral challenges. I contend that the
po-larization of the cloture process has furthered this trend. As leaders are expected by
their co-partisans to take full advantage of Senate rules to advance their party’s
prior-ities, they have come to typify dysfunction in the Senate and now represent attractive
targets for defeat by the other party. As a whole, the emergence of competitive
elec-tions has contributed to the overall dysfunction of the body as electoral goals outpace
ACKNOWLEDGMENTS
I would like to thank my advisor, Jason Roberts, and the other members of my thesis
committee, Sarah Treul and Tom Carsey, for their suggestions in improving this paper.
All errors are my own. I would also like to thank all of the excellent professors I have
had, both at UNC-Chapel Hill and Kenyon College, who have inspired me to become
a better scholar. Finally, I would like to thank my parents, Forrest and Monica Smith,
TABLE OF CONTENTS
LIST OF TABLES ………..vii
LIST OF FIGURES……….viii
Introduction……….1
Dysfunction and Institutional Change in the Senate ...………...6
Explaining Newfound Competitiveness in Party Leader Races ...…………...………10
Methodology and Results………...………..20
Broader Implications and Conclusion ………..26
APPENDIX: TABLES…...………..29
LIST OF TABLES
Table
1 Summary Statistics, 1980-2002 . . . 29
2 Summary Statistics, 2004-2012 . . . 29
3 Determinants of Senate Election Margins . . . 30
4 Summary Statistics, Wrong Way Voting Model . . . 30
5 Determinants of Wrong Way Voting, 97th to 112th Congresses . . . 31
6 Summary Statistics, Leader Model . . . 31
7 Summary Statistics, Non-Leader Model . . . 32
8 Overall Spending in Senate Races, 2004-Present . . . 32
9 Cloture Votes and Vote Share for Senators . . . 33
10 Summary Statistics for Fourth Hypothesis Models . . . 34
LIST OF FIGURES
Figure
1 Percent of Senate Races Decided by Single Digits by Decade . . . 4
2 Average Reelection Vote Percentage for Party Leaders by Decade . . . 5
Introduction
The success of democratic political institutions depends on those institutions being
able to carry out the essential functions of government. Numerous countries in regions
ranging from the Middle East to South America have experienced the failure of
demo-cratic government due (at least in part) to the inability of the government to perform
its basic responsibilities (Kurlantzick 2011). In late 1700s America, as detailed by
Alexander Hamilton in severalFederalist Papers, super-majority requirements for the
passage of legislation and an inability to enforce laws or punish law-breakers rendered
the Articles of Confederation unable to “preserve the union, “ leaving America at “the
last stage of national humiliation” (Madison, Jay & Hamilton 2003, p.134-138).
Hav-ing also experienced a government that was so strong that it trampled on individual
rights when under British rule, the framers of the American Constitution sought to
form a government that would strike a balance between these two extremes. Under
the new Constitution, the United States has flourished under what can generally be
described as a healthy democratic political system.
Freely contested (and at times competitive) elections are a vital part of any healthy
democratic political system (Dahl 1972). In urging the adoption of the new
Constitu-tion, James Madison declared that it was “essential to liberty” that a common interest
be shared by the government and the people; the only way to achieve this link,
Fed 52). Thus the new American Constitution ensured the occurrence of elections at
regular intervals.
More than two hundred years after Madison wrote those words, the
competitive-ness of American elections is still a central focus of those studying American
democ-racy. In the context of the Senate (originally appointed but selected through popular
vote since the adoption of the 17th Amendment), majority control has become
in-creasingly competitive in the years since the 1980 election, when Republicans ended
26 consecutive years of Democratic control (Smith 2014). (Although it might
be-come apparent by the end of the election cycle that a particular party has a strong
advantage, one could typically create a reasonably plausible counter-factual scenario
where the other party could have won the majority in that election.) Indeed, the
House majority, which has widely been viewed as attainable in recent literature (see
Heberlig & Larson (2005), Heberlig & Larson (2007), Heberlig & Larson (2012)), has
swung between the parties slightly less frequently than the Senate in recent years.)
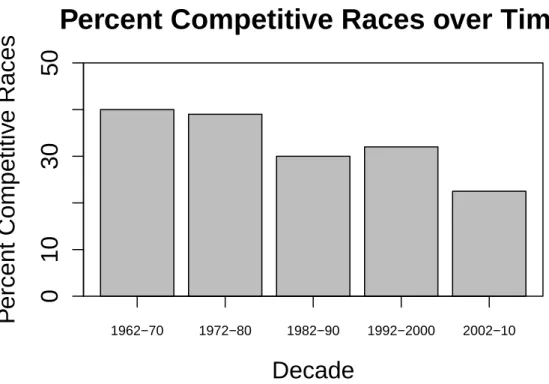
Yet, as detailed by Abramowitz (2012), several macro-level counter-trends have
struc-tured competition in Senate elections since 1980. On one hand, as voters increasingly
support candidates from the same party for every office, the percentage of Senate
elec-tions decided by single digits has decreased from around forty percent in the 1960s
and 70s to around thirty percent in the 1980s and 90s to the low twenties after the
start of the 21st century.1 On the other hand, the average size of the Senate
ma-jority has decreased in recent years, thus requiring a smaller seat swing to win the
majority. Indeed, since 2000, the the average seat swing has also increased,
ing the likelihood of frequent shifts in majority control. The overall result of these
counter-trends has been a highly competitive battle for the Senate concentrated in a
narrowing number of seats.
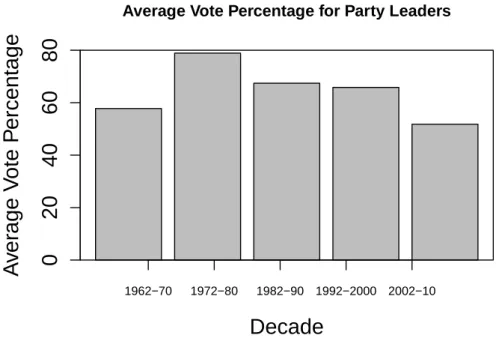
In contrast with the overall trend, elections featuring party leaders have become
increasingly competitive in recent years. Following the defeat of Senator Tom Daschle
(D-SD) in 2004, every subsequent Senate race featuring a party leader has been highly
contested by both parties. While Daschle’s loss in isolation could be singularly
ex-plained by the overall Republican lean of South Dakota, Senators Harry Reid (D-NV)
and Mitch McConnell (R-KY) have faced competitive races even though their party’s
nominee for president won at least 55 percent of the vote in their states in the previous
election. Furthermore, both Reid and McConnell won reelection with more than 60
percent of the vote in their reelection campaign before becoming party leader. For his
Percent Competitive Races over Time
Decade
P
ercent Competitiv
e Races
0
10
30
50
1962−70 1972−80 1982−90 1992−2000 2002−10
Figure 1: Percent of Senate Races Decided by Single Digits by Decade
Average Vote Percentage for Party Leaders
Decade
A
v
er
age V
ote P
ercentage
0
20
40
60
80
1962−70 1972−80 1982−90 1992−2000 2002−10
Figure 2: Average Reelection Vote Percentage for Party Leaders by Decade
Note: Calculated by Author. Note: There are only two leader elections in the 1972-80 period; Democratic Leader Robert Byrd (D-WV) was unopposed for
reelection in 1976.
This paper offers an account for why party leaders have come to experience more
competitive reelection races even as the overall percentage of closely-decided races has
declined. First, I discuss previous research that serves as a foundation for constructing
a theory to explain increased competition in races featuring party leaders. Second, I
theorize that party leaders’ unique position in the battle for majority control in an
era of polarized cloture voting makes them especially vulnerable to strong electoral
challenges from the other party. Third, I present empirical evidence to substantiate
the claims made in the previous section. Finally, I discuss further implications of the
changes facing party leaders. Overall, I argue the increased burdens faced by party
into the increasing dysfunction that has come to characterize the chamber in recent
years.
Dysfunction and Institutional Change in the Senate
Although this central puzzle of this paper speaks directly to electoral politics,
electoral politics and political institutions are not isolated from one another. As the
institutional politics of the Senate has changed in recent years, an account of the
transformation of the Senate is a necessary prerequisite to pursuing an answer to this
paper’s central question. Focusing on the rise of the obstruction in the cloture process,
past literature documents the rise of dysfunction in the United States Senate.
Created in a less polarized era, Senate rules that now serve to further
dysfunc-tion existed for centuries without causing this effect. (While dysfuncdysfunc-tion is almost
always preferable to some actions, it is not more preferable to all potential actions.
Furthermore, there are certain actions the government must take; legislative
dysfunc-tion makes it more difficult to provide quick and decisive policy acdysfunc-tion to the most
pressing issues.) The first set of Senate rules were written in 1789 when twenty rules
were adopted to structure the way the upper chamber was to be run (Swift 1996).
New rules were added in 1806; it was then that the motion for the previous question
was deleted from the Senate rules, which provided a new opportunity for the minority
party to obstruct (Swift 1996, Binder & Smith 1997). Even though the previous order
question was altered in the early 1800s, filibusters and other attempts to obstruct the
majority agenda were few and far between (Binder & Smith 1997).
be-came an increasingly polarized (and dysfunctional) institution. As noted by
numer-ous scholars (for example, see McCarty, Poole & Rosenthal (2006)), the gap between
the two parties in both houses of Congress has grown over time. Just because an
institution is polarized does not necessarily mean that it cannot function. After
all, despite complaints from the minority about unfair treatment, the House of
Rep-resentatives has generally operated efficiently in recent decades (Rohde 1991, Cox
& McCubbins 1993, Cox & McCubbins 2005). The Senate, however, relies on
co-operation and consensus in order to function. Absent a unanimous consent
agree-ment, a super-majority of senators is needed to cut off debate and ultimately vote
on legislation. As partisanship in the Senate has increased, it has become more
difficult to invoke cloture and the legislative process has broken down (Binder &
Smith 1997, Smith 2014).2
The results of the breakdown of the legislative process have not been lost on
senators. In 1982, Senator Dale Bumpers (D-AR) proclaimed that unless senators
came to understand the need to change procedures the chamber would “never be
an effective legislative body again,” while eleven years later Senate Majority Leader
George Mitchell (D-ME) stated that although he felt he had been more than fair
in letting the minority party offer amendments the ability to accomplish anything
had become “extremely difficult” and that changes needed to be made (Binder &
Smith 1997, p.18-19). Yet, by comparison, the late 20th century Senate looks fully
functional when compared with the Senate of the early 21st century. As detailed by
Smith (2014), the pattern of the minority obstructing the majority and the majority
restricting the ability of the minority to participate in debates has changed senators’
assumptions about the behavior of their colleagues, which has reshaped the ethos of
the Senate as a chamber.
At the same time, changing Senate rules–even those rules that are broadly viewed
as harmful to the institution’s mission–is difficult. Typically, it takes the vote of
two-thirds of the Senate to change Senate rules; while a relatively large number of
senators at a given time might find the filibuster to be deleterious to the body’s ability
to govern, members of the minority party are unlikely to vote to weaken their ability
to block the majority. In November 2013, however, Majority Leader Harry Reid
(with the support of 52 of 55 Democratic senators) decided to trigger the so-called
“nuclear option,” a procedure that allowed the majority to change the rules with
a simple majority. Democrats changed the rules on cloture for non-Supreme Court
judicial nominees and executive branch nominees so that cloture only required a simple
majority rather than a three-fifths majority (Smith 2014). The nuclear option had
first been discussed in 2005 in relation to some of President Bush’s judicial nominees
who were being blocked by Senate Democrats, although a group of senators called
the “gang of fourteen” struck a deal that allowed most (but not all) of the judicial
nominees to go through in exchange for the continuation of the sixty vote threshold for
judicial nominees, thus rendering mute the threat of the nuclear option by then-Senate
Majority Leader Bill Frist (R-TN). Reid had also considered using the nuclear option
earlier in 2013, but ultimately backed off after striking a deal with Republicans that
allowed several nominees to move forward (Smith 2014). In total, these two episodes
Number of Cloture Votes
Year
Number of Cloture V
otes
0
40
80
120
1981
1987
1993
1999
2005
2011
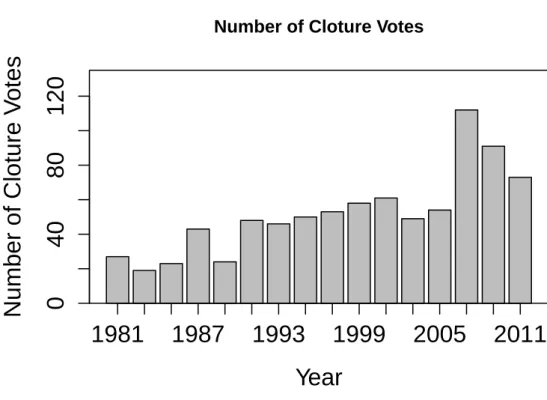
Figure 3: Number of Cloture Votes by Congress
Note: Data from www.senate.gov
The new pattern of dysfunction in the Senate presented in this section serves as a
foundation for considering why party leaders have come to face competitive reelection
campaigns in recent years. It is clear that the day to day behavior of party leaders
is fundamentally different than it was even a few decades ago. The next step of this
paper is to examine the potential implications of this institutional transformation to
this paper’s central puzzle.
Explaining Newfound Competitiveness in Party Leader Races
In contrast to the overall trend, Senate leaders have come to experience additional
puzzling departure from the decreasing competitiveness that has come to characterize
Senate elections as a whole. I posit that party leaders’ newfound electoral difficulties
stem from voters associating party leaders with the the increased dysfunction facing
the institution and taking out their frustrations by voting against these senators in
their reelection campaigns. Adding to leaders difficulties, each party views the other
leader’s seat as a potential expansion of the battle for party control and now actively
targets them for defeat.
At first glance, it is somewhat surprising that Senate leaders have come to
con-sistently experience competitive reelection campaigns as a smaller percentage of their
colleagues face tight races for reelection. Numerous studies (for example, see
Box-Steffensmeier (1996)) have demonstrated that having a large campaign war chest is
generally an effective strategy for deterring quality challengers. As party leaders
typ-ically rank at or near the top of all senators in terms of fundraising prowess, one
would expect their large campaign war chests to forestall challenges from credible
challengers. In addition, as a result of their leadership positions, Senate party leaders
are also in a position to bring back federal spending to their states. As Fiorina (1977)
noted, increased federal spending and a larger and more complicated bureaucracy
have played a role in reducing the number of close congressional races over time. If
anything, one would expect party leaders to beless likely to face competitive election
challenges as a result of their superior ability to steer federal money to their districts.
Furthermore, party leaders’ clout places them in a strong position to help constituents
who may run into problems in dealing with federal agencies. Broadly, based on these
reelection campaigns.
Nevertheless, recent election returns clearly demonstrate that party leaders have
come to experience more competitive reelection campaigns in recent years. Indeed,
since Senator Daschle’s defeat in 2004 every party leader has faced a competitive
reelection campaign. In 2008 Minority Leader Mitch McConnell (R-KY) faced a strong
challenge from Democrat Bruce Lunsford, in 2010 Majority Leader Harry Reid (D-NV)
was nearly unseated by Republican challenger Sharron Angle, and McConnell once
again faced a competitive reelection challenge from Kentucky Democratic Secretary of
State Alison Lundergan Grimes. Before moving forward, however, it is necessary that
the increased competitiveness of elections featuring party leaders is not the byproduct
of some other factor that is not unique to party leaders that has only recently begun
to manifest itself in these elections.
Table 3 presents two OLS regression models that provide quantitative evidence
that the competitiveness of elections featuring party leaders cannot be wholly
at-tributed to factors that also affect non-leaders. (For models with data clustered by
year I used bootstrap cluster standard errors (BCSE) in keeping with the
recommen-dations of Harden (2012)) To determine whether some sort of multi-level model was
necessary, I also ran ANOVA tests on the residuals by year; in all models presented in
this paper, the result of the ANOVA test was not statistically significant.) The era of
an attainable Senate majority is divided into two sub-time periods in these models;
the first model includes election cycles occurring before the South Dakota election for
the Senate in 2004 (elections from 1980-2002), while the second model includes
2004-2012). In both models, the focal dependent variable measures the margin
be-tween the winning and losing candidates as a percent. For this analysis, I calculate
this margin based upon the two-party vote. I count independents who are associated
with one of the parties as de facto members of that party.
The inclusion of several variables relating to other possible explanations for
in-creased competitiveness allows for an examination of whether this pattern is the
func-tion of other factors that apply broadly to Senate elecfunc-tions manifesting themselves
in Senate races featuring party leaders. First, this model includes a measure of a
state’s competitiveness in presidential elections which is calculated by comparing the
presidential results for a state to those of the country as a whole for the previous
two election cycles. (To calculate this measure, which is based upon the Cook PVI
(Wasserman 2014), I first took the difference between the average presidential vote
in a state and the average presidential vote in the country over the previous two
elections. Then, I took the absolute value of this result. Thus, for example, a state
where the Democrat received an average of 54 percent in two elections compared to a
national average of 50 percent would receive a value of 4.) All else equal, one would
expect that states that are relatively balanced, on average, to be more likely to have
competitive Senate elections than states where a strong ideological lean in favor of
either party is present. The coefficient for this measure is statistically significant in
both time periods. Nevertheless, party leaders in states ranging from relatively
com-petitive (Harry Reid in 2010) to favorable to their party in national elections (Mitch
McConnell in 2008 and 2014) to unfavorable to their party (Tom Daschle in 2004)
Another factor that affects the outcome of elections, including Senate races, is the
the phenomenon of midterm decline. Documented prominently by Campbell (1960)
(as well as other authors), members of Congress in the president’s party typically do
poorly in midterm elections and the other party does well at the polls. To control for
this phenomenon, the midterm decline variable is coded as “-1” for elections featuring
senators of the president’s party in a midterm, “1” for elections featuring senators
not of the president’s party in a midterm, and “0” for all other scenarios. Although
this variable, as with the presidential margin variable, is significant in both time
periods, the party leader variable still remains significant in the latter time period.
Thus, the explanation that some other factor that applies broadly to Senate elections
is manifesting itself in leaders’ races seems less likely to be true, still leaving the
puzzle of this newfound competitiveness unsolved.3 Having established that the
newfound competitiveness facing party leaders does not appear to stem from another
confounding factor, the next step is to provide some alternative explanation for this
phenomenon.
Increased legislative dysfunction has changed voters’ perception of the Senate. As
demonstrated by public opinion data, voters’ perceptions of Congress have fallen to
all-time lows. Congressional approval ratings in the Gallup Poll have been below forty
percent (and in recent years, under twenty percent) for the past decade (Gallup 2014).
As Senator John McCain (R-AZ) frequently jokes, congressional approval is down to
“paid staff and blood relatives” (Temp 2012). Although having somewhat different
viewpoints as to what is causing these problems and how to solve them, there is
bipartisan agreement that government isn’t working the way it should and that elected
officials are part of the problem (Newport 2014). Although polls increasingly show
that voters claim they would like to vote out their own member of Congress, incumbent
reelection rates remain high (Craighill & Clement 2014). Thus, even though voters
are frustrated with the way Congress works today, the reelection of the typical senator
does not appear to be a consistent target of voters’ frustrations.
Senate leaders, to a greater degree than their colleagues, are likely to be blamed
for ongoing legislative dysfunction as a result of how they must respond to a polarized
cloture process. Both parties’ leaders are expected to do everything in their power to
gain an advantage for their party in the cloture process (Smith 2014). For the
major-ity leader, this includes “filling the amendment tree,” casting “wrong way” votes in
order to bring up cloture petitions for future votes, and potentially holding numerous
cloture votes in succession with the hope of breaking the logjam. (Note:“Filling the
amendment tree” refers to procedures allowing the majority leader to prevent the
minority from offering amendments to a bill.) In the case of the minority leader,
the expectation is that this individual will lead a united front in opposing nearly all
proposals brought forth by the majority party, as well as forcing extended debates in
order to “run out the clock” (Benen 2014).
Based on the observation that party leaders are expected to do whatever possible
to advance their parties agenda, the number of cloture votes should be indicative of an
array of other legislative behaviors that set party leaders apart from their colleagues.
An example of such a legislative behavior resulting from the cloture process that sets
resulting from Senate Rule XIII. Senate Rule XIII allows for a cloture petition to be
reconsidered if a reconsideration motion is made by a senator on the prevailing side.
In practice, this means that the majority leader’s vote is changed from “yes” to “no.”
I classify a vote as a “wrong way” vote if a party leader votes “no” on a failing roll
call when at least 80 percent of the other senators in their party voted the opposite
way. To establish this link, I hypothesize that:
H1: As the number of cloture votes in a Senate session increases, the number of
“wrong way votes” cast by a party leader will also increase.
While beneficial for advancing their party’s agenda in the Senate, the actions taken
by party leaders during the polarized cloture process have the potential to be
prob-lematic for leaders in their home states. First, by virtue of their leadership post, party
leaders are likely to be associated with the daily functioning (or, in modern times
dys-function) of the Senate. Polling data demonstrates that voters in party leaders’ home
states often associate these individuals with the dysfunction of the body. For example,
despite the fact that their party’s presidential candidates easily carried their states in
recent presidential elections, both Senators Harry Reid (D-NV) and Mitch McConnell
(R-KY) have had negative approval and personal favorability ratings in numerous
polls in their home states (Sink 2012, Gardner 2010). Additionally, a September
2014 Ipsos/Reuters Poll from Kentucky indicated that the second and third most
frequent words that Kentucky voters associated with McConnell were “Washington
insider” and “arrogant.” In contrast, only eleven percent of Kentucky voters described
McConnell as a “real Kentuckian” (Ipsos 2014). Over time, the heightening of the
lead-ers’ home states have come to associate party leaders with the dysfunction of the
legislative body.
Second, the arcane nature of the cloture process opens up Senate leaders to the
distortion of their actions in the Senate as a result of how the cloture process changes
their behavior on the floor of the Senate. For example, as Smith (2014) notes, the
media does an especially poor job of explaining the Senate procedure associated with
cloture votes. This lack of clarity in reporting applies especially to Senate Rule XIII.4
A glaring case of the imprecise explanation of a leader’s record comes from the website
of a Nevada news station which declares (WVVU-TV 2013) in its title that “Sen. Reid
speaks for background bill but votes against it.” It takes until halfway through the
article to explain why Reid voted no and even then states that gun control supporters
claimed that Reid voted no for procedural reasons, rather than noting that Senate
rules require that a senator on the losing side vote with the prevailing side should he
want to potentially bring the bill up for another vote in the future. A voter reading
this article is likely to both be frustrated about ongoing gridlock, as well as confused
about what Reid’s true position is on this issue. Finally, (although this has not
happened yet since Democrats were in the majority from 2007-2015) in the future,
the distorted voting records that result from wrong way voting associated with Rule
XIII could open up a Republican leader to challenges from a Tea Party opponent that
they are too moderate.
Thus, based on the connection I posit exists between the expansion of the cloture
process and the negative reaction to this of voters in party leaders’ home states, I
derive the following hypothesis:
H2.1: The percentage of vote received by a party leader decreases as the number of
cloture votes in the preceding Congress increases as compared to previous Congresses.
Mirroring the above hypothesis, as a non-party leader senator is less likely to be
blamed for the dysfunction of the Senate than party leaders and their floor behavior
will be less changed by increased cloture voting than that of party leaders, it follows
that:
H2.2: The percentage of vote received by a non-party leader is unrelated to the number
of cloture votes in the preceding Congress increases.
While the cloture process by itself and voters’ negative reactions are important in
explaining the decline in party leaders’ electoral fortunes, this phenomena by itself
does not fully explain why leaders have come to consistently face competitive races
for reelection. Additionally, I posit that the opposing party, seeing the additional
burdens that the cloture process places on party leaders, actively target party leaders
for defeat in an effort to expand the increasingly constrained array of seats that
are competitive in the battle for control of the Senate. Party leaders have come to
understand that by virtue of being a Senate leader, they are likely to be actively
targeted for reelection. Indeed, Senator McConnell recently admitted that “When
you accept the responsibility to be the leader of your party you get targeted by the
other side and it just sort of goes with the turf” (Cowan 2014).
All else equal, as demonstrated in Table 3, the broad political leanings of a state
are likely to rank high in the decision process for parties when selecting which seats to
cloture process. Thus, the polarized cloture process creates an additional dimension
that makes seats held by party leaders more likely to be competitive in recent years.
Fully understanding the liabilities of the cloture process, the other party understands
that races featuring party leaders represent a unique opportunity to win a Senate seat
that may not otherwise have been competitive. Having the potential to put even one
more Senate seat in play in a time period when the percentage of competitive Senate
seats has waned is important for a political party. As a result, one should expect to
observe active efforts aimed at targeting party leaders (such as spending money) for
defeat from the other party, as well as similar efforts from leaders themselves aimed
at maintaining their Senate seat.
Therefore, following the logic of the above paragraph, I hypothesize that:
H3: Overall spending is likely to be greater in races featuring party leaders than in
races featuring regular senators.
Extending and building further upon this logic, party leaders may face additional
electoral targeting than even other senators facing competitive races for reelection.
For example, John Thune (R-SD), who unseated Senator Tom Daschle (D-SD) has
sometimes been referred to as a “giant killer” by other conservatives (Rowland 2009).
The reverence with which one like Thune (and, presumably, any future senators who
make it to the upper chamber by defeating a party leader) stems from the–as Frances
Lee puts it– “teamsmanship” that has come to define American politics (including
the traditionally less ideological Senate) in recent years (Lee 2009). If politics is like
a team sport, then defeating the other party’s leader is (to use an analogy) akin to
seat for one’s party it also serves as a morale booster for one’s own party. At the same
time, the other party is both demoralized and disorganized as it must choose a new
leader.
Based on the increased role of teamsmanship in legislative politics, I derive the
below (related) hypotheses:
H4.1: Competitive races featuring party leaders will feature a higher level of overall
spending than competitive races featuring regular senators.
H4.2: Competitive races featuring party leaders will feature a higher level of overall
spending from challengers than competitive races featuring regular senators.
As a whole, this section offers a potential answer to the central puzzle of this
paper. Increased use of the cloture process has caused party leaders to increasingly
be blamed by voters in their home states for the dysfunction of the Senate. Seeing
these vulnerabilities, the other party seeks to target party leaders for defeat.
Methodology and Results
Empirical evidence provides support for the hypotheses presented in the previous
section. First, I establish that an increased number of cloture votes relates to other
changes in floor behavior for party leaders. Second, I demonstrate that increased
clo-ture voting relates to decreased percentages for party leaders in reelection campaigns.
Finally, I show that party leaders have been targeted for defeat by the other party
in terms of campaign spending. Overall, these results lend support to the theory
presented in the previous section to explain the surprising increase in competitive
To establish that increased cloture voting is indicative of a wider range of changed
floor actions by party leaders, I examine the relationship between the number of wrong
way votes cast by the majority leader in a Congress and the number of cloture votes
cast in that Congress. As discussed previously, a wrong way vote is (in practice) a
nay vote cast by a party leader so as to be able to make a motion for reconsideration
under Rule XIII. The dependent variable for this model is the number of wrong
way votes cast by the majority leader in each of the 97th to 112th Congresses. I
determined which votes were wrong way votes by looking at legislative roll calls in
these Congresses; a vote was counted as a wrong way vote if a leader voted “no”
on a failing roll call when at least 80 percent of the other senators in their party
voted the opposite way.[Note: While it is theoretically possible that a party leader
might actually hold that position, in every roll call, the vast majority of other
same-party senators voting with the same-party leader were more conservative (in the case of
Democrats) or liberal (in the case of Republicans) than the typical senator from the
party.] The focal independent variable in this model is the number of cloture votes
in a Congress. I also include controls for the total number of votes in a session of
Congress, the number of senators in the majority party, whether or not the House
and presidency are controlled by the same party as the Senate (measured from 0 to
2), and a dummy variable for whether or not Democrats are the majority party in the
Senate. Due to evidence of over dispersion, I use a negative binomial model instead
of a poisson model.
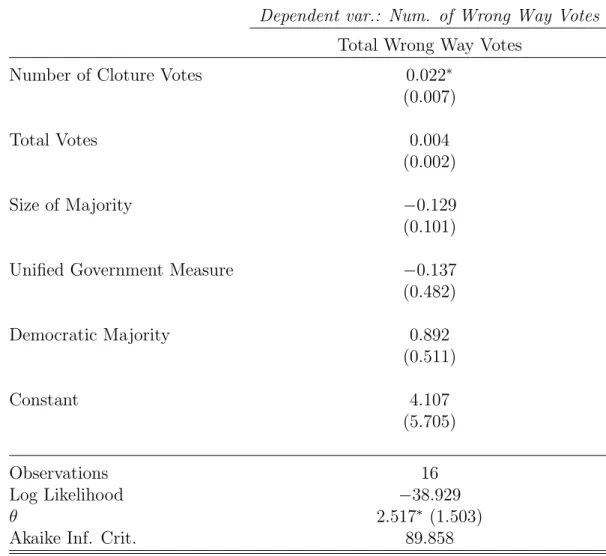
The results presented in Table 5 provide evidence for the claim that increased
The focal independent variable, the number of cloture votes in a Congress, is
statis-tically significant while the other independent variables do not attain significance.
This result suggests that, at least in the case of wrong way voting, increased cloture
voting is representative of an increase in other changed behaviors by party leaders. As
cloture voting has increased in Congress, an array of other actions by party leaders,
such as wrong way voting, have also risen in prominence.
The small number of the cases used for testing this hypothesis necessitates caution
when interpreting this model as a larger sample size should generally be used in MLE
models (Long 1997). A strategy that could be used to confirm these results includes
using a logistic regression model at the vote-level to test the related hypothesis that
cloture votes are more likely to produce wrong-way voting than non-cloture votes. The
increase in the number of cloture votes per Congress over time could then be used
to confirm that a rise in cloture voting relates positively to the number of
wrong-way votes. Finally, Carsey & Harden (2014) suggest permutation and randomization
testing a way to test whether the effect of some treatment (in this case, cloture voting)
makes an outcome (in this case, wrong way voting) more likely.
Second, I test the hypothesis that increased levels of cloture voting in Congress
relate to a decreased vote share for party leaders running for reelection. The
depen-dent variable in this OLS model is a leader’s two party vote share; the data includes
all races featuring party leaders from 1980 to 2010. The focal independent variable
for this model is the number of cloture votes that were held in the previous Congress.
Control variables include a measure of electoral competitiveness in the state, and a
calcu-lated by averaging the Democratic presidential vote in the previous two presidential
elections and (assuming uniform swing) converting that to the expected percentage
in a tied election.]To establish that an increase in cloture voting has not translated to
closer races for other senators, I also include a model for elections featuring non-party
leaders. This model includes the same independent variables as the leader model,
with two exceptions. The non-leader model includes a control variable for whether
or not an election features an open seat (a factor that does not apply to the party
leader model) and a control variable for whether the race occurred in or after 2004.
I include this variable to both delineate between the two time periods in the models
presented in the theory section and as a result of the fact that non-leader races have
become less likely to have close margins over time.
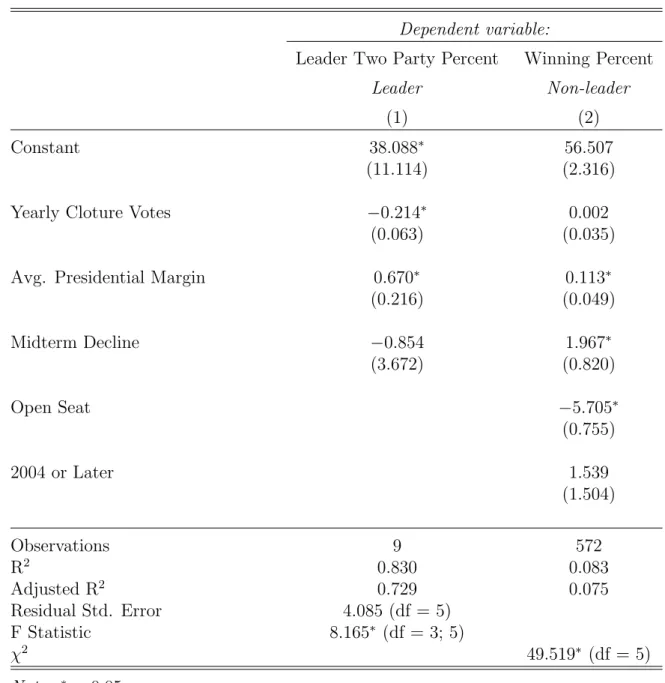
The results presented in Table 9 provide support for hypotheses 2.1 and 2.2. An
increased number of cloture votes has a negative, statistically significant relationship
with the vote share received by party leaders. Substantively, a increase of 28 cloture
votes (or approximately one standard deviation) translates to a decrease of just under
six percentage points in expected vote share for a party leader. As one can observe
in Figure 3, there has been a steady increase in the number of cloture votes per
Congress over time. The implication of the steady increase in cloture votes based on
the results of the model is that one would expect a rather sharp drop in the vote share
received by party leaders (exactly what has taken place). In contrast, the relationship
between vote share and cloture votes for non-party leaders is slightly positive and
not significant. The non-party leader model provides further evidence for the theory
on senators’ vote shares is not widespread and is instead isolated to a specific type of
senator.
Turning to the third hypothesis, I examine total levels of campaign spending in
Senate races from 2004 to 2012.5 The dependent variable for this OLS model is
the amount of spending in millions of 2012 dollars. The focal independent variable
measures whether or not a senator is a party leader. Control variables for this model
include a measure of the competitiveness of the state (measured the same way as in
the model presented in the previous section), a variable for midterm decline, and a
measure of state population (due to the fact that spending may be greater in states
with a large population.)
The results presented in Table 8 provide support for the third hypothesis. Overall,
when controlling for the competitiveness of a state, races featuring a party leader
see an expected increase in total spending of just under 30 million dollars in total
spending. Considering the fact that the mean level of total spending for a Senate seat
during the 2004-2012 time period is 15 million dollars, the higher levels of spending in
races featuring party leaders are both substantively and statistically significant.(Note:
I also ran models for the earlier time period of 1980-2002 and did not find the party
leader variable to be significant.) This is not to say that other factors do not matter in
determining the level of spending in a race; indeed, all three of the other independent
variables in this model are also statistically significant. Rather, this result (in keeping
with the theory presented in the previous section) suggests that the party leadership
status now represents an additional dimension that is taken into account by a party
when deciding whether or not to target a race.
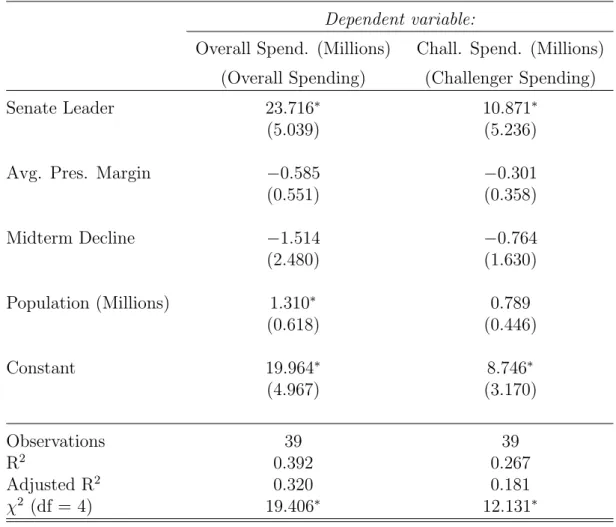
To test hypotheses 4.1 and 4.2, I use data measuring levels of campaign spending in
the closest Senate races, defined as those decided by a single digit margin. The models
used to test these hypotheses feature the same independent variables as the model used
to test hypothesis 3. The main difference for these models is that the data is limited
to only those races that were decided by a single digit margin in the previous election.
In addition, the dependent variable used to test hypothesis 4.2 measures the level of
spending by the challenger-party candidate, rather than the overall level of spending
in the election. (The dependent variable for the model used to test hypothesis 4.1
remains a measure of overall spending, now for the most competitive races.)
The results in these models demonstrate that contests featuring party leaders have
become a central part of the battle for control of the Senate. In both models, the
Sen-ate leader variable is statistically significant; interestingly, neither the competitiveness
nor midterm decline variable attain significance in either model. (The state
popula-tion variable attains significance in the first model, but not the second.) In total, an
additional 23.7 million dollars in expected money is spent as compared to the typical
close Senate race, and an additional 10.8 million dollars in expected money is spent
by challengers as compared to the typical close Senate race. These results provide
support for the claim that party leaders are being targeted by the other party for
defeat and also demonstrate that party leaders face an electoral challenge that even
their colleagues in tough races do not experience. This finding demonstrates that the
growing importance of “teamsmanship” in Congress has prompted parties to target
virtue of other factors.
Overall, the results presented in this section provide support for the explanation
to the central puzzle presented in the previous section. Cloture votes, which represent
the rise of a range of new or previously uncommon floor behaviors by party
lead-ers, strongly relate to the decline in vote share by party leaders in recent elections.
Evidence also points to party leaders being actively targeted for defeat by the other
party: more money is spent in races featuring party leaders when controlling for party
identification. Indeed, races featuring party leaders feature more overall spending and
spending by the challenging party even when limiting the sample to the most closely
contested races. In total, party leaders have suddenly found themselves thrust into
more competitive (and expensive) reelection campaigns than most of their colleagues
as a result of changes within Congress that are in many ways outside of their control.
Broader Implications and and Conclusion
As Senate leaders are forced to focus more time on electoral politics, less time is
available for legislating. As stated by Cox & McCubbins (2005), legislators hold four
goals: winning reelection, having influence in Congress, shaping what they view to be
good public policy, and helping their party gain or maintain majority party status in
the institution. As demonstrated in this paper, two of those goals (winning reelection
and holding majority party status) have become more difficult for party leaders. As
time is a scarce resource, the additional time and effort party leaders must spend
on electoral politics comes at the expense of engaging in constructive policymaking
to electoral goals as a result of these additional burdens. Indeed, as some scholars such
as Mayhew (1974) note, winning reelection is the proximate goal for legislators as one
must first win reelection before pursuing other goals. In pursuit of this goal leaders
spend more time on electoral politics so as to preserve their place in Congress, thereby
spending less time on policymaking in an already-dysfunctional upper chamber.
Dysfunction in the Senate compounds upon itself as existing dysfunction provides
a further disincentive for cooperation among party leaders. Even when Senate
lead-ers want to pursue constructive policymaking opportunities at the expense of other
goals, the dysfunction that already exists in the body serves as a barrier to additional
action. Party leaders are then faced with the choice of investing time in policymaking
opportunities that are likely to prove to be fruitless or spending their time and efforts
on electoral politics. Thus the choice to focus on winning reelection and helping one’s
party maintain or attain the majority (or a filibuster-proof majority) is made even
more appealing by existing dysfunction in the body. As a result, dysfunction
contin-ues to grow in the Senate and it becomes even less likely that the body will engage
in constructive policy efforts.
An additional implication of this research relates to the type of senator who may
want to serve as a party leader in future years. Seeing the electoral challenges faced
by Tom Daschle, Harry Reid, and Mitch McConnell, a senator who has even a hint of
electoral problems may forgo running for a leadership position. As the polarization
of the cloture process makes it difficult to get anything done, the increased electoral
burdens now facing party leaders may make being a party leader simply not worth it
as electoral security, rather than policy credentials or the ability to pass legislation
determines which senators are most likely to become party leaders. In a time period
where political institutions have been unable to provide solutions to an array of
prob-lems, dysfunction may continue to compound upon itself, rendering the Senate even
less able to carry out its necessary functions. As a result, American democracy suffers
as democratic political institutions such as the Senate are increasingly seen as being
unable to provide adequate policy responses to the important policy issues of the day
APPENDIX: TABLES
Table 1: Summary Statistics, 1980-2002
Statistic N Mean St. Dev. Min Max
Absolute Margin 409 22.774 20.548 0.093 100
Open Seat 409 0.188 0.391 0 1
Average Presidential Margin 409 5.399 4.223 0 19
Midterm Decline 409 −0.042 0.708 1 1
Senate Leader 409 0.015 0.120 0 1
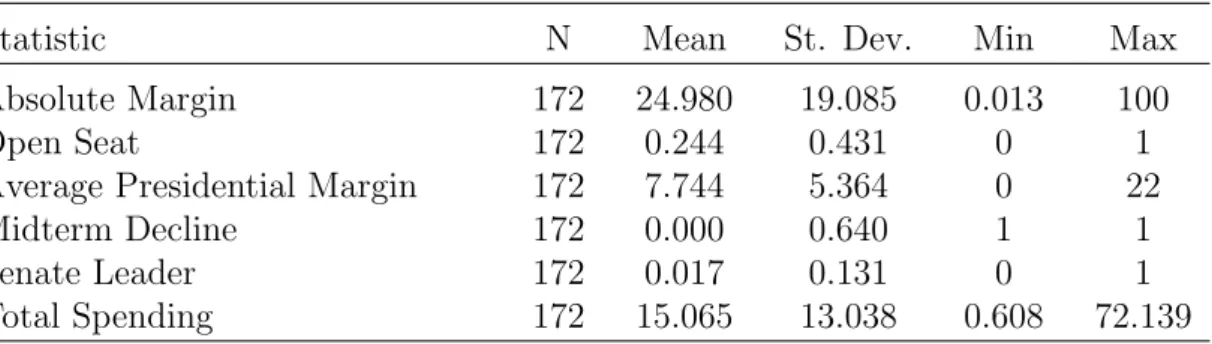
Table 2: Summary Statistics, 2004-2012
Statistic N Mean St. Dev. Min Max
Absolute Margin 172 24.980 19.085 0.013 100
Open Seat 172 0.244 0.431 0 1
Average Presidential Margin 172 7.744 5.364 0 22
Midterm Decline 172 0.000 0.640 1 1
Senate Leader 172 0.017 0.131 0 1
Total Spending 172 15.065 13.038 0.608 72.139
Table 3: Determinants of Senate Election Margins
Dependent variable:
Absolute Margin
(1980-2002) (2004-2012)
Average Presidential Margin 0.927∗ 1.174∗
(0.356) (0.121)
Senate Leader 8.195∗ −20.836∗
(3.051) (6.227)
Midterm Decline 3.683 4.905∗
(2.340) (0.341)
Open Seat −12.631∗ −8.151∗
(2.170) (1.969)
Constant 20.181∗ 18.241∗
(1.694) (1.536)
Observations 409 172
R2 0.112 0.204
Adjusted R2 0.103 0.185
χ2 (df = 4) 48.575∗ 39.347∗
Note:∗ p<0.05
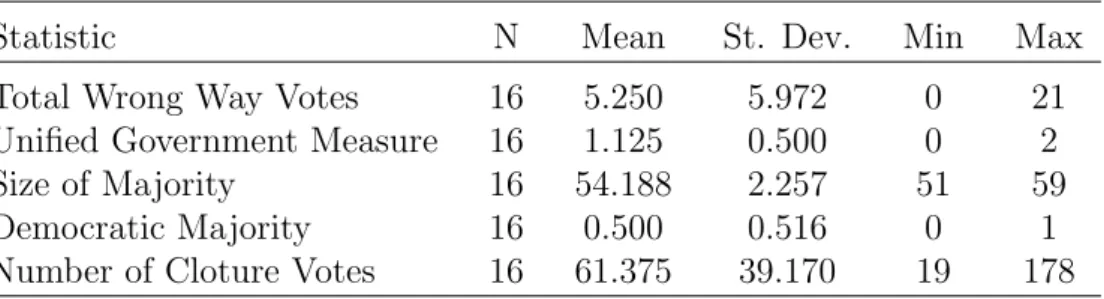
Table 4: Summary Statistics, Wrong Way Voting Model
Statistic N Mean St. Dev. Min Max
Total Wrong Way Votes 16 5.250 5.972 0 21
Unified Government Measure 16 1.125 0.500 0 2
Size of Majority 16 54.188 2.257 51 59
Democratic Majority 16 0.500 0.516 0 1
Table 5: Determinants of Wrong Way Voting, 97th to 112th Congresses
Dependent var.: Num. of Wrong Way Votes
Total Wrong Way Votes
Number of Cloture Votes 0.022∗
(0.007)
Total Votes 0.004
(0.002)
Size of Majority −0.129
(0.101)
Unified Government Measure −0.137
(0.482)
Democratic Majority 0.892
(0.511)
Constant 4.107
(5.705)
Observations 16
Log Likelihood −38.929
θ 2.517∗ (1.503)
Akaike Inf. Crit. 89.858
Note:∗ p<0.05
Table 6: Summary Statistics, Leader Model
Statistic N Mean St. Dev. Min Max
Leader Vote Percentage 9 61.689 7.845 49.400 70.100
Cloture Votes 9 55.667 28.749 23 112
Midterm Decline 9 0.000 0.500 1 1
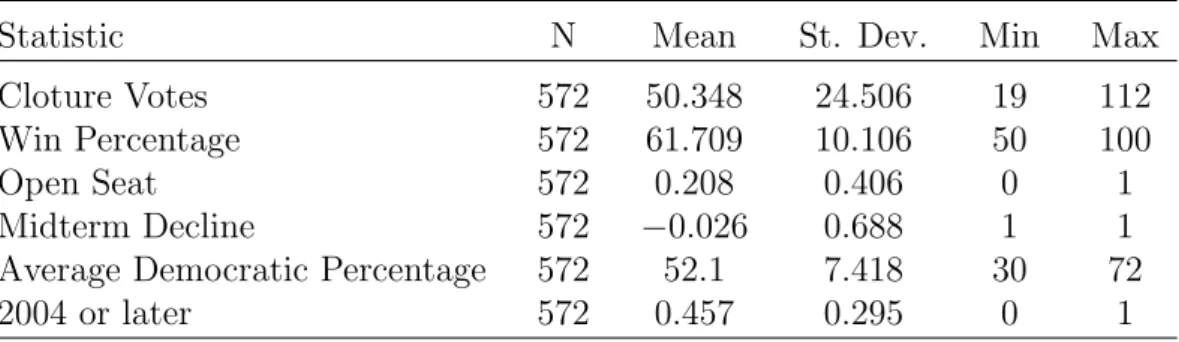
Table 7: Summary Statistics, Non-Leader Model
Statistic N Mean St. Dev. Min Max
Cloture Votes 572 50.348 24.506 19 112
Win Percentage 572 61.709 10.106 50 100
Open Seat 572 0.208 0.406 0 1
Midterm Decline 572 −0.026 0.688 1 1
Average Democratic Percentage 572 52.1 7.418 30 72
2004 or later 572 0.457 0.295 0 1
Table 8: Overall Spending in Senate Races, 2004-Present
Dependent variable:
Overall Spending in Millions of 2012 Dollars
Senate Leader 29.651∗
(3.385)
Average Presidential Margin −0.745∗
(0.119)
Midterm Decline −1.891∗
(0.437)
Population in Millions 0.500∗
(0.085)
Constant 17.167∗
(2.134)
Observations 172
R2 0.295
Adjusted R2 0.278
χ2 60.213∗ (df = 4)
Table 9: Cloture Votes and Vote Share for Senators
Dependent variable:
Leader Two Party Percent Winning Percent
Leader Non-leader
(1) (2)
Constant 38.088∗ 56.507
(11.114) (2.316)
Yearly Cloture Votes −0.214∗ 0.002
(0.063) (0.035)
Avg. Presidential Margin 0.670∗ 0.113∗
(0.216) (0.049)
Midterm Decline −0.854 1.967∗
(3.672) (0.820)
Open Seat −5.705∗
(0.755)
2004 or Later 1.539
(1.504)
Observations 9 572
R2 0.830 0.083
Adjusted R2 0.729 0.075
Residual Std. Error 4.085 (df = 5)
F Statistic 8.165∗ (df = 3; 5)
χ2 49.519∗ (df = 5)
Note: ∗p<0.05;
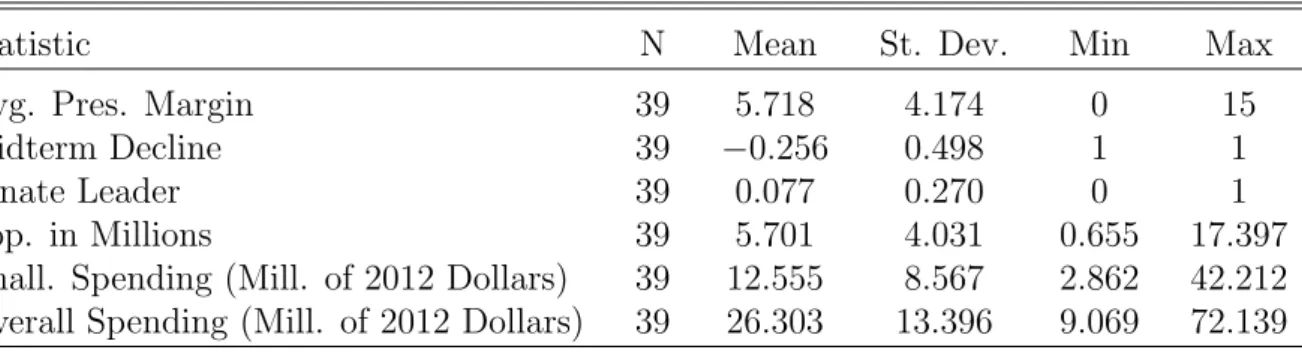
Table 10: Summary Statistics for Fourth Hypothesis Models
Statistic N Mean St. Dev. Min Max
Avg. Pres. Margin 39 5.718 4.174 0 15
Midterm Decline 39 −0.256 0.498 1 1
Senate Leader 39 0.077 0.270 0 1
Pop. in Millions 39 5.701 4.031 0.655 17.397
Chall. Spending (Mill. of 2012 Dollars) 39 12.555 8.567 2.862 42.212
Table 11: Spending in Competitive Races
Dependent variable:
Overall Spend. (Millions) Chall. Spend. (Millions)
(Overall Spending) (Challenger Spending)
Senate Leader 23.716∗ 10.871∗
(5.039) (5.236)
Avg. Pres. Margin −0.585 −0.301
(0.551) (0.358)
Midterm Decline −1.514 −0.764
(2.480) (1.630)
Population (Millions) 1.310∗ 0.789
(0.618) (0.446)
Constant 19.964∗ 8.746∗
(4.967) (3.170)
Observations 39 39
R2 0.392 0.267
Adjusted R2 0.320 0.181
χ2 (df = 4) 19.406∗ 12.131∗
REFERENCES
Abramowitz, Alan. 2012. U.S. Senate Elections in a Polarized Era. In The U.S. Senate: From Deliberation to Dysfunction, ed. Burdett Loomis. Washington DC: CQ Press.
Benen, Steve. 2014. “With real work to do, Senate GOP tries to run out
the clock.” http://www.msnbc.com/rachel-maddow-show/real-work-do-senate-gop-tries-run-out-the-clock.
Binder, Sarah A. & Steven S. Smith. 1997. Politics or Principle? Filibustering in the United States Senate. Brookings Institution Press.
Box-Steffensmeier, Janet M. 1996. “A Dynamic Analysis of the Role of War Chests in Campaign Strategy.” American Journal of Political Science 40(2):352–71.
Campbell, Angus. 1960. “Surge and Decline: A Study of Electoral Change.” Public Opinion Quarterly 24(3):397–418.
Carsey, Thomas & Jeffrey Harden. 2014. Monte Carlo Simulation and Resampling Methods for Social Science. Sage Publications.
Cowan, Richard. 2014. “Selling Mitch McConnell: What’s love got to do with it?” http://www.reuters.com/article/2014/09/21/us-usa-politics-mcconnell-idUSKBN0HG0EC20140921.
Cox, Gary W. & Mathew D. McCubbins. 1993. Legislative Leviathan: Party Govern-ment in the House. University of California Press.
Cox, Gary W. & Mathew D. McCubbins. 2005. Setting the Agenda: Responsible Party Government in the U.S. House of Representatives. New York: Cambridge University Press.
Craighill, Peyton & Scott Clement. 2014. “A majority of people don’t
like their own member of Congress. For the first time ever. .”
http://www.washingtonpost.com/blogs/the-fix/wp/2014/08/05/a-majority-of-people-dont-like-their-own-congressman-for-the-first-time-ever/.
Dahl, Robert. 1972. Polyarchy: Participation and Opposition. Yale University Press.
Fiorina, Morris. 1977. “The Case of the Vanishing Marginals: The Bureaucracy Did It.” American Political Science Review71(1):177–81.
Gallup. 2014. “Congress and the Public.” http://www.gallup.com/poll/1600/congress-public.aspx.
Harden, Jeff. 2012. “Improving Statistical Inference with Clustered Data.”Statistics, Politics, and Policy 20(1):1–27.
Heberlig, Eric S. & Bruce A. Larson. 2005. “Redistributing Campaign Contributions by Members of Congress: The Spiraling Costs of the Permanent Campaign.”
Legislative Studies Quarterly 30:597–624.
Heberlig, Eric S. & Bruce A. Larson. 2007. “Party Fundraising, Descriptive Represen-tation, and the Battle for Majority Control: Shifting Leadership Appointment Strategies in the U.S. House: 1990-2002.” Social Science Quarterly 88:404–21.
Heberlig, Eric S. & Bruce A. Larson. 2012. Congressional Parties, Institutional Am-bition, and the Financing of Majority Control. University of Michigan Press.
Ipsos. 2014. “Ipsos Poll Conducted for Reuters.”
http://ipsos-na.com/download/pr.aspx?id=13904.
Kurlantzick, Joshua. 2011. “The Great Democracy Meltdown.”
http://www.newrepublic.com/article/world/magazine/88632/failing-democracy-venezuela-arab-spring.
Lee, Frances E. 2009. Beyond Ideology: Politics, Principles, and Partisanship in the U.S. Senate. University of Chicago Press.
Long, J. Scott. 1997. Regression Models for Categorical and Limited Dependent Vari-ables. Sage Publications.
Madison, James, John Jay & Alexander Hamilton. 2003. The Federalist Papers. In
The Federalist Papers, ed. Clinton Rossiter & Charles Kessler. Washington DC: Signet Classics.
Mayhew, David R. 1974. Congress: The Electoral Connection. Yale University Press.
McCarty, Nolan, Keith T. Poole & Howard Rosenthal. 2006. Polarized America: The Dance of Ideology and Unequal Rices. MIT Press.
Newport, Frank. 2014. “Republicans More Focused on Immigration as Top Prob-lem.” http://www.gallup.com/poll/175310/republicans-likely-view-immigration-top-problem.aspx.
Roberts, Jason. 2007. “The Statistical Analysis of Roll Call Data: A Cautionary Tale.” Legislative Studies Quarterly 32(3):341–360.
Rohde, David W. 1991. Parties and Leaders in the Postreform House. University of Chicago Press.
Rowland, Kara. 2009. “Senate giant killer sees new Goliath.”
Sink, Justin. 2012. “Poll: Kentucky’s Mitch McConnell Ranks as Nation’s Least Pop-ular Senator.” http://thehill.com/blogs/blog-briefing-room/news/272257-poll-mcconnell-ranks-as-nations-least-popular-senator.
Smith, Steven S. 2014. The Senate Syndrome: The Evolution of Procedural Warfare in the Modern U.S. Senate. University of Oklahoma Press.
Swift, Elizabeth. 1996. The Making of An American Senate: Reconstructive Change in Congress, 1781-1841. University of Michigan Press.
Temp, Henrik. 2012. “Breaking News: Congress is Unpopular.” http://www.aei-ideas.org/2012/07/breaking-news-congress-is-unpopular/.
Wasserman, David. 2014. “Introducing the 2014 Cook Political Report Partisan Voter Index.” http://www.cookpolitical.com/5604.