DEVELOPMENT OF AN AEROSOL MASS SPECTROMETRY SYSTEM FOR THE ANALYSIS OF THE COMPOSITION OF AEROSOL PARTICLES IN REAL TIME
Sandra Elizabeth Spencer
A dissertation submitted to the faculty at the University of North Carolina at Chapel Hill in partial fulfillment of the requirements for the degree of Doctor of Philosophy in the Department of Chemistry (Analytical) in
the School of Arts and Sciences
Chapel Hill 2015
Approved by: Gary L. Glish
© 2015
ABSTRACT
Sandra Elizabeth Spencer: Development of an Aerosol Mass Spectrometry System for the Analysis of the Composition of Aerosol Particles in Real Time
(Under the direction of Gary L. Glish)
Commercially available aerosol mass spectrometers are capable of sampling compounds from size selected aerosol particles without the requirement for collection of aerosol particles onto a surface. However, one primary disadvantage of the systems available commercially is the inability to gain structural information from analytes in complex samples. Fragmentation of analytes during ionization results in convolution of the observed mass spectrum and prevents identification of analytes. Separation of compounds by gas chromatography prior to ionization allows analytes to be identified but limits the utility of the mass spectrometer for analysis of the composition of aerosol particles in real time. Though one commercial design employs an ion source that does not induce significant fragmentation during ionization, the mass analyzer cannot be used to perform tandem mass spectrometry and thus the instrument is not useful for structural analysis of compounds from aerosol particles.
The goal of the research presented in this dissertation is to develop an aerosol mass
ACKNOWLEDGEMENTS
First and foremost, I would like to thank my advisor, Gary Glish. Gary, thank you for always pushing me to improve, especially when it was the most difficult. Thank you for your advice, your
guidance, and all the opportunities you have made available to me in graduate school and beyond. Really and truly, no matter how unlikely this seems, thank you for every comment you have made on abstracts, papers, posters, talks, and this document. Your guidance has had a profound impact on my ability as a scientist and I count myself very lucky to have had the opportunity to learn from you.
I also would like to thank the entire Glish group, past and present members, for their friendship and support. Thank you all for having the time to brainstorm and work through problems, to help each other with experiments, and to have a laugh when it’s needed. The group has been a safe place to have ideas, be they good or bad. I will remember and cherish all of our failures and triumphs, all the intellectual corners we have backed ourselves into, and all the times it felt like we were arguing when we weren’t. I don’t think anyone could ask for a better community in which to learn and grow.
TABLE OF CONTENTS
LIST OF TABLES ... x
LIST OF FIGURES ... xi
LIST OF ABBREVIATIONS... xvii
CHAPTER 1: INTRODUCTION TO AEROSOL ANALYSIS BY MASS SPECTROMETRY ... 21
1.1 Importance of compositional analysis of aerosol particles ... 21
1.2 Analysis of the composition of aerosol particles ... 21
1.2.1 Challenges associated with compositional analysis of aerosols... 21
1.2.2 Collection of aerosol particles ... 22
1.2.3 Analysis of collected aerosol particles by mass spectrometry ... 23
1.2.4 Drawbacks associated with particle collection ... 24
1.3 Ambient sampling aerosol mass spectrometry ... 24
1.3.1 Commercially available instrumentation ... 24
1.3.2 Importance of the mass analyzer for structural analysis ... 26
1.3.3 Motivation for the work presented in this dissertation ... 27
1.4 Summary ... 27
REFERENCES ... 29
CHAPTER 2: EXPERIMENTAL ... 34
2.1 Materials and reagents... 34
2.2 Aerosol generation and off-line characterization ... 34
2.2.1 Aerosol particle generation ... 34
2.2.2 Determination of aerosol particle size distribution ... 35
2.2.3 Filter collection and extraction ... 36
2.3 Ionization ... 37
2.3.2 Desorption electrospray ionization ... 37
2.3.3 Paper spray ionization ... 38
2.3.4 Extractive electrospray ionization ... 38
2.3.5 Nano-extractive electrospray ionization ... 38
2.3.6 Low temperature plasma ionization ... 39
2.4 Mass spectrometry ... 42
2.4.1 Gas chromatography-mass spectrometry ... 42
2.4.2 Ion trap mass spectrometry... 43
2.5 Differential ion mobility spectrometry ... 45
2.6 Data analysis ... 47
REFERENCES ... 49
CHAPTER 3: IONIZATION OF COMPOUNDS FROM AEROSOL PARTICLES COLLECTED ON FILTERS... 50
3.1 Introduction ... 50
3.2 Electrospray ionization of compounds extracted from aerosol particles collected on filters ... 51
3.3 Effect of sample storage on the compounds observed ... 53
3.3.1 Storage of samples extracted from filters ... 53
3.3.2 Storage of unprocessed filters ... 54
3.4 Ionization of compounds in aerosol particles directly from filters ... 57
3.4.1 Desorption electrospray ionization ... 57
3.4.2 Paper spray ionization ... 58
3.4.3 Comparison of ESI, DESI, and paper spray ionization ... 59
3.5 Summary and conclusions ... 60
REFERENCES ... 62
CHAPTER 4: IONIZATION OF COMPOUNDS FROM AEROSOL PARTICLES ... 64
4.1 Introduction ... 64
4.2 Extractive electrospray ionization ... 65
4.2.1 Ionization of pyrolysis products from natural polymers ... 65
4.3 Low temperature plasma ionization ... 69
4.3.1 Influence of extraction/repelling voltage and desolvation gas flow rate ... 69
4.3.2 Ionization of pyrolysis products from natural polymers ... 72
4.3.3 Particle phase sampling ... 74
4.3.4 Flow-through LTPI ... 77
4.3.5 Development of the miniature LTPI source ... 77
4.3.6 Flow-through LTPI with the miniature ion source ... 82
4.3.7 Flow-through LTPI of pyrolyzed cellulose ... 83
4.4 Comparison of EESI and LTPI ... 85
4.5 Influence of the distance of the EESI emitter from the capillary inlet ... 86
4.6 Application of LTPI-MS to the analysis of e-cigarette vapors ... 87
4.6.1 Motivation for the analysis of e-cigarette aerosols ... 87
4.6.2 Analysis of aerosols produced by vaporization of e-liquids ... 88
4.6.3 Comparison of the compounds observed in GC-EI-MS, ESI-MS, and LTPI-MS ... 90
4.7 Summary and conclusions ... 91
REFERENCES ... 93
CHAPTER 5: LOW TEMPERATURE PLASMA IONIZATION-MASS SPECTROMETRY OF COMPOUNDS FROM SIZE SELECTED OF AEROSOL PARTICLES ... 97
5.1 Introduction ... 97
5.2 Differential Mobility Analysis Theory ... 98
5.3 DMA-LTPI-MS of pyrolysis products ... 100
5.4 Influence of Pyrolysis Temperature on Aerosol Particle Distributions ... 102
5.4 Summary and conclusions ... 107
REFERENCES ... 109
CHAPTER 6: DIFFERENTIAL ION MOBILITY SPECTROSCOPY OF CELLULOSE PYROLYSIS PRODUCTS ... 112
6.1 Introduction ... 112
6.2 Ion mobility spectrometry theory ... 113
6.3.1 LTPI-DIMS-MS ... 115
6.3.2 LTPI-DIMS-MS/MS ... 121
6.3 Summary and conclusions ... 124
REFERENCES ... 126
CHAPTER 7: INTERROGATION OF ION STRUCTURE USING TANDEM MASS SPECTROMETRY .. 128
7.1 Introduction ... 128
7.2 MS/MS of ions produced from pyrolysis ... 128
7.2.1 Influence of pyrolysis heating rate and maximum temperature on MS/MS spectra ... 128
7.2.2 Are ions thermalized prior to MS/MS? ... 132
7.3 Differentiation of functional groups using neutral losses ... 136
7.3.1 Tandem mass spectrometry of ionized cellulose pyrolysis products ... 136
7.3.2 Principal component analysis of neutral losses ... 138
7.3.3 Insights from high mass accuracy tandem mass spectrometry ... 138
7.3.4 Structural information gained from unexpected neutral losses ... 140
7.4 In-trap ion-molecule reactions ... 142
7.4.1 Phenomenological rate constant for protonated levoglucosan ... 142
7.4.2 Source of the gaseous neutrals in the QIT ... 146
7.4.3 Influence of EESI solvent on ion structure ... 148
7.4.4 MS/MS to investigate protonated levoglucosan ion structures ... 151
7.5 Limitations of CID for identification of ions ... 153
7.6 Summary and conclusions ... 154
REFERENCES ... 156
CHAPTER 8: SUMMARY AND FUTURE DIRECTIONS ... 158
8.1 Summary ... 158
8.2 Suggested future experiments ... 159
8.2.1 On-Filter Derivatization (Chapter 3) ... 159
8.2.2 Nano-EESI (Chapter 4) ... 160
8.2.4 Improving the reproducibility of LTPI-MS of size-selected aerosol particles (Chapter 5) ... 161
8.2.5 Tandem mass spectrometry with differential ion mobility spectrometry (Chapter 6) ... 162
8.2.6 Tandem mass spectrometry of unreactive levoglucosan structures (Chapter 7) ... 162
8.2.7 Confirmation of analyte identification ... 163
8.3 Overall project outlook ... 163
REFERENCES ... 165
APPENDIX I: ANALYSIS OF E-CIGARETTE LIQUIDS ... 166
REFERENCES ... 171
LIST OF TABLES
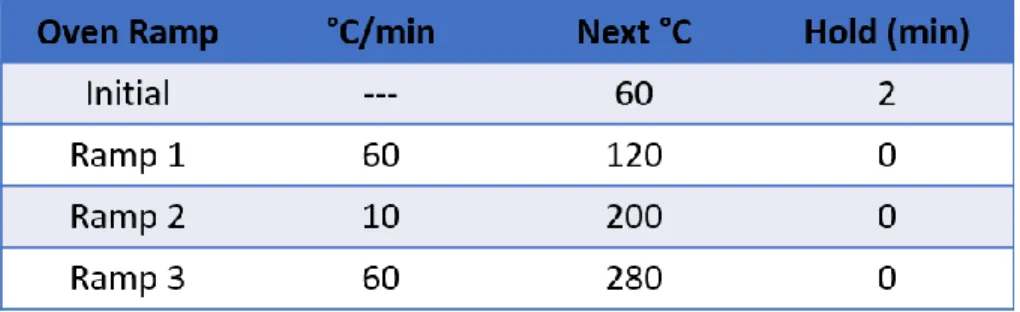
Table 2.1. GC-MS heating profile for separation of compounds from e-cigarette liquids. ... 43 Table 4.1. Ions observed from the LTPI-MS spectrum of Atomic Cinnacide compared to GC-EI-MS and
ESI-MS. ... 90 Table 6.1. Summary of the resolution of ions separated by DIMS. ... 122 Table 7.1. Summary of Gaussian fit parameters (peak centroid Ec, FWHM, and area (A)) for the curves
shown in Figure 7.7. ... 136 Table 7.2. Summary of MS/MS product ions observed from CID of 50 most abundant ions produced by
LTPI of the pyrolysate of cellulose. ... 137 Table AI.1. Compounds identified in Atomic Cinnacide e-liquid by GC-MS with pertinent MSDS
LIST OF FIGURES
Figure 2.1. Photograph of cellulose (right), lignin (middle), and 60/40 cellulose/lignin. ... 34
Figure 2.2. Experimental pyrolysis set-up. Sample is placed in the crucible and is heated by thermal transfer from a resistively heated wire. Temperature is monitored throughout the experiment. ... 35
Figure 2.3 A. Schematic for and B. picture of the experimental set-up for the collection of aerosol particles on TFE coated borosilicate glass fiber filters. ... 36
Figure 2.4. Schematic for the SESI experiment. ... 37
Figure 2.5. A. Schematic for and B. picture of the DESI experiment. ... 37
Figure 2.6. A. Schematic for and B. photo of the paper spray ionization experiment... 38
Figure 2.7. Schematic of the EESI experiment. ... 38
Figure 2.8. Schematic for the experimental set up of nano-EESI. ... 39
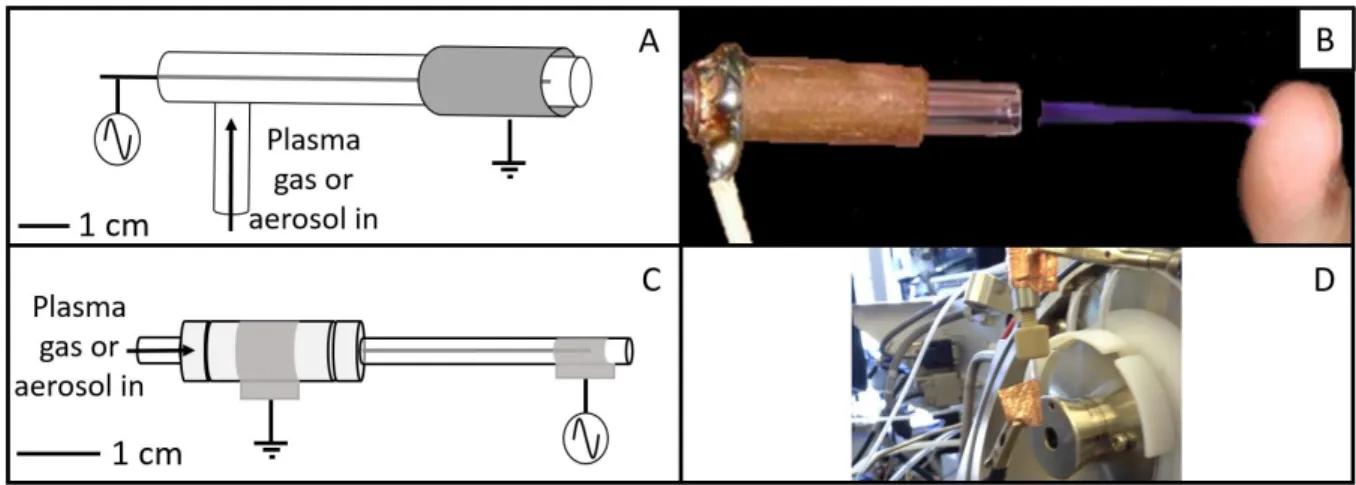
Figure 2.9. Schematic for the power supply used to generate the low temperature plasma. Variable output from 0 - 4.25 kV0-p with a frequency of 5 kHz. ... 40
Figure 2.10. A. Schematic for and B. picture of the standard-size LTPI source and C. schematic for and D. picture of the miniature LTPI source used in these experiments. ... 41
Figure 2.11. Conventional LTPI-MS experimental set up with the A. standard-size LTPI source and B. miniature LTPI source for analysis of gaseous or aerosolized samples. ... 43
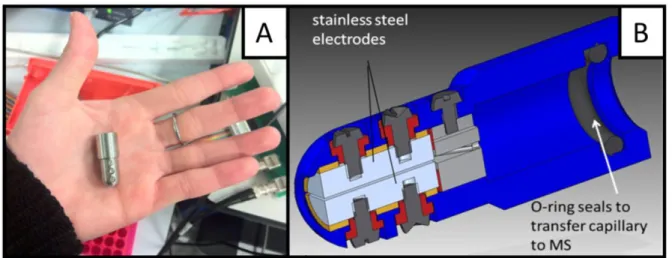
Figure 2.12. A. Picture and B. AutoCAD drawing of the DIMS assembly used for the experiments described herein. ... 45
Figure 2.13. Simplified representation of the generation of a bisinusoidal waveform with two sinusoidal waveforms. ... 46
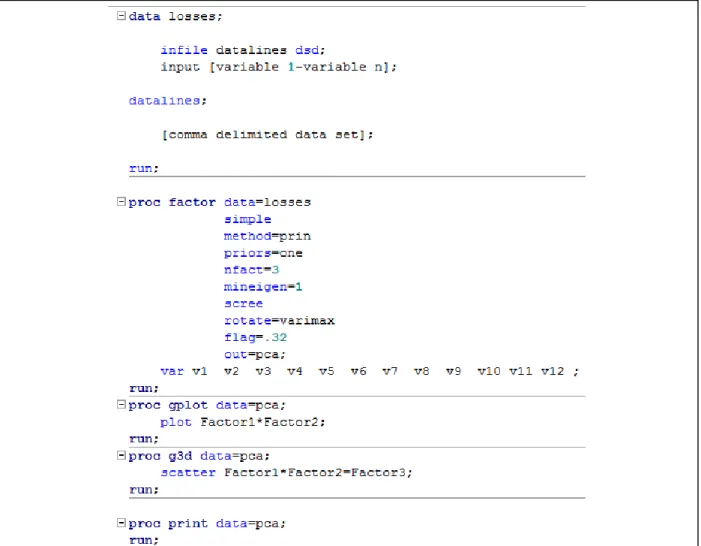
Figure 2.14. SAS 9.3 script for generation of a principal component analysis of the product ions generated by tandem mass spectrometry. ... 47
Figure 3.1. ESI-MS of a blank filter, extracted, diluted by a factor of 10 and ionized using an electrospray solvent of A. 50/49/1 methanol/water/acetic acid B. 100% methanol C. 100% acetonitrile and D. extracted in 100% methanol and diluted by a factor of 10 into 50/49/1 methanol/water/acetic acid for ESI. ... 51
Figure 3.2. ESI-MS of the compounds from the aerosol produced by pyrolysis of ethyl cellulose collected on a filter, extracted in methanol, diluted by a factor of 10, and ionized using A. 50/49/1 methanol/water/acetic acid B. 100% methanol C. 100% acetonitrile and D. extracted in 100% methanol and diluted by a factor of 10 into 50/49/1 methanol/water/acetic acid for ESI. Prominent background ions are observed at m/z 285, 287, and 391. Solvent background ion at m/z 131 for acetonitrile. ... 52
Figure 3.4. ESI-MS spectra observed when the aerosol produced from the pyrolysis of ethyl cellulose was collected on filters and stored at -18 °C prior to A. extraction Day 0, analysis Day 0, B. extraction Day 7, analysis Day 7, C. extraction Day 14, analysis Day 14 and C. extraction Day 7, analysis Day 14. ………... 55 Figure 3.5. SESI-MS spectra of the volatile compounds from the aerosol particles produced from
pyrolyzed ethyl cellulose collected on filters when the SESI solvent is A. methanol or B.
acetonitrile. ……… 56 Figure 3.6. DESI-MS of the compounds produced by the pyrolysis of ethyl cellulose and collected on a
filter using A. 50/49/1 methanol/water/acetic acid B. methanol and C. acetonitrile. ... 58 Figure 3.7. Paper spray mass spectrum observed from the aerosol produced by pyrolysis of ethyl
cellulose collected on a filter and ionized using 50/49/1 methanol/water/acetic acid. ... 59 Figure 3.8. Pyrolyzed crude tobacco cellulose extract collected on filters prior to A. extraction in methanol
and ESI B. DESI or C. paper spray ionization. The spray solvent used was 50/49/1
methanol/water/acetic acid for all experiments. ... 60 Figure 4.1. Positive ion mode EESI mass spectra produced using 50/49/1 methanol/water/acetic acid as
an electrospray solvent for the pyrolysate of A. ethyl cellulose B. colloidal grade cellulose C. binder grade cellulose D. hemicellulose and E. lignin. The ion of m/z 149 is a known background
contaminant. ... 66 Figure 4.2. Lignin monomers A. p-coumaryl alcohol B. p-coniferyl alcohol and C. p-sinapyl alcohol. ... 67 Figure 4.3. Negative ion mode EESI mass spectra produced using 50/49/1 methanol/water/acetic acid as
an electrospray solvent for pyrolyzed A. ethyl cellulose B. colloidal grade cellulose C. hemicellulose and D. lignin. ... 68 Figure 4.4. Positive ion mode EESI spectra of pyrolyzed ethyl cellulose using A. 50/49/1
methanol/water/acetic acid B. acetonitrile C. methanol D. 50/50 methanol/chloroform or E. 50/50 methanol/toluene as an electrospray solvent. ... 69 Figure 4.5. Positive mode LTPI mass spectra of pyrolyzed ethyl cellulose generated using the
standard-size LTPI source with A. the LTPI source floated at 0 kV and an extraction voltage of -4.0 kV applied to the capillary inlet to the mass spectrometer and B. a repelling voltage applied by floating the LTPI source at +4.0 kV and 0 kV applied to the capillary inlet to the mass spectrometer. ... 70 Figure 4.6. Positive ion mode LTPI mass spectra observed at extraction voltages and desolvation gas
flow rates of A. -4.5 kV, 5.0 L/min B. -2.5 kV, 5.0 L/min C. -0.5 kV, 5.0 L/min D. -4.5 kV, 2.5 L/min E. -2.5 kV, 2.5 L/min F. -0.5 kV, 2.5 L/min G. -4.5 kV, 0.5 L/min H. -2.5 kV, 0.5 L/min I -0.5 kV,
0.5 L/min generated using the standard-size LTPI source. ... 71 Figure 4.7. Positive ion mode LTPI mass spectrum for pyrolyzed A. ethyl cellulose B. cellulose C.
hemicellulose D. lignin and E. 60/40 cellulose/lignin using the standard-size LTPI source. ... 72 Figure 4.8. Negative ion mode LTPI mass spectrum for pyrolyzed A. ethyl cellulose B. cellulose and C.
lignin generated using the standard-size LTPI source. ... 74 Figure 4.9. Positive ion mode LTPI mass spectrum of pyrolyzed ethyl cellulose A. through the filter holder
Figure 4.10. MS/MS spectra of ions generated by LTPI of A. m/z 155 without the denuder and B. m/z 155 with the denuder, C. m/z 183 without the denuder and D. m/z 183 with the denuder, E. m/z 201 without the denuder and F. m/z 201 with the denuder. ... 76 Figure 4.11. Mass spectra generated from ethyl cellulose pyrolyzed in the custom built pyrolysis chamber
at approximately 600 °C and ionized by A. flow-through LTPI or B. conventional LTPI with the
standard-size LTPI source and helium as the plasma gas. ... 78 Figure 4.12. Graphical representation of Paschen's curve adapted from Lieberman, et. al. ... 78 Figure 4.13. Mass spectra generated from ethyl cellulose pyrolyzed in the PyroProbe at 650 °C and
ionized by conventional LTPI with the A. miniature LTPI source or B. standard LTPI source and helium as the plasma gas. ... 80 Figure 4.14. Mass spectra from ethyl cellulose pyrolyzed in the commercial pyrolysis instrument and
ionized using the miniature LTPI source in the conventional configuration with A. nitrogen plasma gas and B. helium plasma gas. ... 81 Figure 4.15. Mass spectra from ethyl cellulose pyrolyzed in the commercial pyrolysis instrument and
ionized using the nitrogen plasma gas in the A. conventional configuration and B. flow-through
configuration. ... 82 Figure 4.16. Ionization of the cellulose pyrolysis products using the miniature LTPI probe in the A.
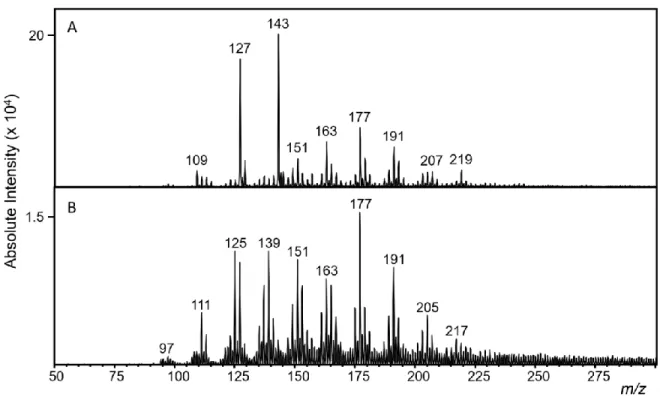
conventional or B. flow-through configuration. ... 84 Figure 4.17. Flow-through LTPI-FTICR-MS of pyrolyzed cellulose ions of A. m/z 177 and 178 and B. m/z
195 and 196. ... 85 Figure 4.18. Product ion spectra generated by CID of the ion of m/z 183 formed by A. EESI with 50/49/1
methanol/water/acetic acid or B. LTPI with the standard-size source... 86 Figure 4.19. EESI-MS spectra generated using 50/49/1 methanol/water/acetic acid as an ESI solvent and
the emitter placed A. 2 mm B. 1 mm or C. 0.5 mm from the inlet to the mass spectrometer. Blue asterisks denote EESI-type ions and red asterisks indicate LTPI-type ions. ... 87 Figure 4.20. Background subtracted LTPI-MS spectra for A. Peanut Butter Cookie (12 mg/mL nicotine) B.
Hot Cinnamon Candies (12 mg/mL nicotine) C. Menthol Tobacco (12 mg/mL nicotine) and D. Atomic Cinnacide (0 mg/mL nicotine). Peaks with negative absolute intensities were not plotted as they are an artifact of the background subtraction; background ions with a lower proton affinity than the analyte ions will be less abundant when the sample is present and subtraction results in a negative ion intensity. ... 89 Figure 5.1. Schematic of the differential mobility analyzer used to generate monodisperse aerosol... 100 Figure 5.2. A. Lognormal count distribution and B. lognormal mass distribution for ethyl cellulose
pyrolyzed at approximately 400 °C. ... 101 Figure 5.3. DMA-LTPI-MS of aerosol particles of A. 50 nm and B. 120 nm produced by pyrolysis of ethyl
cellulose at approximately 400 ⁰C in the custom pyrolysis chamber. ... 102 Figure 6.1. Schematic of a low field ion mobility separation. The voltage gradient is depicted below the
Figure 6.4. Cellulose pyrolyzed at 650 °C, ionized by LTPI, and mass analyzed using the A. linear ion trap or B. FTICR mass analyzer. ... 115 Figure 6.5. DIMS separation of background ions generated by LTPI. For the purposes of visualization,
each mass-to-charge ratio is normalized in the compensation field domain to the most intense ion.116 Figure 6.6. DIMS separation of ions produced by LTPI of cellulose pyrolyzed at 650 °C in the PyroProbe.
For the purposes of visualization, each mass-to-charge ratio is normalized in the compensation field domain to the most intense ion... 117 Figure 6.7. Cellulose pyrolyzed at 650 °C and ionized by flow-through LTPI A. averaged over the course
of a compensation field scan B. with the DIMS electrode set at the same potential as the capillary and C. with no DIMS. ... 117 Figure 6.9. Compensation field scan for the ions of m/z 121 and 122 produced by LTPI of compounds
from cellulose pyrolyzed at 650 °C. ... 118 Figure 6.8. Expanded region of the heat map produced by LTPI-DIMS-MS of the pyrolysis products of
cellulose produced at 650 °C in the PyroProbe. ... 118 Figure 6.10. Compensation field scan for the ions of m/z 97 and 109 produced by LTPI of compounds
from cellulose pyrolyzed at 650 °C. ... 119 Figure 6.11. Comparison of the centroid compensation field values determined from Gaussian fitting of
the XIC traces generated by DIMS separation of the ions generated by LTPI of pyrolyzed
cellulose. ……….. 121 Figure 6.12. MS/MS of the ion of m/z 155 produced by LTPI of the aerosol produced by pyrolysis of
cellulose at 650 °C A. averaged over the course of a DIMS separation or B. without any ion
separation. ... 122 Figure 6.13. LTPI-DIMS-MS of the aerosol produced by the pyrolysis of cellulose at 650 °C in the
PyroProbe A. XIC trace for the ion of m/z 155 and LTPI-DIMS-MS/MS spectra generated with a Ec of
B. 5 V/cm C. +60 V/cm and D. +120 V/cm. ... 123 Figure 7.1. MS spectra generated by LTPI of cellulose pyrolyzed at 650 °C with a heating rate of A.
10 °C/s or B. 100 °C/s. ... 129 Figure 7.2. CID of ions produced by LTPI of cellulose pyrolyzed at 650 °C. MS/MS of the ion of m/z 155
produced with a heating rate of A. 10 °C/s B. 50 °C/s C. 100 °C/s and MS/MS of the ion of m/z 143 produced with a heating rate of D. 10 °C/s E. 50 °C/s F. 100 °C/s. ... 130 Figure 7.3. MS spectra generated by LTPI of A. background or cellulose pyrolyzed at a maximum
temperature of B. 200 °C C. 400 °C D. 650 °C and E. 900 °C. ... 131 Figure 7.4. MS/MS spectra produced by CID of m/z 155 from cellulose pyrolyzed at A. 400 °C B. 650 °C
C. 900 °C or CID of m/z 143 from cellulose pyrolyzed at D. 400 °C E. 650 °C F. 900 °C. ... 131 Figure 7.5. MS/MS spectra produced by CID of the ion of m/z 143 formed from LTPI of the products of
pyrolysis of cellulose heated at 10 °C/s to A. 650 °C with 0 ms cooling time and B. 650 °C with 100 ms cooling time or C. 900 °C with 0 ms cooling time and D. 900 °C with 100 ms cooling time. ... 133 Figure 7.6. LTPI-DIMS-MS of the ion of A. m/z 155 and B. m/z 143 formed from the pyrolysis of cellulose
Figure 7.7. FTICR-MS of the ions of A. m/z 155 and B. m/z 143 formed by flow-through LTPI of cellulose produced at 650 °C. ... 134 Figure 7.8. Gaussian fits to the DIMS-MS spectra produced from LTPI-DIMS-MS of m/z 155 at A. 400 °C
B. 650 °C C. 900 °C and m/z 143 at D. 400 °C E. 650 °C F. 900 °C. ... 135 Figure 7.9. PCA of the first 12 neutral losses from 50 ions most abundant ions formed by LTPI of
cellulose aerosol product. ... 138 Figure 7.10. LTPI-MS/MS of the ion of m/z 201 mass analyzed in the A. FTICR and B. LIT. ... 139 Figure 7.11. MS/MS of m/z 155 formed from LTPI of A. volatilized 2,6-dimethoxyphenol or B. cellulose
aerosol product formed at 650 °C. ... 141 Figure 7.12. MS scan produced by volatilized levoglucosan ionized by EESI with 50/49/1/
methanol/water/acetic acid. The inset is the MS/MS spectrum of m/z 163. ... 142 Figure 7.13. Mass spectra of protonated levoglucosan ionized by EESI, isolated, and trapped for A. 0 ms,
B. 300 ms, C. 600 ms, D. 900 ms. ... 143 Figure 7.14. Fraction of A. levoglucosan in the adducted form with respect to time B. Fraction of adducted
levoglucosan present with respect to time and C. plot of the integrated first order rate law for the reaction of levoglucosan when 50/49/1 methanol/water/acetic acid is used as the EESI solvent. .... 144 Figure 7.15. Plot of the pseudo first order integrated rate law for the reaction of m/z 163 with water and
methanol in the ion trap. ... 146 Figure 7.16. A. Fraction of protonated levoglucosan formed by EESI present as a methanol adduct with
respect to time and B. fraction of protonated levoglucosan present as a water adduct with respect to time. ... 147 Figure 7.17. Fraction of levoglucosan in the protonated form with respect to time when 99/1
acetonitrile/acetic acid is used as the EESI solvent. ... 149 Figure 7.18. EESI-MS of volatilized levoglucosan ionized using A. 50/49/1 methanol/D2O/acetic acid and
B. 50/49/1 methanol/H2O/acetic acid. ... 149
Figure 7.19. EESI-MS with 50/49/1 methanol/D2O/acetic acid of volatilized levoglucosan after isolation
and trapping of the ion of m/z 163. ... 150 Figure 7.20. A. Fraction of protonated levoglucosan generated by EESI using 50/49/1
methanol/water/acetic acid remaining with respect to time and B. first order integrated rate law for the reaction of levoglucosan with solvent in the ion trap. ... 151 Figure 7.21. MS/MS spectra generated by CID of protonated levoglucosan formed by EESI using A.
50/49/1 methanol/H2O /acetic acid B. 99/1 acetonitrile/acetic acid and C. 50/49/1 methanol/D2O/acetic
acid. ... 152 Figure 7.22. MS/MS spectra from the ion of m/z 127 produced by LTPI of A. volatilized
5-(hydroxymethyl)furfural B. volatilized 3-hydroxy-2-methyl-4-pyrone and C. cellulose aerosol
product. ……… 153 Figure 8.1. Mass spectra observed from pyrolyzed ethyl cellulose ionized using nano-EESI and a solvent
of A. 50/49/1 methanol/water/acetic acid B. acetonitrile and EESI with a solvent of C. 50/49/1
Figure AI.1. Representative e-cigarette devices. Picture modified from
LIST OF ABBREVIATIONS
A area
ac alternating current
AMS aerosol mass spectrometer
amu atomic mass unit
APCI atmospheric pressure chemical ionization
AU arbitrary units
BSRI blank subtracted relative intensity
°C degrees Celsius
C capacitor
𝑐𝑐 slip correction coefficient CID collision induced dissociation
cm centimeter
CPC condensation particle counter
CV compensation voltage
dc direct current
Da Dalton
DESI desorption electrospray ionization DIMS differential ion mobility spectrometry
𝑑𝑁
𝑑𝑙𝑜𝑔𝐷𝑝 particle number density 𝑑[𝑋]+
𝑑𝑡 rate of formation of [X]
+
𝑑𝑊
𝑑𝑙𝑜𝑔𝐷𝑝 particle mass density DMA differential mobility analyzer
𝐷𝑝 particle diameter
DV dispersion voltage
Ec compensation field
ED dispersion field
EI electron ionization
EESI extractive electrospray ionization ESI electrospray ionization
f frequency
ft foot
FTICR Fourier transform ion cyclotron resonance FWHM full width at half maximum
GC gas chromatography
HV high voltage
i current
i.d. inner diameter
IMS ion mobility spectrometry 𝐼𝑚/𝑧 # intensity of the ion of m/z # 𝑘# rate constant for the ion of m/z #
𝑘−# rate constant for the back reaction of the ion of m/z #
𝑘𝐵 Boltzmann constant
KH high field ion mobility
kHz kilohertz
KL low field ion mobility
kV kilovolt
kV0-p kilovolt measured from zero to peak
k kiloOhm
L liter
LC liquid chromatography LIT linear ion trap
LTPI low temperature plasma ionization
LV low voltage
M neutral molecule
m meter
m/z mass-to-charge ratio
MALDI matrix assisted laser desorption ionization
MS mass spectrometry
MSn n stages of mass spectrometry
MS/MS tandem mass spectrometry MeOH methanol
MHz megahertz
MSDS Material Safety Data Sheet
𝜇 sheath gas viscosity
F microFarad
g microgram
L microliter
m micrometer
mg milligram
min minute
mL milliliter
mm millimeter
ms millisecond
M neutral molecule
𝑛 number of charges
𝑛̅ average number of charges
nF nanoFarad
nm nanometer
pi
p- para-
PCA principle component analysis ppm parts per million
psi pounds per square inch 𝜌𝑝 particle density
R resolution
R# resistor number #
rf radio frequency
s second
SESI secondary electrospray ionization
t time
T temperature
TD thermal desorption
TFE tetrafluoroethylene TOF time of flight
V volt
𝑣𝑡𝑒 terminal electric velocity 𝑣𝑦 velocity of a sheath gas QIT quadrupole ion trap
Ohm
radial frequency (2f) XIC extracted ion current 𝑍 electrical mobility
% percent
° degrees
CHAPTER 1: INTRODUCTION TO AEROSOL ANALYSIS BY MASS SPECTROMETRY 1.1 Importance of compositional analysis of aerosol particles
Analysis of aerosol particles is critical due to pivotal the role of aerosols in a diverse range of applications. For example, the influence of aerosol particles on the global climate by radiative forcing due to absorption or scattering of incoming solar radiation is dependent upon both the diameter and
composition of the aerosol particles.1,2 Deposition of aerosol particles in airways is dependent upon
particle diameter and as such both the diameter and composition of aerosol particles play an important role in disease development3,4 and drug delivery5,6. Evaluation of the composition of aerosol particles is
also of importance for purposes including secondary organic aerosol formation,7,8 air quality monitoring,9
and detection of biochemical warfare agents10. The chemical composition of aerosol particles is of
particular interest because the chemical characteristics of aerosols impact their physical properties. The presence of hygroscopic compounds in an aerosol particle can influence the particle diameter because the amount of water present in the particle depends on the relative humidity.11 Partitioning of analytes
between the gas and particle phase depends on the vapor pressure, and therefore the identity, of the analyte.12 Compounds in aerosol particles can also undergo secondary reactions,13 resulting in a dynamic
aerosol composition. The goal of the work presented herein is to develop tools to gain a more accurate understanding of the chemical composition of aerosol particles at any point in time after aerosol formation.
1.2 Analysis of the composition of aerosol particles
1.2.1 Challenges associated with compositional analysis of aerosols
Analysis of the composition of aerosol particles poses a significant analytical challenge because of the dynamic and complex nature of aerosol samples.14,15 Aerosols exist as a mixture of solid and/or
liquid particles suspended in a gaseous medium, resulting in a sample that is difficult to evaluate by traditional analytical methodolgy.14 Deployment of an instrument for aerosol analysis can prove to be
(approximately 1-100 g/mL) are expected for applications requiring atmospheric monitoring,14 requiring
an increase in sample quantity for adequate analyte detection. For these reasons, aerosol particles are commonly collected onto a surface to increase sample quantity and allow for sample transport. 1.2.2 Collection of aerosol particles
A variety of methods exist to increase sample quantity by collection of aerosol particles in a form that is suitable for transport and analysis.17,18 By far the most common particle collection techniques are
impaction and filtration as each offer specific sampling advantages.17 Impactors utilize the inertia of
aerosol particles in a gas stream to collect the particles on a surface. Aerosol particles with an inertia greater than the cutoff inertia of the impactor collide with the surface and are collected. Impactors can be used to collect size-fractioned aerosol particles because the particle inertia is dependent on the particle size.19,20 A cascade impactor employs multiple stages of aerosol collection to increase the inertia of
particles such that aerosol particles of decreasing diameter are impacted on each subsequent stage.20
However, solid particles can bounce off the impactor surface rather than deposit, leading to poor
sampling efficiency and errors in particle sizing.17,21 Though the impaction surface can be coated with an
adhesive to reduce the extent of particle bounce, sampling artifacts are introduced depending on the composition of the adhesive used.21,22
Collection of aerosol particles on a porous filter is an alternative to impaction that is less expensive and has a higher sample capacity.17 However, more evaporative loss of semi-volatile
compounds is predicted to occur during filtration as opposed to impaction due to the pressure gradient across the filter.17 Many materials are available for use as filters, each with their own advantages. Quartz
filters are amenable to analytical techniques that require high temperatures such as thermogravimetric analysis but adsorption of gaseous molecules onto quartz filters23 requires that a backup filter be used to
collect gas phase material for background subtraction.17 However, due to evaporative losses from
semi-volatile compounds from aerosol particles during filter collection, there is debate about the efficacy of this background subtraction.17 Teflon and Teflon coated glass fiber filters are also available
commercially.24 Less adsorption of gaseous neutrals from the sample onto Teflon filters occurs as
1.2.3 Analysis of collected aerosol particles by mass spectrometry
Mass spectrometry (MS) is a valuable tool for aerosol analysis because of its speed, sensitivity, and selectivity. To make compounds collected from aerosol samples amenable to mass spectrometric analysis, gaseous ions must first be formed. Typically, analytes from aerosol particles collected onto surfaces are extracted into solution,25,26 derivatized,25-27 and volatilized for ionization by electron ionization
(EI). EI is commonly used for ionization of compounds from aerosol particles because it is a nearly ubiquitous ion source for gaseous analytes. Enough excess internal energy is imparted to the compounds during ionization by EI to induce fragmentation of the analytes prior to mass analysis. Though these fragmentation patterns can be used to gain structural information from analyte molecules,28 in complex
mixtures of compounds such as organic aerosols fragmentation patterns overlap in the mass spectrum and little information as to the identity of the compounds in the initial sample can be elucidated.29 Gas
chromatography (GC) is often used prior to EI to separate analytes and preserve the structural
information gained from ion fragmentation during ionization.25,26 However, GC-EI-MS is not amenable to
involatile or thermally labile analytes.
As an alternative to EI, electrospray ionization (ESI) can be used to ionize involatile or
semi-volatile polar compounds extracted into solution from collected aerosol particles.26 The amount of
internal energy imparted to ions during ESI is low enough that little to no fragmentation of analytes occurs.30 Tandem mass spectrometry (MS/MS) can be performed to gain structural information from the
dissociation patterns of intact analyte ions.31,32 Liquid chromatography (LC)-MS may also be used to
separate isomeric analytes prior to ionization.26
Matrix assisted laser desorption ionization (MALDI)-MS may be used to ionize a small volume (< 10 L) of the filter extract spotted onto a surface and coated in a matrix (often graphite).7 A laser pulse
is used to desorb matrix and analyte molecules from the surface and protonated ions are generated.33,34
1.2.4 Drawbacks associated with particle collection
Aerosol particle collection can be time consuming (hours to days)35,36 and may also result in
sampling artifacts from particle bounce, gas adsorption, and semi-volatile analyte evaporation as discussed in Section 1.2.2.17 Secondary reactions and evaporative losses are known to occur within
aerosol particles as the particles age, leading to changes in the chemical composition of the particles over time.37,38 These types of reactions could also occur after particle collection during sample storage and
transport.
Concerns about the analyte extraction step have also been raised. Extraction of compounds from surfaces typically involves sonication of the surface in an organic solvent for up to an hour.25,39 Reactions
of carboxylic acid and carbonyl containing compounds from organic aerosol particles with commonly used organic solvents such as methanol have been reported to occur over the course of minutes to hours, within typical analysis timeframes for aerosol particles collected onto a surface.40 To reduce analysis time
and decrease the likelihood of analyte reaction and evaporative sample loss, the sample collection and extraction steps should be eliminated. Instead, compounds should be ionized directly from the aerosol particles in the environment in which they were formed.
1.3 Ambient sampling aerosol mass spectrometry 1.3.1 Commercially available instrumentation
Three ion source designs have been made commercially available for the rapid analysis of aerosol particles.41,42 The first two ion source designs that will be discussed utilize an aerodynamic lens to
introduce aerosol particles into the vacuum system of the mass spectrometer. In the first ion source geometry, the aerosol particles are impacted on a heated surface to volatilize the compounds in the particles. EI is used to ionize the volatilized compounds from the aerosol particles.41 In an alternative ion
source design, laser ablation/ionization is used to volatilize and ionize compounds directly from the aerosol particles.42 For organic aerosols with a complex chemical composition, typically only the percent
carbon in the sample can be determined from the laser ablation/ionization or EI mass spectrum43 because
the energy of the laser and the amount of time between ionization and mass analysis.42,44 However, the
use of a tunable laser in this experiment adds significant complexity and cost to the analysis. A commercial aerosol mass spectrometer designed to separate compounds from aerosol particles before ionization to reduce or prevent mass spectral convolution due to ion fragmentation is currently under development.45,46 Aerosol particles are collected on a surface by impaction. Thermal
desorption (TD) is used to volatilize the compounds from the aerosol particles and the gaseous neutrals are separated by GC prior to ionization by EI. Though this instrument has been shown to allow the identification of analytes from complex aerosol samples, separation of compounds by TD-GC over the course of minutes to hours limits the utility of the instrument for rapid aerosol analysis.
Prior to EI or laser ablation/ionization, aerosol particles can be size selected in a high vacuum, field free time of flight drift region.47 However, introduction of aerosol particles into a high vacuum
chamber as is done in these two commercially available instruments causes evaporation of semi-volatile compounds from the aerosol particles. The increase in partitioning of compounds from the particle into the gas phase at low pressures leads to significant deviations of the physical and chemical characteristics of aerosols from their native state. It has previously been observed that when exposed to the high
vacuum region of a transmission electron microscope, liquid ammonium sulfate aerosol particles become crystalline due to the evaporation of water and associated organic compounds, reducing the diameter of the particles by 40-50%.11 Thus, particle sizing and ionization of compounds from the aerosol particles
prior to introduction of the particles into the high vacuum region of the mass spectrometer is important to prevent inaccuracies in particle sizing and preferential sampling of involatile analytes.48,49
The third commercial ion source design utilizes an atmospheric pressure chemical ionization (APCI) source to generate ions from compounds in aerosol particles.50 The drift tube based particle sizing
system that is integrated into the EI and laser ablation/ionization mass spectrometers cannot be used with this instrument because ionization of compounds from aerosol particles occurs at atmospheric pressure. A variety of APCI reagents have been investigated for ionization of molecules from aerosol particles.51,52
NO+ and (H2O)2H+ have been shown to result in little analyte fragmentation and to be the most universal
of the APCI reagents investigated, NO+ capable of ionizing even hexadecane.51 Protonated water clusters
ions including [M-H]- and [M+NO]+.51 Protonated methanol clusters (MeOH)
2H+ were also investigated as
APCI reagents and found to primarily form ions of the type [M+MeOH+H]+.51 To dissociate weakly bound
clusters, the commercial APCI mass spectrometer is equipped with a collision cell between the ion source and the mass analyzer.50 The reflectron time of flight (TOF) mass analyzer in this instrument53 can
provide molecular formulas for ions54 but the TOF mass analyzer is not amenable to obtaining more
detailed structural information from analytes of interest. 1.3.2 Importance of the mass analyzer for structural analysis
One benefit of using an ion source that induces little fragmentation during ionization is that structural information from the analytes of interest can be retained and ions can be dissociated in the mass analyzer by MS/MS to investigate the structure of ions. The commercial mass spectrometers discussed in the previous section come equipped with a choice of mass analyzers. The EI and laser ablation source designs have the option of a single quadrupole mass filter, a compact TOF, or a high resolution TOF mass analyzer55 while the APCI source is coupled to a compact or high mass resolution
TOF mass analyzer53. However, in the commercially available configuration these beam-type mass
analyzers cannot be used to perform MS/MS experiments.
Though beam-type mass analyzers can be used for dissociation of analyte ions by MS/MS, these experiments require multiple mass analyzers in a tandem-in-space configuration.56 In a tandem-in-space
mass spectrometer, ions of the mass-to-charge ratio of interest are selected in one mass analyzer, transferred for MS/MS, and then the product ions from MS/MS are transferred to and mass analyzed in the final mass analyzer. Alternatively, trapping mass analyzers such as a quadrupole ion trap (QIT) can be used to perform MS/MS in a tandem-in-time configuration. Analyte ions are trapped, isolated, dissociated, and the product ions subsequently trapped for mass analysis without the need for ion
transfer. Trapping mass analyzers such as the QIT are especially useful for MS/MS experiments because of their inherently high MS/MS efficiency relative to tandem-in-space mass spectrometers.57 Multiple
stages of MS/MS (MSn) can be performed in a single mass analyzer when using a tandem-in-time
1.3.3 Motivation for the work presented in this dissertation
The goal of the research presented in this dissertation is to develop an aerosol mass
spectrometer capable of structural analysis of compounds from size-selected aerosol particles. Each section of the aerosol mass spectrometer design presented herein is either commercially available or simple and inexpensive to custom build. This segmented design results in a highly flexible aerosol mass spectrometry system that can be tailored to the desired application. Atmospheric pressure particle separations and ionization are used to reduce sampling bias caused by introduction of aerosol particles into a high vacuum system. Ion mobility spectrometry is employed post-ionization to separate isomeric analytes. The front end of the aerosol mass spectrometer described herein can be retrofitted to couple with any mass analyzer. Ion trap mass analyzers were used for the experiments presented in this dissertation, resulting in a variety of capabilities including high resolution/high mass accuracy determination of molecular formulas, selective ion-molecule reactions, and MS/MS.
1.4 Summary
Chemical analysis of compounds from aerosol particles is important for a variety of applications and this introduction discusses current techniques for aerosol analysis by mass spectrometry.
Commercial aerosol mass spectrometer designs were introduced and the advantages and limitations of currently available instrumentation were discussed. This introduction describes the impetus for the development of the instrumentation that is presented in this dissertation.
Chapter 2 provides information on the methodology used for the experiments discussed in this dissertation, including chemicals and reagents. Aerosol generation, sampling, and handling techniques are described in this chapter. Techniques for compound ionization, separation, and data analysis are also discussed.
Chapter 3 introduces three surface ionization techniques that combine the extraction of compounds from aerosol particles collected on filters with ionization. It is demonstrated that for the compounds produced from pyrolysis of natural products, sample evaporation occurs during filter and extract storage. The data presented in this chapter highlight the motivation for the development of the aerosol mass spectrometer in this dissertation.
ionization (EESI) and low temperature plasma ionization (LTPI), used for ionization of small molecules directly from aerosol particles without collection of the aerosol particles on filters. The influence of the electrospray solvent in EESI and the plasma gas in LTPI is discussed. A novel “flow-through” LTPI configuration is presented and shown to increase the sensitivity and reproducibility of LTPI for ionization of compounds in gases and aerosols.
Chapter 5 introduces size selection of aerosol particles by a differential mobility analyzer. The dependence of the aerosol particle size distribution on pyrolysis temperature is investigated. Compounds from size selected aerosol particles are ionized using LTPI and differences in the composition of aerosol particles produced by pyrolysis are shown to occur depending on particle diameter.
Chapter 6 shows data for the separation of ions produced by LTPI of compounds in aerosol particles by differential ion mobility spectrometry (DIMS). Enrichment of low abundance ions during a compensation field scan is discussed and the efficiency of the separation is evaluated.
LTPI-DIMS-MS/MS is used to generate MS/MS spectra for isomeric/isobaric ions generated from the pyrolysis of cellulose.
REFERENCES
1. Kinne, S.; Liou, K. The effects of the nonsphericity and size distribution of ice crystals on the radiative propertues of cirrus clouds. Atmos. Res. 1989, 24, 273-284.
2. Jung, C. H.; Lee, J. Y.; Kim, Y. P. Estimation of aerosol optical properties considering hygroscopicity and light absorption. Atmos. Environ. 2015, 105, 191-201.
3. Lach, K.; Steer, B.; Gorbunov, B.; Micka, V.; Muir, R. B. Evaluation of exposure to airborne heavy metals at gun shooting ranges. Ann. Occup. Hyg. 2015, 59, 307-323.
4. SCOTT, K. G.; AXELROD, D. Deposition and fate of plutonium, uranium and their fission products inhaled as aerosols by rats and man. Arch. Pathol. (Chic) 1949, 48, 31-54.
5. Arunthari, V. A Prospective, Comparative Trial of Standard and Breath-Actuated Nebulizer: Efficacy, Safety, and Satisfaction. Respir. Care 2012, 57, 1242-1247.
6. Smith, J. H. Nebulized live-attenuated influenza vaccine provides protection in ferrets at a reduced dose. Vaccine 2012, 30, 3026-3033.
7. Surratt, J. D.; Murphy, S. M.; Kroll, J. H.; Ng, N. L.; Hildebrandt, L.; Sorooshian, A.; Szmigielski, R.; Vermeylen, R.; Maenhaut, W.; Claeys, M.; Flagan, R. C.; Seinfeld, J. H. Chemical Composition of Secondary Organic Aerosol Formed from the Photooxiation of Isoprene. J. Phys. Chem. A. 2006, 110, 9665-9690.
8. Krechmer, J. E.; Coggon, M. M.; Massoli, P.; Nguyen, T. B.; Crounse, J. D.; Hu, W.; Day, D. A.; Tyndall, G. S.; Henze, D. K.; Rivera-Rios, J. C.; Nowak, J. B.; Kimmel, J. R.; Mauldinlll, R. L.; Stark, H.; Jayne, J. T.; Sipilä, M.; Junninen, H.; St. Clair, J. M.; Zhang, X.; Feiner, P. A.; Zhang, L.; Miller, D. O.; Brune, W. H.; Keutsch, F. N.; Wennberg, P. O.; Seinfeld, J. H.; Worsnop, D. R.; Jiminez, J. L.; Canagaratna, M. R. Formation of Low Volatility Organic Compounds and Secondary Organic
Aerosol from Isoprene Hydroxyhydroperoxide Low-NO Oxidation. Environ. Sci. Technol. 2015, 49, 10330-10339.
9. Petit, J. -.; Favez, O.; Sciare, J.; Crenn, V.; Sarda-Estève, R.; Bonnaire, N.; Močnik, G.; Dupont, J. -.; Haeffelin, M.; Leoz-Garziandia, E. Two years of near real-time chemical composition of submicron aerosols in the region of Paris using an Aerosol Chemical Speciation Monitor (ACSM) and a multi-wavelength Aethalometer. Atmos. Chem. Phys. 2015, 15, 2985-3005.
10. Pazienza, M.; Britti, M. S.; Carestia, M.; Cenciarelli, O.; D'Amico, F.; Malizia, A.; Bellecci, C.; Fiorito, R.; Gucciardino, A.; Bellino, M.; Lancia, C.; Tamburrini, A.; Gaudio, P. Use of Particle Counter System for the Optimization of Sampling, Identification, and Decontamination Procedures for Biological Aerosols Dispersion in Confined Environment. J. Microb. Biochem. Technol 2014, 6, 43-48.
11. Posfai, M.; Xu, H.; Anderson, J.; Buseck, P. Wet and dry sizes of atmospheric aerosol particles: An AFM-TEM study. Geophys. Res. Lett. 1998, 25, 1907-1910.
12. Coon, J. J.; Syka, J. E.; Schwartz, J. C.; Shabanowitz, J.; Hunt, D. F. Anion dependence in the partitioning between proton and electron transfer in ion/ion reactions. Int. J. Mass Spectrom. 2004, 236, 33-42.
14. Pöschl, U. Aerosol particle analysis: challenges and progress. Anal. Bioanal. Chem. 2003, 375, 30-32.
15. Nozière, B.; Kalberer, M.; Claeys, M.; Allan, J.; D'Anna, B.; Decesari, S.; Finessi, E.; Glasius, M.; Grgić, I.; Hamilton, J. F.; Hoffmann, T.; Iinuma, Y.; Jaoui, M.; Kahnt, A.; Kampf, C. J.; Kourtchev, I.; Maenhaut, W.; Marsden, N.; Saarikoski, S.; Schnelle-Kreis, J.; Surratt, J. D.; Szidat, S.; Szmigielski, R.; Wisthaler, A. The Molecular Identification of Organic Compounds in the Atmosphere: State of the Art and Challenges. Chem. Rev. 2015, 115, 3919-3983.
16. Wang, C. H.; Chen, B. T.; Han, B. C.; Liu, A. C.; Hung, P. C.; Chen, C. Y.; Chao, H. J. Field
evaluation of personal sampling methods for multiple bioaerosols. PLoS One 2015, 10, e0120308. 17. Turpin, B. J.; Saxena, P.; Andrews, E. Measuring and Simulating Particulate Organics in the
Atmosphere: Problems and Prospects. Atmos. Environ. 2000, 34, 2983-3013.
18. Pardon, G.; Ladhani, L.; Sandström, N.; Ettori, M.; Lobov, G.; van der Wijngaart, W. Aerosol sampling using an electrostatic precipitator integrated with a microfluidic interface. Sensors Actuators B: Chem. 2015, 212, 344-352.
19. Mitchell, R. I. Improved Cascade Impactor for Measuring Aerosol Particle Sizes. J. Ind. Eng. Chem. 1959, 51, 1039-1042.
20. May, K. R. The Cascade Impactor: An Instrument for Sampling Coarse Aerosols. J. Sci. Instrum. 1945, 22, 187-195.
21. Stein, S. W.; Turpin, B. J.; Cai, X.; Huang, P. -.; McMurry, P. H. Measurements of the Relative Humidity-Dependent Bounce and Density for Atmospheric Particles Using the DMA-Impactor Technique. Atmos. Environ. 1994, 28, 1739-1749.
22. Vasiliou, J. G.; Sorensen, D.; McMurry, P. H. Sampling at controlled relative humidity with a cascade impactor. Atmos. Environ. 1999, 33, 1049-1056.
23. Parshintsev, J. Comparison of quartz and Teflon filters for simultaneous collection of size-separated ultrafine aerosol particles and gas-phase zero samples. Anal. Bioanal. Chem. 2011, 400, 3527-3535. 24. Pall Life Sciences, Pall Coorporation. Pallflex Filters: Emfab, Fiberfilm and Tissuquartz Filters.
https://www.pall.com/pdfs/Laboratory/02.0601_Pallflex_LR.pdf 2002, 2014, 2.
25. Pietrogrande, M. C.; Bacco, D.; Chiereghin, S. GC/MS analysis of water-soluble organics in atmospheric aerosol: optimization of a solvent extraction procedure for simultaneous analysis of carboxylic acids and sugars. Anal. Bioanal. Chem. 2013, 405, 1095-1104.
26. Buiarelli, F.; Canepari, S.; Di Filippo, P.; Perrino, C.; Pomata, D.; Riccardi, C.; Speziale, R. Extraction and analysis of fungal spore biomarkers in atmospheric bioaerosol by HPLC-MS-MS and GC-MS. Talanta 2013, 105, 142-151.
27. Kawamura, K.; Tachibana, E.; Okuzawa, K.; Aggarwal, S. G.; Kanaya, Y.; Wang, Z. F. High
abundances of water-soluble dicarboxylic acids, ketocarboxylic acids and alpha-dicarbonyls in the mountaintop aerosols over the North China Plain during wheat burning season. Atmos. Chem. Phys. 2013, 13, 8285-8302.
29. Mühlberger, F.; Zimmermann, R.; Kettrup, A. A Mobile Mass Spectrometer for Comprehensive On-Line Analysis of Trace and Bulk Components of Complex Gas Mixtures: Parallel Application of the Laser-Based Ionization Methods VUV Single-Photon Ionization, Resonant Multiphoton Ionization, and Laser-Induced Electron Impact Ionization. Anal. Chem. 2001, 73, 3590-3604.
30. Collette, C.; Drahos, L.; De Pauw, E.; Vekey, K. Comparison of the Internal Energy Distributions of Ions Produced by Different Electrospray Sources. Rapid Comm. Mass Spectrom. 1998, 12, 1673-1678.
31. McFadden, W. H.; Lammert, S. A. Techniques for increased use of thermospray liquid chromatography—mass spectrometry. J. Chromatogr. A. 1987, 385, 201-211.
32. Hua, L.; Hou, K.; Chen, P.; Xie, Y.; Jiang, J.; Wang, Y.; Wang, W.; Li, H. Realization of In-Source Collision-Induced Dissociation in Single-Photon Ionization Time-of-Flight Mass Spectrometry and Its Application for Differentiation of Isobaric Compounds. Anal. Chem. 2015, 87, 2427-2433.
33. Lewis, J. K.; Wei, J.; Siuzdak, G. Matrix-assisted Laser Desorption/Ionization Mass Spectrometry in Peptide and Protein Analysis. In Encyclopedia of Analytical Chemistry; Meyers, R. A., Ed.; John Wiley & Sons Ltd.: Chichester, 2000; pp 5880.
34. Awad, H.; Khamis, M. M.; El-Aneed, A. Mass Spectrometry, Review of the Basics: Ionization. Appl. Spectrosc. Rev. 2015, 50, 158-175.
35. Shaltout, A. A.; Boman, J.; Shehadeh, Z. F.; Al-Malawi, D. R.; Hemeda, O. M. Spectroscopic investigation of PM2.5 collected at industrial, residential and traffic sites in Taif, Saudi Arabia. J. Aerosol Sci. 2015, 79, 97-108.
36. Mkoma, S. L.; da Rocha, G. O.; de Andrade, J. B. Determination of Carboxylic Acids and Water-soluble Inorganic Ions by Ion Chromatography in Atmospheric Aerosols from Tanzania. South Afr. J. Chem. -Suid-Afr. Tydskr. Chem. 2014, 67, 118-123.
37. VENKATARAMAN, C.; FRIEDLANDER, S. Size Distributions of Polycyclic Aromatic-Hydrocarbons and Elemental Carbon .2. Ambient Measurements and Effects of Atmospheric Processes. Environ. Sci. Technol. 1994, 28, 563-572.
38. Jang, M.; Lee, S.; Kamens, R. M. Organic aerosol growth by acid-catalyzed heterogeneous reactions of octanal in a flow reactor. Atmospheric Environment 2003, 37, 2125-2138.
39. Aldabe, J.; Santamaria, C.; Elustondo, D.; Parra, A.; Foan, L. Polycyclic Aromatic Hydrocarbons (PAHs) Sampled in Aerosol Phase at Different Sites of the Western Pyrenees in Navarra (Spain). Environ. Eng. Manag. J. 2012, 11, 1049-1058.
40. Bateman, A. P.; Walser, M. L.; Desyaterik, Y.; Laskin, J.; Laskin, A.; Nizkorodov, S. A. The Effect of Solvent on the Analysis of Secondary Organic Aerosol Using Electrospray Ionization Mass
Spectrometry. Environ. Sci. Technol. 2008, 42, 7341-7346.
41. Jayne, J. T.; Leard, D. C.; Zhang, X.; Davidovits, P.; Smith, K. A.; Kolb, C. E.; Worsnop, D. R. Development of an aerosol mass spectrometer for size and composition analysis of submicron particles. Aerosol Sci. Technol. 2000, 33, 49-70.
43. Aiken, A. C.; Decarlo, P. F.; Kroll, J. H.; Worsnop, D. R.; Huffman, J. A. O/C and OM/OC Ratios of Primary, Secondary, and Ambient Organic Aerosols with High-Resolution Time-of-Flight Aerosol Mass Spectrometry. Environ. Sci. Technol. 2008, 42, 4478-4485.
44. Nash, D. G.; Liu, X. F.; Mysak, E. R.; Baer, T. Aerosol particle mass spectrometry with low photon energy laser ionization. Int. J. Mass Spectrom. 2005, 241, 89-97.
45. Williams, B. J.; Jayne, J. T.; Lambe, A. T.; Hohaus, T.; Kimmel, J. R.; Sueper, D.; Brooks, W.; Williams, L. R.; Trimborn, A. M.; Martinez, R. E.; Hayes, P. L.; Jimenez, J. L.; Kreisberg, N. M.; Hering, S. V.; Worton, D. R.; Goldstein, A. H.; Worsnop, D. R. The First Combined Thermal Desorption Aerosol Gas Chromatograph—Aerosol Mass Spectrometer (TAG-AMS). Aerosol Sci. Technol. 2014, 48, 358-370.
46. Aerodyne Research, I. Thermal Desorption Aerosol Gas Chromatograph AMS (TAG-AMS). http://www.aerodyne.com/products/thermal-desorption-aerosol-gas-chromatograph-ams-tag-ams 2015.
47. Canagaratna, M. R.; Jayne, J. T.; Jimenez, J. L.; Allan, J. D.; Alfarra, M. R.; Zhang, Q.; Onasch, T. B.; Drewnick, F.; Coe, H.; Middlebrook, A.; Delia, A.; Williams, L. R.; Trimborn, A. M.; Northway, M. J.; DeCarlo, P. F.; Kolb, C. E.; Davidovits, P.; Worsnop, D. R. Chemical and microphysical
characterization of ambient aerosols with the aerodyne aerosol mass spectrometer. Mass Spectrom. Rev. 2007, 26, 185-222.
48. Gill, P. S.; Graedel, T. E.; Weschler, C. J. Organic Films on Atmospheric Aerosol-Particles, Fog Droplets, Cloud Droplets, Raindrops, and Snowflakes. Rev. Geophys. 1983, 21, 903-920.
49. Mazurek, M.; Masonjones, M.; Masonjones, H.; Salmon, L.; Cass, G.; Hallock, K.; Leach, M. Visibility-reducing organic aerosols in the vicinity of grand canyon national park: Properties observed by high resolution gas chromatography. J. Geophys. Res. -Atmos. 1997, 102, 3779-3793.
50. Bertram, T. H.; Kimmel, J. R.; Crisp, T. A.; Ryder, O. S.; Yatavelli, R. L. N. A field-deployable, chemical ionization time-of-flight mass spectrometer. Atmos. Meas. Tech. 2011, 4, 1471-1479. 51. Hearn, J. D.; Smith, G. D. A Chemical Ionization Mass Spectrometry Method for the Online Analysis
of Organic Aerosols. Anal. Chem. 2004, 76, 2820-2826.
52. Kuckelmann, U.; Warscheid, B.; Hoffmann, T. On-line Characterization of Organic Aerosols Formed from Biogenic Precursors Using Atmospheric Pressure Chemical Ionization Mass Spectrometry. Anal. Chem. 2000, 72, 1905-1912.
53. Aerodyne Research, I. ToF-CIMS: Chemical ionization Time-of-Flight Mass Spectrometer. http://www.aerodyne.com/sites/default/files/ToF-CIMS%20Chemical%20Ionization%20Time-of-Fligh%20Mass%20Spectrometer%20product%20sheet.pdf 2015.
54. Chhabra, P. S.; Lambe, A. T.; Canagaratna, M. R.; Stark, H.; Jayne, J. T.; Onasch, T. B.; Davidovits, P.; Kimmel, J. R.; Worsnop, D. R. Application of high-resolution time-of-flight chemical ionization mass spectrometry measurements to estimate volatility distributions of α-pinene and naphthalene oxidation products. Atmos. Meas. Tech. 2015, 8, 1-18.
56. Glish, G. L.; Vachet, R. W. The basics of mass spectrometry in the twenty-first century. Nat. Rev. Drug Discov. 2003, 2, 140-150.
57. Glish, G. L. Multiple Stage Mass Spectrometry: The Next Generation Tandem Mass Spectrometry Experiment. Analyst 1994, 119, 533-537.
58. McLuckey, S. A.; Goeringer, D. E. Slow heating methods in tandem mass spectrometry. Journal of Mass Spectrometry 1997, 32, 461-474.
CHAPTER 2: EXPERIMENTAL 2.1 Materials and reagents
Ethyl cellulose was purchased from Alfa Aesar (90-110 cps 5% in toluene, Ward Hill, MA) and cellulose was purchased from TCI America (Portland, OR). Tobacco extracts of cellulose, hemicellulose, and lignin were provided by R. J. Reynolds Tobacco Co. (Winston-Salem, NC). Syringaldehyde (98%), 2,6-dimethoxyphenol (99%), levoglucosan (99%), 3-hydroxy-2-methyl-4-pyrone (99%), and caffeine (99.8%) were purchased from Sigma-Aldrich (St. Louis, MO). E-liquids were purchased from The Vapor Girl, Inc. (Chapel Hill, NC) for analysis. Solvents were purchased from Fisher Scientific (Waltham, MA). HPLC grade methanol, water, and chloroform, were used. The toluene and acetic acid were certified ACS grade. Acetonitrile was optima grade.
A mixture of cellulose and lignin was prepared in a ratio of 60/40 cellulose/lignin by mass. This ratio was selected to mimic the ratio of lignin and cellulose found in biomass, omitting the contribution of hemicellulose.1 Cellulose and lignin were combined and ground together with a spatula. Chloroform
(6.00 mL) was added to the cellulose/lignin mixture dropwise and the solution was stirred until the analyte was fully dissolved. The chloroform was removed from the cellulose/lignin mixture by evaporation for 48 hours. A stream of nitrogen was passed over the solution to assist in solvent evaporation. Shown in Figure 2.1 is a photograph of the cellulose (left), lignin (middle), and the 60/40 cellulose/lignin mixture (right).
2.2 Aerosol generation and off-line characterization 2.2.1 Aerosol particle generation
Two pyrolysis units were used to volatilize or pyrolyze the samples of interest. The first is a custom built pyrolysis chamber (50 mm x 50 mm x 64 mm) composed of 7.0 mm thick graphite sheets
rods (not shown). Nitrogen is flowed through the chamber at approximately 3 L/min for 5 minutes prior to analysis, corresponding to 250 chamber volumes. An 80/20 nickel/chromium wire (Omega, Stamford, CT) is wrapped around a quartz crucible containing between 50 and 60 mg of the sample of interest.
Heating of the sample is effected by applying a constant current i to resistively heat the nichrome wire (1.020 Ω/ft). The temperature is monitored using a thermocouple suspended in the sample. The final pyrolysis temperature was reached in roughly 2 minutes for all analyses. Electrical feedthroughs for the heating filament and thermocouple are insulated with 4.7 mm ceramic tubes that were press-fitted through ports in the graphite chamber. The aerosol exits the top of the pyrolysis chamber through a cajon fitting connected to a ½ inch steel tube. The custom chamber was used for experiments requiring a larger quantity of aerosol due to its increased sample capacity.
As an alternative to the custom pyrolysis chamber, a PyroProbe 5250 (CDS Analytical, Oxford PA) was used to pyrolyze between 20 and 30 mg of the sample of interest at 650 °C in nitrogen pyrolysis gas with a heating rate of 10 °C/s unless otherwise noted. Nitrogen is flowed through the chamber at approximately 3 L/min. The 8-port valve of the PyroProbe was maintained at 300 °C and the aerosol transfer line to the mass spectrometer is heated to between 70 and 90 °C to prevent the condensation of the aerosols in the transfer line.
2.2.2 Determination of aerosol particle size distribution
Aerosol particles were separated based on particle diameter using a differential mobility analyzer (Model 3080, TSI Incorporated, Shoreview, MN). A detailed description of the theory of separation of particles by differential mobility is given in Chapter 5. A condensation particle counter (Model 3022A, TSI Incorporated, Shoreview, MN) was used to determine the number density of particles with each selected
Figure 2.2.Experimental pyrolysis set-up. Sample is placed in the crucible and is heated by thermal transfer from a resistively heated wire.
diameter. Saturated t-butyl alcohol vapor was condensed onto the particles to increase the particle diameter for measurement of the number of aerosol particles in the condensation chamber by light scattering.
2.2.3 Filter collection and extraction
Aerosol particles generated by the pyrolysis of natural polymers in the custom pyrolysis chamber were collected onto tetrafluoroethylene (TFE) coated borosilicate glass filters (Pallflex Fiberfilm T60A20, Ann Arbor, MI). These filters are known to retain 96.4% of aerosol particles,2 and minimal adsorption of
gaseous compounds onto TFE coated filters has previously been reported.3 The experimental design of
the custom filter collection system is displayed in Figure 2.3. Conductive tubing was used for aerosol transport to eliminate electrostatic particle losses due to charge buildup.4 A GE Motors 5KH36KN90GX ac
motor (Raleigh, NC) was used as a vacuum pump to generate a pressure differential of 22 inches of Hg across the filter. This pressure differential was designed to assist in gas flow through the filter and thus collection of particles on the filter. Blanks were
collected prior to pyrolysis of the sample. Blanks and samples were collected on filters for
5 minutes at the final pyrolysis temperature. To extract compounds from aerosol particles from TFE coated borosilicate glass fiber filters, the portion of the filter to be extracted was submerged in 2.0 mL of extraction solvent (methanol unless otherwise noted) in a scintillation vial. The filter was sonicated in the extraction solvent for 60 minutes in an ice water bath to minimize the evaporation of semi-volatile analytes during extraction. After extraction of compounds from the filter, the filter was removed from the scintillation vial and the extract was diluted by a factor of 10 for electrospray
ionization (ESI). The ESI solvent composition was 50/49/1 methanol/water/acetic acid unless otherwise noted.
2.3 Ionization
2.3.1 Secondary electrospray ionization
Secondary electrospray ionization (SESI) was performed to ionize compounds evaporated from the surface of the TFE coated borosilicate glass fiber filter. The filter was held at ground potential and suspended parallel to the inlet of the mass spectrometer as depicted in Figure 2.4. An Agilent ESI emitter (Agilent Technologies, Santa Clara, CA) was placed between the filter and the inlet
to the mass spectrometer. The SESI solvent was pumped through the emitter at a flow rate of 2 L/min. A nebulizing gas pressure was maintained at 10 psi above atmospheric pressure. A +4.25 kV dc voltage was applied to the ESI emitter and the capillary inlet to the mass spectrometer was held at ground potential to generate an electrospray plume. Ionization of gaseous neutrals by SESI is believed to occur by interaction of the analyte with the charged surface of the electrospray droplets and/or by chemical ionization of analytes via ion-molecule reactions between the neutral analyte molecules and the protonated solvent molecules.5
2.3.2 Desorption electrospray ionization
Desorption electrospray ionization (DESI) is performed by directing an electrospray plume onto a surface to generate ions from analyte collected on the surface. The experimental set-up for DESI used in the experiments detailed in this dissertation is displayed in Figure 2.5. The TFE coated borosilicate glass fiber filter is held at ground potential and
positioned perpendicular to and 0.5 mm below the capillary inlet to the mass spectrometer. The capillary was held
at -0.5 kV to assist in drawing positive ions to the inlet of the mass spectrometer. The Agilent ESI emitter was positioned
5 mm away from the capillary inlet to the mass spectrometer at approximately 55° from the surface of the filter. To generate an electrospray, +3.0 kV dc was applied to the ESI emitter and a DESI solvent
(50/49/1 methanol/water/acetic acid unless otherwise noted) was pumped through the emitter at a flow rate of 2 L/min. For DESI of small molecules such as the pyrolysis products of natural polymers, ions are formed by sputtering of analytes from the filter, interaction of analytes with the charged surface of the droplets, or chemical ionization of compounds via ion-molecule reactions between gaseous analytes and protonated solvent molecules.6
2.3.3 Paper spray ionization
The experimental configuration for paper spray ionization used for the experiments described in this dissertation is shown in Figure 2.6. The TFE coated borosilicate glass fiber filter was cut into a wedge with a pointed tip and wetted with 50 L of paperspray solvent,
50/49/1 methanol/water/acetic acid. Solvent was flowed over the surface of the paper at a rate of 25 L/min to extract compounds from the surface. The filter was held at +4.0 kV and -1.0 kV was applied to the inlet capillary of the mass spectrometer to generate an electrospray plume from the sharp tip of the filter. Ions are generated from analytes extracted from the surface of the filter.7
2.3.4 Extractive electrospray ionization
The experimental set-up for extractive electrospray ionization (EESI) is displayed schematically in Figure 2.7. The EESI solvent was 50/49/1 methanol/water/acetic acid flowed at 2 L/min unless
otherwise noted. The Agilent ESI emitter is held at ground potential and positioned approximately 3 mm away from the inlet to the mass spectrometer. The aerosol transfer line is held at ground
potential. -4.25 kV dc is applied to the ESI emitter to generate the electrospray. The electrospray plume is directed through the aerosol particles to generate ions.8
Figure 2.6. A. Schematic for and B. photo of the paper spray ionization experiment.