A quantitative approach to characterizing malignant renal cell
carcinoma using contrast enhanced ultrasound
Sandeep K. Kasoji, B.S.1, Emily H. Chang, M.D.2, Lee B. Mullin, Ph.D.1, Wui K. Chong, M.D. 3, W. Kimryn Rathmell, M.D., Ph.D.3,4, and Paul A. Dayton, Ph.D.1,3,6
1Joint Dept. of Biomedical Engineering, UNC Chapel Hill/North Carolina State University, 333 S.
Columbia St, Chapel Hill, NC 27517 USA/911 Oval Dr, Raleigh, NC 27606 USA
2UNC Kidney Center, 7024 Burnett-Womack CB # 7155, Chapel Hill, NC 27599 USA
3UNC Hospitals Dept. of Radiology, 101 Manning Dr #2, Chapel Hill, NC 27514 USA
4Vanderbilt University Hospitals Dept. of Medicine/Hematology & Oncology, 2200 Pierce Ave,
Nashville, TN 37232 USA
5UNC Lineberger Comprehensive Cancer Center, 450 West Drive, Chapel Hill, NC 27599 USA 6Biomedical Research Imaging Center, 125 Mason Farm Road, Chapel Hill, NC 27599 USA
Abstract
Malignant renal cell carcinoma (RCC) is a diverse set of diseases, which are independently difficult to characterize using conventional MRI and CT protocols due to low temporal resolution to study perfusion characteristics. Because different disease subtypes have different prognoses and involve varying treatment regimens, the ability to determine RCC subtype non-invasively is a clinical need. Contrast-enhanced ultrasound (CEUS) has been assessed as a tool to characterize kidney lesions based on qualitative and quantitative assessment of perfusion patterns, and we hypothesize that this technique might help differentiate disease subtypes. Twelve patients with RCC confirmed pathologically were imaged using contrast-enhanced ultrasound. Time intensity curves were generated and analyzed quantitatively using ten characteristic metrics. Results showed that peak intensity (p=0.001) and time-to-80% on wash-out (p=0.004) provided significant differences between clear cell, papillary, and chromophobe RCC subtypes. These results suggest that CEUS may be a feasible test for characterizing RCC subtypes.
Keywords
Contrast enhanced ultrasound; renal cell carcinoma; time-intensity curve; renal perfusion; quantitative
HHS Public Access
Author manuscript
Ultrason Imaging
. Author manuscript; available in PMC 2017 September 14.Published in final edited form as:
Ultrason Imaging. 2017 March ; 39(2): 126–136. doi:10.1177/0161734616666383.
A
uthor Man
uscr
ipt
A
uthor Man
uscr
ipt
A
uthor Man
uscr
ipt
A
uthor Man
uscr
Introduction
Renal cell carcinoma (RCC) affects approximately 1 in every 100 American individuals, with an estimated 62,000 new cases to be diagnosed in 2016 in the United States alone.1 Classification of RCC has evolved over the last three decades, leading to four main subtypes: clear cell, papillary type I, papillary type II, chromophobe. Clear cell RCC is the most common (~75%) type of RCC, followed by papillary (~16%) and chromophobe (~7%). Each of these tumors has been recently characterized genetically by the cancer genome atlas, underscoring the unique biology of each disease type.2–4 RCC classification is a critical diagnostic step since clinical management is based on the varying prognoses and therapeutic pathways of each subtype.5 Clear cell and papillary type II RCCs have a higher probability of metastasizing even after nephrectomy for organ-confined tumors, while the prognosis for papillary type I and chromophobe RCCs are significantly better and are therefore managed more conservatively compared to clear cell RCC.6,7 Radiographic distinction between these malignant RCC subtypes is inherently difficult due to molecular aberrations and structural contributions that lead to shared tumor morphology.8
Traditional gray-scale ultrasound is effective for differentiating solid from cystic kidney lesions, but lacks the sensitivity to further classify solid masses according to histologic type. Contrast-enhanced computed-tomography (CT) and magnetic resonance imaging (MRI) are the standard imaging exams used to assess the malignancy of solid masses and to
characterize perfusion patterns; however, the contrast sensitivity does not adequately resolve histologic characteristics of many types of tumors arising in the kidney, including
hypovascular and cystic lesions, necrosis, debris and hemorrhagic areas in tumors.9 Additionally, the nephrotoxicity of the contrast agents often limits their use.10 Thus, tissue analysis, often post-nephrectomy, has remained the gold standard for identifying RCC subtypes despite the invasive nature of the procedure.
Recent clinical studies have shown that contrast-enhanced ultrasound (CEUS), a non-nephrotoxic and non-ionizing imaging modality, has the ability to assess malignancy of solid and cystic kidney lesions based on qualitative enhancement and perfusion patterns.11 Only a few studies, however, have considered quantitative approaches to further characterize RCC subtypes.7,12–15 In this study, we quantify perfusion patterns in 12 patients diagnosed with kidney masses and correlate specific metrics with pathologic findings.
Materials and Methods
Patient Recruitment and Initial Tests
University of North Carolina’s Institutional Review Board approved this study and written informed consent was obtained from each patient prior to the study. Over a two-year period, twenty-four individuals diagnosed with kidney lesions were recruited for the study and imaged with contrast-enhanced ultrasound (CEUS). All patients were imaged using traditional ultrasound and either CT or MRI prior to CEUS, and tissue biopsy or resection was performed on 22 of the 24 patients post-CEUS. Histologic analyses were performed on all 22 patients and classified by expert clinical pathologists as clear cell RCC (ccRCC, n=15), papillary RCC (pRCC, n=3), chromophobe RCC (chRCC, n=2), angiomyolipoma
A
uthor Man
uscr
ipt
A
uthor Man
uscr
ipt
A
uthor Man
uscr
ipt
A
uthor Man
uscr
(AML, n=1), or oncocytoma (OCT, n=1). AMLs and OCTs were excluded from the study as benign tumors. Eight of the twenty-two patients were excluded from quantitative analysis due to poor video quality caused by excessive out-of-plane motion (displacement greater than half the size of the lesion of interest) and inadequately visible parenchyma (less than a 5 mm2 ROI). Therefore, the remaining 12 were included in the final analysis. Two patients underwent core biopsies, while the remaining 10 underwent partial or complete
nephrectomy.
Contrast-Enhanced Ultrasound
CEUS imaging was performed on a Siemens/Acuson Sequoia 512 (Mountain View, CA, USA) by a trained sonographer. Traditional b-mode ultrasound clips were first recorded for each patient to determine the anatomical location and dimensions of the lesion. The
transducer was optimally positioned so that the lesion and normal parenchyma (renal cortex) were clearly visible and so that breathing motion was maintained within the plane. After the sonographer localized the lesion of interest and was able to maintain a consistent image along with patient breathing, a mechanical stereotactic clamp was fixed to maintain the transducer position. The clamp was introduced to help minimize sonographer hand motion during acquisition of the cine loop and to alleviate physical cramping of the wrist during the long imaging period. The depth and spacing of the imaging foci were adjusted to the center on the lesion based on the lesion size and depth. Cadence Pulse Sequence (CPS) mode was used for contrast imaging at a mechanical index (MI) of 0.19. A 5 mL bolus injection of the diluted microbubble contrast agent, Definity (Lantheus, North Billerica, MA, USA), was administered through the antecubital vein over 15 seconds, followed by a 5 mL flush of 0.9% saline. Contrast dose was based on patient weight (0.5 mL for <125 lb, 0.65 mL for 125–185 lb, 1.0 mL for >185 lb). Image acquisition was initiated immediately prior to the bolus injection and ended after 3 minutes, capturing contrast wash-in and at least 2 minutes of contrast wash-out.
CEUS Time-Intensity-Curve Analysis
DICOM files containing the b-mode and contrast clips were copied from the Sequoia 512 and converted to audio-video interleave files for subsequent analysis using ImageJ (National Institutes of Health, Bethesda, MD, USA) and MATLAB (MathWorks, Natick, MA, USA). Clips that contained severe out-of-plane breathing and body motion were omitted from quantitative analysis. In the instances where breathing motion was regular and cyclic, a targeted ROI for the lesion and parenchyma was selected whenever it appeared in plane. Rigid image registration was performed using the StackReg plugin for ImageJ to correct in-plane breathing motion. Ellipsoidal regions-of-interest (ROI) with a minimum diameter of 5 mm were selected for the lesion and the renal cortex separately at approximately the same depth (±1 cm) (Figure 1). Lesion ROIs were selected to encompass the entire lesion
excluding the normal parenchyma. Time-intensity-curves (TIC) were generated for all ROIs. Any cystic and necrotic regions that were present were excluded in the ROI selection. Residual breathing motion was further removed by filtering the TICs in MATLAB using a low pass filter (f−3dB = 0.025 Hz). Ten metrics were applied to each of the TICs, including peak contrast intensity (PI), time-to-peak (TPk), time-to-peak ratio (TPk-r), time-to-80% on wash-out (T80%), time-to-80% on wash-out ratio (T80%-r), wash-in slope (WIS), wash-out
A
uthor Man
uscr
ipt
A
uthor Man
uscr
ipt
A
uthor Man
uscr
ipt
A
uthor Man
uscr
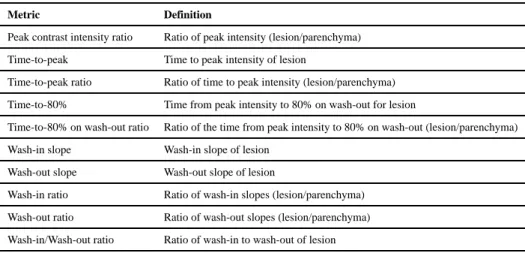
slope (WOS), wash-in ratio (WIS-r), wash-out ratio (WOS-r), and wash-in/wash-out ratio (WIWOS-r). The metrics are described below and graphically summarized in Figure 2 and Table 1. Time-to-80% was estimated based on the inflection point of the decay phase of the gamma variate function (y = A · t · (1 − e−βt) + C), which is approximately at 75% of the peak intensity. Peak contrast intensity was measured with non-normalized data, which is not shown in Figure 2.
Histological Analysis
Histologic tissue diagnoses for resected (N=10) or biopsied (N=2) tissues were obtained through routine clinical reports at the University of North Carolina at Chapel Hill,
Department of Surgical Pathology. Diagnosed lesion subtypes included chromophobe RCC, clear cell RCC, and papillary RCC.
Statistical Analysis
Statistical analyses were performed using MATLAB (MathWorks, Natick, MA, USA) and R-Studio (R Foundation for Statistical Computing, Vienna, Austria)16. For each metric, results were grouped by cancer type. One-way ANOVA was performed for each metric and the Tukey-Kramer multiple-comparison test was used to determine significant differences between each group.
Results
Twelve final CEUS clips qualified for TIC analysis based on image quality—clips with excessive out-of-plane motion or clips with inadequately visible parenchyma were excluded. The pathological findings for the twelve patients showed presence of 2 papillary RCC, 8 clear cell RCC, and 2 chromophobe RCC. Lesion sizes ranged from 1.72 cm to 7.50 cm in the longest dimension (3.75 cm ± 1.57 cm).
One-way ANOVA statistical test results for each metric are summarized in Table 2.
Significant differences with a 95% confidence interval between groups were observed using the peak intensity ratio (Figure 3) with p=0.001 (p=0.001 between clear cell and papillary RCCs, and p=0.04 between chromophobe and papillary RCCs) and time-to-80% ratio metric (Figure 4) with p=0.004 (p=0.020 between chromophobe and clear cell RCCs, and p=0.003 between chromophobe and papillary RCCs). The PI metric measured the lowest lesion-to-parenchyma ratio for papillary RCC (0.57 ± 0.24), followed by chromophobe RCC (0.92 ± 0.03), and clear cell RCC (1.1 ± 0.1). The time-to-80% ratio metric also measured the lowest lesion-to-parenchyma ratio for papillary RCC (0.35 ± 0.33), followed by clear cell RCC (0.68 ± 0.16), and chromophobe (1.14 ± 0.05). All other metrics did not measure significant differences (p≫0.05) (Table 2).
Discussion
Previous studies have demonstrated the utility of qualitative and quantitative CEUS perfusion analysis (including TIC analysis) for distinguishing solid from cystic kidney masses and malignant from benign solid masses.12,13 Solid masses, including most RCCs, and oncocytomas, typically appear hypoechoic on traditional b-mode ultrasound. Other solid
A
uthor Man
uscr
ipt
A
uthor Man
uscr
ipt
A
uthor Man
uscr
ipt
A
uthor Man
uscr
lesions, such as angiomyolipomas typically appear hyperechoic due to their fatty content, but may sometimes also appear hypoechoic. CEUS has been shown to be a viable option in these cases where malignancy is unclear and contrast MR/CT are contraindicated. The focus of our study is to further discriminate between RCCs given the varying prognoses and treatments for each subtype. Pre-surgical knowledge of the suspected histological type of tumor would benefit patients and health-care providers in making decisions about interventions, therapy, or clinical management approaches that incorporate careful
observation. Several studies have recently emerged that quantify perfusion patterns of RCC subtype.7,10,12,13,17
King et al. reported a similar TIC analysis and concluded that some metrics are better suited for certain types of kidney lesions.13 For example, ccRCC enhances more than the
surrounding parenchyma and has a faster time-to-peak (TPk), while pRCC enhances less than the parenchyma and has a slower TPk. chRCC was shown to have intermediate peak enhancement and TPk between ccRCC and pRCC. Metrics such as homogeneity of enhancement and rate of de-enhancement were shown to be more relevant to angiomyolipomas and oncocytomas.13
Results for wash-in slope, wash-out slope, and TPk analyses have largely been inconsistent across previously published studies. This may be due to technical variations of the imaging and analysis technique and physiologic differences in the tumor. In all cases, lesion perfusion characteristics were compared to the renal cortex. Consistency in imaging depth has a significant impact on relative enhancement measurements between normal and diseased tissue due to attenuation. Also, heterogeneity of RCCs at different stages of development may induce user error by choosing a cross-section that is not entirely representative of the entire mass. It is also important to consider that many studies do not distinguish between histologies and are focused instead on the feature that distinguish benign from malignant disease. Some results report that all malignant RCCs display a fast wash-in, while others describe pRCC with a slower wash-in.10,12,13,17 We observed that many TICs, especially for pRCC, exhibited a bi-phasic wash-out—a steeper initial wash-out of the contrast bolus injection, followed by more gradual clearance of the recirculating contrast. The gamma-variate fit is commonly used to model kidney perfusion, which is estimated by a left-skewed Gaussian curve with an exponentially decaying tail.18 The point of inflection on the downslope occurs approximately at 75% of the peak intensity, which happened to be near the beginning of the second phase of wash-out. Although our TICs did not conform to the gamma-variate fit as well as other studies have shown, we chose 80% to be our threshold to measure the start of the second phase of contrast wash-out. Cai and King used 60% and 50%, respectively, which we observed to be during the second phase of wash-out.12,13 We believe that the bi-phasic wash-out pattern is of clinical importance, and measuring the time interval between phases may be a method of describing this pattern. Other perfusion models (e.g. Karshafian et al.’s lognormal perfusion model) that describe contrast replenishment during destruction-reperfusion imaging, can extrapolate information related to the distribution of flow speeds, vascular size and morphology, and blood volume. Burns et al. exquisitely describe the value of choosing an appropriate perfusion model for enabling versatile and reproducible measurements.19,20
A
uthor Man
uscr
ipt
A
uthor Man
uscr
ipt
A
uthor Man
uscr
ipt
A
uthor Man
uscr
Interestingly, the two cases of pRCC we observed exhibited a statistically significantly fast decrease in contrast intensity compared to the surrounding renal cortex, opposite to what has been reported in other studies.12,13 No significant differences were observed when
measuring slopes for wash-in and the second phase of wash-out. While it is difficult to suggest why pRCC and chRCC display a steep and near constant wash-out, respectively, these may be clinically relevant perfusion patterns specific to pRCC and chRCC and should be further investigated. Peak-intensity results agreed with previous studies reporting that ccRCCs present as hyper-enhancing, while chRCC and pRCC, generally present iso or hypo-enhancing. ccRCC has been reported to be a faster growing, metastatic, and more vascular cancer relative to chRCC and pRCC, which supports the hypo-enhancing presentation of pRCC on CEUS.21–24
Lu et al. recently published results from a large sample size study using a different quantitative approach to differentiate various RCCs. Their TIC analysis consisted of a temporal comparison between the lesion and renal parenchymal enhancement that included four distinct dynamic vascular patterns: unipolar positive (hyper-enhanced lesion through wash-in/wash-out), unipolar negative (hypo-enhanced lesion through wash-in/wash-out), bipolar positive (hyper-enhanced lesion through in and hypo-enhanced through wash-out), and bipolar negative (hypo-enhanced lesion through wash-in and hyper-enhanced through wash-out). They concluded that unipolar and bipolar positive flow patterns were indicative of ccRCC and unipolar negative was indicative of pRCC and chRCC. While rates of wash-out were not included in their analysis, our lesion-to-cortex peak enhancement results agreed with these findings.7
This study has several limitations. Our sample size was limited to only 12 patients. Out-of-plane breathing motion, obstruction of the lesion and parenchyma from rib and bowel shadowing, and lack of diagnostic pathology eliminated approximately half of the available data sets. For some patients, ideal transducer placement (i.e. wedging under the ribs) was sacrificed due to patient comfort, which is a significant limitation of CEUS for focal kidney imaging. We believe that standardized CEUS sonography training that describes how to handle the above limitations will significantly improve imaging quality.
A technical improvement made in this study was the use of a stereotactic clamp to hold the transducer for the 3-minute clip. This not only alleviated sonographer hand and wrist cramping, but maintained steady positioning throughout the clip. This was only feasible if the breathing motion was maintained within the imaging plane. For instances where out-of-plane movement persisted, manual placement by the sonographer was preferred to track the breathing motion. Occasionally, the patient body movement would displace the positioning of the clamp and re-adjusting the position was difficult. While the stereotactic arm by itself may not add significant value to the quality of the ultrasound clips, we believe it can be used as an aid in positioning of the transducer for longer scans to alleviate sonographer
discomfort.
Of the 12 lesions, there were only 2 pRCC and 2 chRCC, which greatly limited our statistical power. Given the small sample size, we were still encouraged by the trends observed with the time-to-80% metric and, especially, the peak enhancement ratio, which
A
uthor Man
uscr
ipt
A
uthor Man
uscr
ipt
A
uthor Man
uscr
ipt
A
uthor Man
uscr
agreed with previous studies. There was only one angiomyolipoma and one oncocytoma, which were not included in the final results.
The TICs in this study were generated from a single cross-section through the kidney that captured both the lesion and normal parenchyma. For some patients, anatomic constraints made it difficult to orient the transducer directly in the center of the kidney parenchyma to visualize wash-in/wash-out in both the cortex and medulla. Kogan et al. reported differences in perfusion measurements between parasagittal and coronal planes due to varying amounts of cortical and medullary tissue in each plane.25 While the ROI for the kidney parenchyma was placed over the cortex for image analysis on all of the images, the exact position of the ROI undoubtedly was inconsistent. The heterogeneity commonly associated with some RCCs is not adequately represented in a single cross-section perfusion analysis.26 Three-dimensional destruction-reperfusion analysis offers holistic representation of kidney function. Feingold et al. reported standard deviations as high as 22% between individual cross-sections of the kidney and concluded that the accuracy and repeatability of overall kidney perfusion measurements significantly increase with 3-D imaging.27 Unfortunately, 3-D destruction-reperfusion imaging requires a single-array transducer to scan stepwise elevationally and can only capture contrast wash-in. The advent of a two-dimensional array transducer capable of high-resolution, real-time 3-D CEUS will allow the calculation of 3-D TICs, which will revolutionize kidney perfusion analysis and provide a more precise and accurate representation of the vascularity of diseased kidneys and solid kidney lesions. Based on our experience, we recommend a second contrast dose to acquire a wash-in/wash-out clip (after waiting the prescribed amount of time between doses) with the transducer centered sagittally over the kidney for more consistent perfusion measurements of the parenchyma.
Other limitations of this study are a result of the inherent variability in perfusion imaging. Cosgrove et al. describe factors of variability in perfusion imaging, including contrast type, circulation profiles of the contrast agent, infusion rate, breathing motion, attenuation, imaging settings, etc.28 Overcoming these sources of variability is critical for the widespread clinical use of perfusion imaging. Despite these factors, CEUS has been shown to
characterize kidney lesions with high sensitivities and negative predictive values (89–100% and 86–100%, respectively).11
Conclusion
This study suggests that quantitative TIC analysis can be a feasible method for identifying subtypes of malignant solid renal masses. We explored different TIC characteristics that may be perfusion signatures for clear cell, papillary, and chromophobe RCC subtypes.
Specifically, peak intensity and time-to-80% on wash-out metrics showed significant differences in perfusion patterns between the major RCC subtypes. The bi-phasic wash-out pattern may be a clinically important feature that should be further investigated. While very few studies have examined the utility of quantitative CEUS for RCC differentiation, there is general agreement with several enhancement metrics. Further validation of these techniques, coupled with the ease and safety of CEUS, indicate that CEUS may be a powerful tool for improving diagnostic efficacy for RCC clinical management.
A
uthor Man
uscr
ipt
A
uthor Man
uscr
ipt
A
uthor Man
uscr
ipt
A
uthor Man
uscr
Acknowledgments
This work was supported by the North Carolina Translational & Clinical Sciences Institute and the UNC Lineberger Comprehensive Cancer Center. The authors would like to acknowledge sonographers Jill Dickerson, Gayle Grigson, Whitney Honeycutt, and Sonya Whitehead, and Ismayil Guracar from Siemens Medical Solutions. The project described was supported by the National Center for Advancing Translational Sciences (NCATS), National Institutes of Health, through Grant Award Number UL1TR001111. The content is solely the responsibility of the authors and does not necessarily represent the official views of the NIH.
References
1. American Cancer Society. Cancer Facts Fig 2014 Atlanta Am Cancer Soc. 2014. Cancer Facts & Figures.
2. TCGA Network. Comprehensive molecular characterization of clear cell renal cell carcinoma. Nature. 2013; 499(7456):43–9. [PubMed: 23792563]
3. Davis C, Rickets C, Wang M. The somatic genomic landscape of chromophobe renal cell carcinoma. Cancer Cell. 2014; 26:319–30. [PubMed: 25155756]
4. TCGA Network. Comprehensive Molecular Characterization of Papillary Renal-Cell Carcinoma. N Engl J Med. 2015
5. Mileto A. Iodine Quantification to Distinguish Clear Cell from Papillary Renal Cell Carcinoma at Dual-Energy Multidetector CT: A Multireader Diagnostic Performance Study. Radiology. 2014; 273(3)
6. Hagenkord JM, Gatalica Z, Jonasch E, Monzon FA. Clinical genomics of renal epithelial tumors. Cancer Genetics. 2011:285–97. [PubMed: 21763625]
7. Lu Q, Huang B. Differentiation of Renal Tumor Histotypes: Usefulness of Quantitative Analysis of Contrast-Enhanced Ultrasound. Am J Roentgenol. 2015; 205(3)
8. Shuch B, Amin A, Armstrong AJ, Eble JN, Ficarra V, Lopez-Beltran A, et al. Understanding Pathologic Variants of Renal Cell Carcinoma: Distilling Therapeutic Opportunities from Biologic Complexity. European Urology. 2014
9. Harvey CJ, Cosgrove D. Role of US Contrast Agents in the Assessment of Indeterminate Solid and Cystic Lesions in Native and Transplant Kidney. RSNA. 2015; 35(5)
10. Wang L. Diagnostic value of quantitative contrast-enhanced ultrasound (CEUS) for early detection of renal hyperperfusion in diabetic kidney disease. J Nephrol. 2015
11. Chang EH, Chong WK, Kasoji SK, Dayton PA, Rathmell WK. Management of indeterminate cystic kidney lesions: Review of contrast-enhanced ultrasound as a diagnostic tool. Urology. 2015 12. Cai Y, Du L, Li F, Gu J, Bai M. Quantification of enhancement of renal parenchymal masses with contrast-enhanced ultrasound. Ultrasound Med Biol. 2014; 40(7):1387–93. [PubMed: 24768490] 13. King GK, Gulati M. Quantitative assessment of solid renal masses by contrast-enhanced ultrasound
with time-intensity curves: how we do it. Abdom Imaging. 2015
14. Atri M, Epid D, Tabatabaeifar L. Accuracy of Contrast-enhanced US for Differentiating Benign from Malignant Solid Small Renal Masses. Radiology. 2015 000(0).
15. Gerst S, Hann L, Li D, Gonen M, Tickoo S, Sohn M, et al. Evaluation of renal masses with contrast-enhanced ultrasound: initial experience. Am J Roentgenol. 2011; 194(4):897–906. 16. R Development Core Team. R: A Language and Environment for Statistical Computing [Internet].
R Foundation for Statistical Computing; Vienna Austria: 2012. Available from: http://www.r-project.org
17. Aoki S, Hattori R, Yamamoto T, Funahashi Y, Matsukawa Y, Gotoh M, et al. Contrast-enhanced ultrasound using a time-intensity curve for the diagnosis of renal cell carcinoma. BJU Int. 2011; 108(3):349–54. [PubMed: 21044245]
18. Dong Y, Wang W, Cao J, Fan P, Lin X. Quantitative Evaluation of Contrast-Enhanced
19. Karshafian R, Burns PN, Henkelman MR. Transit time kinetics in ordered and disordered vascular trees. Phys Med Biol [Internet]. 2003; 48(19):3225–37. Available from: http://
www.ncbi.nlm.nih.gov/pubmed/14579862.
20. Hudson JM, Williams R, Lloyd B, Atri M, Kim TK, Bjarnason G, et al. Improved flow
measurement using microbubble contrast agents and disruption-replenishment: clinical application to tumour monitoring. Ultrasound Med Biol [Internet]. 2011; 37(8):1210–21. Available from:
http://www.ncbi.nlm.nih.gov/pubmed/21683508.
21. Vikram R, Ng CS, Tamboli P, Tannir NM, Jonasch E, Matin SF, et al. Papillary renal cell carcinoma: radiologic-pathologic correlation and spectrum of disease. Radiographics [Internet]. 2009; 29(3):741–54. discussion 755–7. Available from: http://www.ncbi.nlm.nih.gov/pubmed/ 19448113.
22. Zhang J, Kang SK, Wang L, Touijer A, Hricak H. Distribution of renal tumor growth rates determined by using serial volumetric CT measurements. Radiology. 2009; 250(1):137–44. [PubMed: 19092093]
23. Xue L, Lu Q. Papillary renal cell carcinoma and clear cell renal cell carcinoma: Differentiation of distinct histological types with contrast-enhanced ultrasonography. Eur J Radiol. 2015
24. Courthod, G. Papillary renal cell carcinoma: A review of the current therapeutic landscape. Tucci; Marcello: 2015.
25. Kogan P, Johnson KA, Feingold S, Garrett N, Guracar I, Arendshorst WJ, et al. Validation of dynamic contrast-enhanced ultrasound in rodent kidneys as an absolute quantitative method for measuring blood perfusion. Ultrasound Med Biol. 2011; 37(6):900–8. [PubMed: 21601135] 26. Gerlinger M, Horswell S, Larkin J, Rowan AJ, Salm MP, Varela I, et al. Genomic architecture and
evolution of clear cell renal cell carcinomas defined by multiregion sequencing. Nat Genet. 2014; 46(3):225–33. [PubMed: 24487277]
27. Feingold S, Gessner R, Guracar IM, Dayton PA. Quantitative volumetric perfusion mapping of the microvasculature using contrast ultrasound. Invest Radiol. 2010; 45(10):669–74. [PubMed: 20808232]
28. Tang M-X, Mulvana H, Gauthier T, Lim AKP, Cosgrove DO, Eckersley RJ, et al. Quantitative contrast-enhanced ultrasound imaging: a review of sources of variability. Interface Focus [Internet]. 2011; 1(4):520–39. Available from: http://rsfs.royalsocietypublishing.org/content/ 1/4/520.
A
uthor Man
uscr
ipt
A
uthor Man
uscr
ipt
A
uthor Man
uscr
ipt
A
uthor Man
uscr
Figure 1.
Ellipsoidal ROI selection of both the lesion (red) and normal renal cortex (blue). ROIs were draw with a minimum diameter of 5mm, and parenchyma and lesion ROIs were drawn at approximately the same depth (±1 cm).
A
uthor Man
uscr
ipt
A
uthor Man
uscr
ipt
A
uthor Man
uscr
ipt
A
uthor Man
uscr
Figure 2.
Sample TICs of a lesion (red) and renal cortex (blue). The raw data is filtered and smoothed through software filtering. Wash-in/wash-out slopes are calculated, and time-to-peak and time-to-80% wash-out are calculated based on the filtered curves.
A
uthor Man
uscr
ipt
A
uthor Man
uscr
ipt
A
uthor Man
uscr
ipt
A
uthor Man
uscr
Figure 3.
Peak intensity ratio results. Papillary RCC measured 0.57 ± 0.24, chromophobe RCC measured 0.92 ± 0.03, and clear cell RCC measured 1.1 ± 0.1. The papillary RCC PI ratio was significantly different from clear cell (p=0.001) and chromophobe (p=0.04) ratios.
A
uthor Man
uscr
ipt
A
uthor Man
uscr
ipt
A
uthor Man
uscr
ipt
A
uthor Man
uscr
Figure 4.
Time-to-80% ratio results. Papillary RCC measured 0.35 ± 0.33, chromophobe RCC measured 1.14 ± 0.05, and clear cell RCC measured 0.68 ± 0.16. The chromophobe RCC time-to-80% ratio was significantly different from clear cell (p=0.02) and chromophobe (p=0.003) ratios.
A
uthor Man
uscr
ipt
A
uthor Man
uscr
ipt
A
uthor Man
uscr
ipt
A
uthor Man
uscr
A
uthor Man
uscr
ipt
A
uthor Man
uscr
ipt
A
uthor Man
uscr
ipt
A
uthor Man
uscr
ipt
Table 1
Definitions for metrics used for TIC analysis.
Metric Definition
Peak contrast intensity ratio Ratio of peak intensity (lesion/parenchyma)
Time-to-peak Time to peak intensity of lesion
Time-to-peak ratio Ratio of time to peak intensity (lesion/parenchyma)
Time-to-80% Time from peak intensity to 80% on wash-out for lesion
Time-to-80% on wash-out ratio Ratio of the time from peak intensity to 80% on wash-out (lesion/parenchyma)
Wash-in slope Wash-in slope of lesion
Wash-out slope Wash-out slope of lesion
Wash-in ratio Ratio of wash-in slopes (lesion/parenchyma)
Wash-out ratio Ratio of wash-out slopes (lesion/parenchyma)
A
uthor Man
uscr
ipt
A
uthor Man
uscr
ipt
A
uthor Man
uscr
ipt
A
uthor Man
uscr
ipt
Table 2
Results from ten metrics derived from lesion and parenchyma TICs.
Metric P-value (*p<0.05) P-value (cc v p) P-value (cc v ch) P-value (p v ch)
Peak Intensity ratio (PI) 0.001* 0.001 0.18 0.04
Time to Peak (TPk) 0.851 --- ---
---Time to Peak ratio (TPk-r) 0.978 --- ---
---Time to 80% (T80%) 0.065 --- ---
---Time to 80% ratio (T80%-r) 0.004* 0.08 0.02 0.003
Wash-in Slope (WIS) 0.957 --- ---
---Wash-out Slope (WOS) 0.910 --- ---
---Wash-in Slope ratio (WIS-r) (lesion/parenchyma) 0.890 --- ---
---Wash-out Slope ratio (WOS-r) (lesion/parenchyma) 0.155 --- ---