An examination of available water sources for university students in Chapel Hill, North Carolina using inductively coupled plasma mass spectrometry.
Patrick Powers
Department of Geological Sciences, University of North Carolina at Chapel Hill
Chapel Hill, North Carolina
Abstract
Responsibilities for measuring drinking water quality and usage are spread out between
various federal, state and local agencies. Therefore, monitoring water quality is a convoluted
challenge that involves numerous regulatory agencies necessitating oversight from studies and
examinations through non-regulatory agencies--such as academia. This study examines the
elemental concentrations of various bottled water brands and municipal supplies of water
accessible in Chapel Hill, North Carolina. The goal of this study is to supply the public with
adequate information on water quality in terms of trace metals and taste to allow the public to
make informed decisions on the best drinking water options available in Chapel Hill.
Drinking Water, Water Purification, Municipal Water, Bottled Water, Water Quality
Introduction
In Chapel Hill, North Carolina, drinking water sources are varied and plentiful.
Municipal tap water is available citywide under the authority of Orange Water and Sewer
Authority (OWASA and North Carolina Drinking Water Watch, n.d.). Bottled water of
seemingly endless brands are sold in local grocery store chains, vending machines and
restaurants. Additionally, water purification methods such as Brita water filters and boiling are
also available options. With countless choices at hand, and little information available on quality,
health-conscious students and the public are unable to determine the safest and most palatable
water option without the use of geochemical laboratory equipment. This study aims to ascertain
the optimal drinking water in the Chapel Hill, North Carolina area using inductively coupled
plasma mass spectrometry in order to provide a more informed choice for students at The
University of North Carolina.
In North Carolina, tap water can be derived municipally or from private wells. Around
40% of Orange county’s population relies on private wells, which require less stringent and less
frequent quality testing than municipal water (Orange County NC Government, n.d.). The other
60% of Orange county relies on municipal water, 93% of whom are covered by the Orange
County Water and Sewer Authority (OWASA). OWASA sources its water completely from
surface water sources, including Cane Creek Reservoir, University Lake, and Rock Quarry. In
Town of Hillsborough water systems--all of which are surface water-sourced. OWASA has
21,000 service connections that supply water to a population of 83,300. The population of
Orange county is 148,476, meaning 56.1% of Orange county residents rely on OWASA for
municipal water (North Carolina Drinking Water Watch, n.d.).
In the past five years, OWASA has had at least two water crises. In February of 2017, the
crisis began with the accidental over-fluoridation of over a million gallons of stored drinking
water by a broken pump, causing a non-potable drinking condition. While the contaminated
water was being treated, OWASA borrowed finished water from the nearby City of Durham to
supply customers. Two days after the initial contamination, a water main broke off Foxcroft
Drive. Over 1 million gallons of potable water spilled into the nearby area, leading to a sharp
decrease in water pressure. High water pressure is imperative to providing clean and safe water
to customers--without it, backflow leading to bacteria contamination is a serious concern,
however, differences in elemental concentration is unlikely. Soon after the water main broke,
OWASA released a twenty-four hour ‘do-not-drink’ advisory. The lack of available water for
Orange County residents for only twenty-four hours resulted in a multi-million dollar loss to
local businesses (ABC News I Team, 2017). Less than a year after OWASA’s first water crisis, a
77-year-old water main fractured in November of 2018, leading to a 9.2 million gallon spill. As a
result, The University of North Carolina at Chapel Hill was forced to close classes, and all
customers were given a ‘boil water’ advisory. Two days later, the pipe was repaired (Smoot,
2018). With many of OWASA’s pipes over half a century old, and water crises becoming more
frequent, university students may lose trust in the municipal water. As an alternative, students
Bottled water brands available on or near the university campus are Deer Park, Great
Value, Kirkland, Harris Teeter, Fiji, and Evian. Great Value is the generic Walmart brand of
water, while Kirkland is the generic Costco brand of water. Harris Teeter and Walmart get their
water various Pennsylvania springs. Kirkland is sourced from the municipal supply of Kirkland
Colorado from the Cedar River Watershed and the South Fork Tolt River watershed. Fiji and
Evian are both high-end water brands, and are purported as being better-tasting and more pure
than generic or mid-level water brands and municipal water (Fiji, n.d) (Evian, n.d.). Fiji claims
the source of its water comes from an artesian well that purifies the water naturally as it
percolates through the volcanic rock in Vitu Levu, Fiji. Evian source of water comes from the
Cachat Springs in the French Alps as water passes through the glacier plateau. Deer Park is a
mid-level water brand sold in most chain stores. Unlike municipal water, bottled waters have
heavy advertising. However, many bottled waters are sourced municipally, making the product
no different from the water found at the end of a tap. Deer Park, owned by Nestle, is sourced
from wells in Florida, Pennsylvania, Maryland, New York, Michigan, and South Carolina. Food
and Drug Administration loopholes allow the company to source groundwater from wells and
market their product as ‘natural spring water’ from Deer Park, Maryland--without having to
disclose the difference to customers (Pennst and Times, 2008).
Frequently, students and the public purify water themselves through methods such as
filtration or boiling. Brita, a popular water filter brand, claims that “All Brita filters cut chlorine
taste and odor, and our...filters remove 99% of lead.” The brand also claims to remove cadmium,
zinc, chlorine, copper, and mercury from water purified using its filtration devices (Brita, 2019).
bacterial infection from contaminated water but no difference in elemental concentration is
expected (Groh et al., 2006).
Tap water is heavily monitored under EPA guidelines, and as such has stricter regulations
and more consistency than bottled water which contains minerals and chemical constituents
added or from the localities they were extracted. This study aims to examine the muncipal supply
of tap and bottled water for quality assurance, to distinguish the effects, if any, that filtration,
boiling, and the water crisis have on the trace element concentrations and to quantify the taste of
bottled water with the pH range of the Secondary Drinking Water Regulations of the EPA.
Methods
Bottled, municipal, and purified water samples were collected in February of 2017 by a
group of graduate student volunteers in the Geological Sciences department at the University of
North Carolina at Chapel Hill. Ten bottled water samples were collected, two each of the brands
Fiji, Evian, Deer Park, Kirkland, Harris Teeter, and Great Value. All five municipal water
samples originated from OWASA, and one sample was taken at each location: a water Fountain
in Mitchell Hall, Ridgehaven Townhomes, Baity Hill Graduate Housing, Sunstone Apartments,
and Tyler Creek Apartments. Additionally, one sample each was taken from Ridgehaven
Townhomes and Baity Hill Graduate Housing, to be purified through a Brita water filter and to
be boiled, respectively. Chart 1 and 2 describe the source location and various samples taken for
this study. As the first OWASA water crisis occurred in the same month, researchers were able
to take a water sample from the Mitchell Hall water fountain on the first day of the crisis, as well
as a sample on the day the crisis had ended.
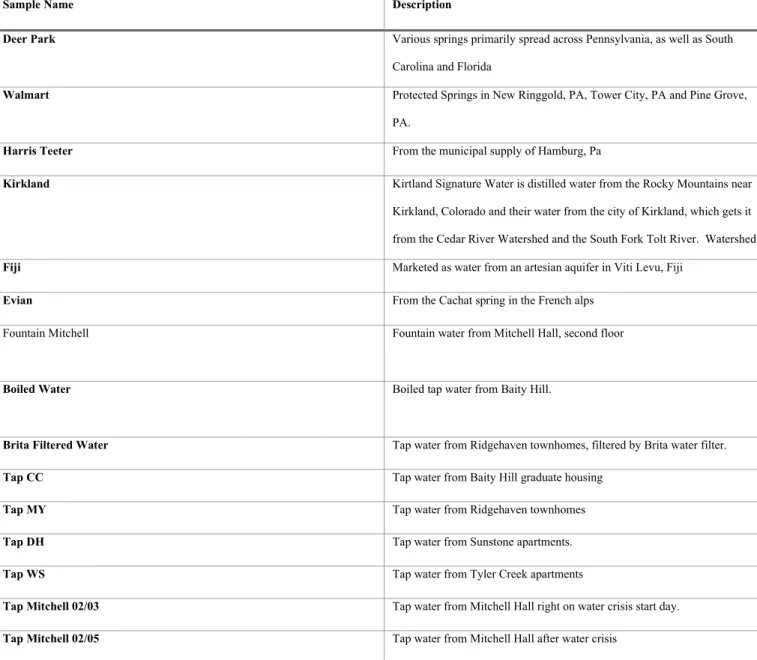
Sample Name Description
Deer Park Various springs primarily spread across Pennsylvania, as well as South Carolina and Florida
Walmart Protected Springs in New Ringgold, PA, Tower City, PA and Pine Grove, PA.
Harris Teeter From the municipal supply of Hamburg, Pa
Kirkland Kirtland Signature Water is distilled water from the Rocky Mountains near Kirkland, Colorado and their water from the city of Kirkland, which gets it
from the Cedar River Watershed and the South Fork Tolt River. Watershed
Fiji Marketed as water from an artesian aquifer in Viti Levu, Fiji Evian From the Cachat spring in the French alps
Fountain Mitchell Fountain water from Mitchell Hall, second floor
Boiled Water Boiled tap water from Baity Hill.
Brita Filtered Water Tap water from Ridgehaven townhomes, filtered by Brita water filter. Tap CC Tap water from Baity Hill graduate housing
Tap MY Tap water from Ridgehaven townhomes
Tap DH Tap water from Sunstone apartments.
Tap WS Tap water from Tyler Creek apartments
Tap Mitchell 02/03 Tap water from Mitchell Hall right on water crisis start day. Tap Mitchell 02/05 Tap water from Mitchell Hall after water crisis
Table 1: Identification of sample names that were run through the ICP-MS for elemental concentrations and a description of their various sources.
The water samples were collected using 15 mL acid-washed centrifuge tubes. Volunteers
collecting samples were instructed to wash their hands in advance, as well as not touch the rim or
inner surface of the tubes. Each municipal water sample was collected after letting the tap flow
for at least a minute before filling the centrifuge tubes. All samples collected were between 10 to
15 mL in volume. Afterwards, researchers used pipettes and transfer tubes to remove additional
added to each sample in order to create a 2% nitric acid matrix. The prepared samples were
analyzed using an Agilent 7900 quadrupole inductively coupled plasma mass spectrometer and
SLRS-5, a Canadian river water standard. All samples were analyzed by the mass spectrometer
on the same day, using the same standard. Standards and calibration blanks were inserted before
and halfway through the water samples to ensure accuracy of the equipment.
Data analysis was conducted using IBM SPSS and Microsoft Excel software for quality
and accuracy of information.
Percent Error of the data was calculated using the formula:
% Error = 100 *| (S - A) / A |
With variables meaning:
| value | = absolute value
S = SLRS-5 sample measured value
A = Actual value of SLRS-5 in standard reference
Percent error calculations were calculated for two SLRS-5 measurements taken at the beginning
of the measurements and midway through data collection. Both values were recorded and
averaged for overall percent error for each element.
Percent precision of the data was calculated using the formula using the standard deviation
repeated measurements of SLRS-5:
Long term Precision % = 100* (2*σ)/(m)
With variables meaning:
2σ=2 standard deviations measured from repeated SLRS-5 measurements
For water samples from the same source and with the same purification method (or lack thereof),
an average of each measured element was taken between the samples in order to have only one
value for each source and treatment method. The pH of each bottled water sample and the
Mitchell Hall fountain sample unrelated to the crisis were taken using a standard pH meter.
Three pH measurements were taken for each sample and averaged for the final value. Elemental
concentrations of each sample were compared with the United States Environmental Protection
Agency National Primary Drinking Water Regulations, displayed below (EPA Primary
Regulations):
Contaminant MCL (mg/L) MCLG (mg/L)
Arsenic 0.01 0
Barium 2 2
Beryllium 0.004 0.004
Cadmium 0.005 0.005
Chromium 0.1 0.1
Copper 1.3 1.3
Lead 0 0.015
Selenium 0.05 0.05
Thallium 0.0005 0.002
Uranium 0.03 0
Figure 1: United States Environmental Protection Agency (EPA) National Primary Drinking Water Regulations.
Results
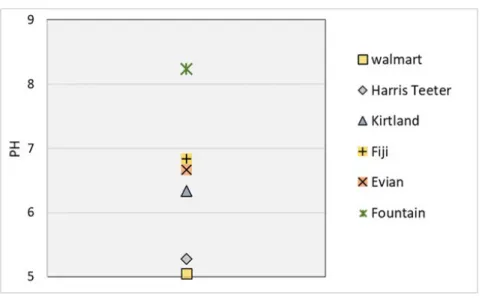
Figure 2: Average pH values for selected water samples. Exact pH values are stated below the figure.
The pH averages of the selected samples fell between 5.05 and 8.24. The lowest pH of
5.05 was attributed to the Great Value (Walmart) sample. The following pH values for each
sample from lowest to highest were 5.28 for Harris Teeter, 6.34 for Kirkland, 6.66 for Evian, and
6.84 for Fiji. The highest pH value belonged to the Mitchell Hall sample, with a value of 8.24.
All samples were bottled waters, apart from Mitchell Hall, which was municipal water.
According to the Secondary Drinking Water requirements of the EPA, the ideal pH for taste is in
between 6.5 and 8.5. Lower than 6.5 creates a metallic, bitter taste and is evidence for possible
corrosion. Higher than 8.5 creates a slippery or soda taste and is evidence for sediments or
scaling of mineral deposits built up in pipes. All samples fall in this range except for Harris
Teeter and Kirkland brand water (EPA Secondary Requirements).
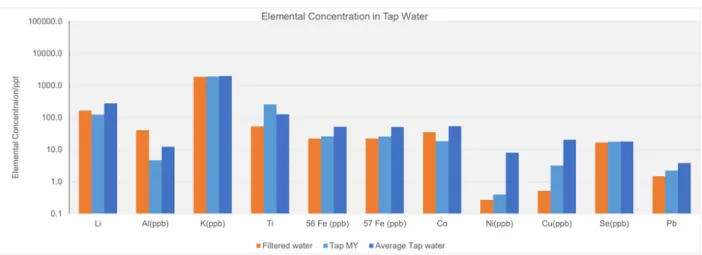
Figure 3: Elemental Concentrations in Tap Water with EPA Standard Comparison. The grey line labeled “Primary MCL” refers to the EPA
maximum contaminant level for each element listed. Elements were chosen based on accuracy and importance. Element values were not shown
for elements with a percent error value greater than 10%.
Figure 4: Elemental Concentrations in Bottled Water. Bottled water is under regulations by the FDA which are less strict, however, all samples
from the elements depicted fall within EPA regulations. Elements were chosen based on accuracy and importance. Element values were not
shown for elements with a percent error value greater than 10% except for Pb, depicted for consistency and has a 16.76% error.
Elemental concentrations for lithium, aluminum, potassium, titanium, 56-iron, 57-iron,
cobalt, nickel, copper, selenium, and lead were recorded for each tap/municipal water sample
Elemental concentrations for lithium, aluminum, potassium, titanium, 56-iron, 57-iron, cobalt,
nickel, copper, selenium, and lead were recorded for bottled water samples, but were unable to
be compared to EPA MCL standards due to high percentages of error in sampling.
Lithium concentrations were divided into two groups of similarity. Group one contained
samples from Mitchell fountain, filtered water from Ridgehaven, unaltered water from
Ridgehaven, unaltered water from Sunstone apartments, and unaltered water from Tyler Creek
apartments. Group one had an average value of around 200 ppt. Group two consisted of
municipal water taken from Baity Hill apartments, both boiled and unaltered, and had an average
value of around 950 ppt. The purification methods of boiling and filtration did not have a
significant effect on Lithium concentration.
Aluminum concentrations were even across the board at around 20 ppb, with the
exception of samples taken at Ridgehaven townhomes, which fell both above and below the
mean of the other samples. Unaltered water from Ridgehaven measured at around 70 ppb,
whereas boiled water from the same source measured at around 8 ppb.
Potassium levels for all samples were relatively equal with an average value of around
3000 ppb. Selenium levels were also equal for all samples, with an average value of around 20
ppb. None of the samples went over the EPA maximum contaminant limit for selenium. 56 and
57 iron levels were the same for corresponding samples. All copper values fell below the EPA
maximum contaminant limit.
Figure 5: Elemental Concentration in Tap Water from Ridgehaven townhomes, before and after using boiling as a purification method. “Filtered
water” refers to the sample consisting of tap water taken from the Ridgehaven townhomes and filtered by a Brita water filter. Tap MY” references
the unaltered sample taken from Ridgehaven townhomes.
Figure 6: Elemental Concentration in Tap Water from Baity Hill Graduate Student Housing, before and after using a Brita water filter as a
purification method. “Boiled water” references the sample taken from Baity Hill tap water that was boiled for purification. “Tap CC” references
the sample taken from Baity Hill that was unaltered.
Brita filtration of the Ridgehaven townhomes municipal water resulted in a slight
increase in lithium concentration (50 ppt), a large increase in aluminum concentration (55 ppb), a
moderate decrease in titanium concentration (220 ppt), a very slight decrease in iron 56 and 57
concentration (5 ppb), a very large decrease in copper concentration (4 ppb), and a small
Boiling of water from Baity Hill Graduate Student Housing resulted in little to no change
in elemental concentrations measured for any element. As boiling of water is used to denature
and remove harmful organics such as bacteria, instead of alter elemental amounts, the lack of
change was expected.
OWASA Water Crisis Results:
Figure 7: Elemental Concentration in Tap Water During and After the First OWASA Water Crisis. “Tap Mitchell 02/03” refers to the sample
taken from Mitchell Hall on the first day of the water crisis. “Tap Mitchell 02/05” refers to the sample taken from Mitchell Hall on the first day
after the end of the water crisis.
Interestingly, elemental concentrations of water taken after the water crisis are either the
same as or higher than elemental concentrations taken during the water crisis. Concentrations
with greater values for after the water crisis include lithium, aluminum, potassium, titanium, iron
56, iron 57, nickel, copper, and selenium. Concentrations with negligible difference include
Percent Accuracy and Percent Error Results:
Figure 8: Percent Error for Bottled Water. Samples in this data were sourced from Deer Park, Evian, Fiji, Walmart (Great Value), Kirkland, and
Harris Teeter water bottle brands. Ten bottled water samples were collected, two each of the brands Fiji, Evian, Deer Park, Kirkland, Harris
Figure 9: Percent Error for Tap/Municipal Water. All five municipal water samples originated from OWASA, and one sample was taken at each
location: a water Fountain in Mitchell Hall, Ridgehaven Townhomes, Baity Hill Graduate Housing, Sunstone Apartments, and Tyler Creek
Apartments.
Element %Error-Tap Water %Error-Bottled Water
Li 2.2 0.88
Be 100 1633
Al 0.80 4.8
K 1.14 5.68
Ca 65.96 60.16
Sc 37.37 41.73
Ti 4.99 1.99
Cr 10.72 12.780
Co 10.1 4.76
Ni 1.01 6.84
Cu 0.49 0.79
Zn 26.82 23.20
As 55.59 66.66
Rb 7206 6639.56
Sr 99.54 99.57
Mo 97.95 98.03
Cd 248704.3 244744.6
Ba 83.96 99.15
Pb 9.01 16.76
Figure 10: Percent Accuracy of analyzed elemental concentrations for tap/municipal water and bottled water.
Conclusions
This study had significant errors and limitations. Inadequate recordation of methodology
by initial researchers led to an inability to properly analyze the effects of boiling and filtration on
water quality. Additionally, extremely high percentages of error and precision led to most
elemental data being unusable and not statistically significant. Thus, all conclusions in this study
must be interpreted with caution. Future reproduction of the study is necessary for trustworthy
results.
The variations in pH data between the bottled water and tap water samples were quite
interesting. All samples fell within the ideal taste range, except for Kirkland and Harris Teeter
brand water. While the municipal sample (Mitchell Hall) had the highest pH value, it was still
and thus were purported to be the best-tasting water samples. Additional pH testing of the other
municipal water samples, as well as water crisis and purification methods samples would add
valuable data to this study.
Further examinations on elemental concentrations for water quality are needed to
significantly reduce the error in this study and provide knowledge to other research. For instance,
Alison P. Sanders, who found detectable levels of As, Cd, Hg, and Pb in blood samples from
various NC cohorts and who urges more research on drinking water (Sanders). With more testing
on elemental concentrations of water health, environmental, and structural issues can be
mitigated or prevented. The elemental concentration in this study should be heavily scrutinized
due to extremely large error margins, however, it is notable that all samples were considered safe
according to the EPA regulations. Thus, it is to be concluded that despite water crises, filtration
methods, or municipal and bottled sources, all water in the Chapel Hill area is safe for students to
drink.
Acknowledgements
A special thanks goes out to Cheng Cao, for sample collection and analysis of the data in
the IC-PMS. Additional gratitude is given to Ming Yang, Wenshuai Li, Dinghuang Ji for sample
collection. Many thanks to Xiaoming Liu, for use of her lab. Last but not least, thank you to The
University of North Carolina at Chapel Hill Geological Sciences Department for employing the
References
ABC I team . (2017, February 7). I-Team: A 1-2 punch led to Orange County water crisis.
Retrieved from https://abc11.com/1740692/
Brita . (2019, July 8). Do Brita Filters Work? Clean Water Benefits. Retrieved from
https://www.brita.com/why-brita/
Edwards, S. E., Maxson, P., Miranda, M. L., & Fry, R. C. (2015). Cadmium levels in a North
Carolina cohort: Identifying risk factors for elevated levels during pregnancy. Retrieved
from https://www.ncbi.nlm.nih.gov/pmc/articles/PMC4312255/
Environmental Protection Agency . (2020, February 14). National Primary Drinking Water
Regulations. Retrieved from
https://www.epa.gov/ground-water-and-drinking-water/national-primary-drinking-water-regulations
Evian . (n.d.). evian® Natural Spring Water. Retrieved from https://www.evian.com/en_us?
utm_medium=cpc&utm_source=Bing&utm_campaign=Evian_Conquesting_Conquesting
_Bing_Exact&utm_term=fiji water&gclid=CL3eirWA-ugCFVjxswod7d4EdQ&gclsrc=ds
Fiji . (n.d.). Fiji Water: It begins as a cloud. Retrieved from
Groh, D., C., MacPherson, & J., D. (2006, July 28). Effect of Heat on the Sterilization of
Artificially Contaminated Water. Retrieved from
https://academic.oup.com/jtm/article/3/1/11/1804442
Liaugaudaite, V., Mickuviene, N., Raskauskiene, N., Naginiene, R., & Sher, L. (2017, March
24). Lithium levels in the public drinking water supply and risk of suicide: A pilot study.
Retrieved from https://www.sciencedirect.com/science/article/pii/S0946672X16302887
National Research Council Canada. (2020, April 27). Home - National Research Council
Canada. Retrieved from
http://www.nrc-cnrc.gc.ca/eng/services/inms/reference-materials.html
Orange County, North Carolina . (n.d.). Wells. Retrieved from
https://www.orangecountync.gov/798/Wells
OWASA. (n.d.). NC Water System Details. Retrieved from https://www.pwss.enr.state.nc.us/
NCDWW2/JSP/WaterSystemDetail.jsp?
tinwsys_is_number=13981&tinwsys_st_code=NC&wsnumber=NC0368010
PENNSt, I. V. A. N., & Times, P. (2008, March 22). Your Bottled Water May Not Come
From a Spring. Retrieved from
https://www.theledger.com/article/LK/20080322/News/608087299/LL
Public Health. (n.d.). Well Water and Health. Retrieved from https://epi.dph.ncdhhs.gov/oee/
Sanders, A. P., Flood, K., Chiang, S., Herring, A. H., Wolf, L., & Fry, R. C. (2012). Towards
prenatal biomonitoring in North Carolina: assessing arsenic, cadmium, mercury, and lead
levels in pregnant women. Retrieved from
https://www.ncbi.nlm.nih.gov/pmc/articles/PMC3302877/
Secondary Drinking Water Standards: Guidance for Nuisance Chemicals. (2016, November
29). Retrieved from
https://19january2017snapshot.epa.gov/dwstandardsregulations/secondary-drinking-water-standards-guidance-nuisance-chemicals_.html
Smoot, R. (2018, November 8). After the second water crisis in two years, OWASA discusses
emergency prevention. Retrieved from
https://www.dailytarheel.com/article/2018/11/owasa-meets-to-discuss-second-water-crisis-in-chapel-hill-carrboro
Tammy. (n.d.). Water ban deals a $471,479 hit to Chapel Hill-Carrboro hotels. Retrieved
from https://www.newsobserver.com/news/local/community/chapel-hill-news/