Studies on organic acid based biotech nutrients to enhance Soil organic carbon
(SOC) and grain yield in Maize (Zea Mays) crop
P. Elisha1, Rajesh Kumar Sharma2, V. Varma3
1. Research scholar - Bio Technology, SMVDU, Jammu 2. Vice President Prathista Industries ltd, 3. Director, school of Bio Technology and Dean COS, SMVDU, Jammu.
Abstract
Maize (Zea mays) is one of the staple foods in many third world nations. Its production has increased over years as people change their consumption trends. Maize has evolved from a purely substance to a successful commercial crops. Maize is sold mainly for food in schools, relief by World Food programme (WFP). Maize Production has improved with the adoption of innovative technologies in farmer fields. These technologies include Organic acid based biotech formulations, Integrated nutrient management, improved seeds like hybrid and Longe varieties, timely planting, proper spacing and timely harvesting. Organic farming enhances soil carbon and its benefits (Hepperly, 2007).Adoption of Organic farming practices and usage of Lacto-gluconate based organic manures, vegetable protein and sea-weed based amino-acids, gluconic acid and lactic acid formulations enhanced the soil fertility, soil organic carbon (SOC) and increase in grain yield in Maize crop. As all these products are made from natural ingredients with microbial actions through fermentation, the formulations are ideal substitutes of inorganic nutrients in organic farming.
1. Introduction:
The nutrient bounded lacto-gluconate based products, not only ensures the supply of particular nutrient to the soil and crop, but they also enhances microbial activity by supplying carbon rich organic acids particularly glucose, an ideal food source for soil microorganisms and increases biological activity and soil organic carbon(SOC). The protein hydrolysate based products from vegetable protein and sea weed are rich source of soluble proteins and amino acids; hence act as growth promoters and ideal microbial activity enhancers and grain yield.
1.1 Soil Organic Carbon:
Soils contain carbon (C) (Milne, Eleanor 2008) in both organic and inorganic forms. In most soils (with the exception of calcareous soils) the majority of C is held as soil organic carbon (SOC) (Batjes, N.H., 1996). The term soil organic matter (SOM) is used to describe the organic constituents in the soil (tissues from dead plants and animals, products produced as these decompose and the soil microbial biomass). The term ‘soil organic carbon’ refers to the C occurring in the soil in SOM. The constituents of SOM can be divided into non-humic substances, which are discrete identifiable compounds such as sugars, amino acids and lipids, and humic substances, which are complex largely unidentifiable organic compounds. As organic compounds, both humic and non-humic substances contain carbon, oxygen (O) and hydrogen (H) and can also contain nitrogen (N), phosphorus (P) and sulfur (S).
1.2 Management of SOC:
organic wastes). Management of soils (Smith.P 2004) to increase SOC content therefore involves measures that reduce losses and/or measures that increase inputs.
2.0 Organic formulations through Biotechnology route:
Gluconic acid based formulations:
Among various organic acids, gluconic acid seems to be the major mechanism of phosphate solubilization by gram negative bacteria (Goldstein et al.1993; Kim et al., 1998). Gluconic acid is produced by the oxidative metabolism of glucose dehydrogenase enzyme through microbial fermentation with different types of Aspergillus niger strains.
Lactic acid based formulations:
Different strains of Lactobacilli are used for Lactic acid production. Lactic acid bacteria have also been used for the treatment of animal manures, farm yard manure and sewage for odor abatement and as an inoculant to accelerate the composting of organic wastes (Okada, 1998).
Amino acids based formulations:
The chelating ability of amino acids has been used in fertilizers for agriculture to facilitate the delivery of minerals to plants in order to correct mineral deficiencies, such as iron chlorosis and other nutrient deficiencies. These fertilizers are also used to prevent deficiencies from occurring and improving the overall health of the plants (Ashmead, H. DeWayne 1986). Amino acids can be extracted from marine algae like sea weeds (Ascophylum nodosum), plant like soybean, maize gluten, protein cake from vegetable oil industries and animal proteins.
Protein lacto gluconate Nutrients:
Several organic carbon (OC) rich formulations tailored with amino acids, gluconic and lactic acids
blended with elemental Nitrogen(N),
phosphorous(P), potassium(K) , sulfur(S), calcium(Ca), magnesium(Mg), boron(B), copper(Cu), iron(Fe), molybdenum(Mo), manganese(Mn) etc., were produced from research & development based biotech industries. These formulations were proved through bio-efficacy studies by several national and
laboratories on various crop systems and environmental conditions.
3.0 MATERIALS AND METHODS
Apparatus: Analytical balance, Kjeldhal flask– 500 ml, distillation assembly, conical flasks (250ml,500 ml), Measuring cylinders(50ml, 250 ml) Absorption spectrophotometer, Hydrometer, Burette, pipette, heating mantels
Soil Analysis:
Soil analysis was conducted on two soil samples for fertility. The analysis also involved pH, Organic matter (OM), total nitrogen (N), available phosphorus (Av. P), exchangeable bases of calcium (Ca), magnesium (Mg) and potassium (K) and texture ( percentage sand, clay and silt).
Experiment Field Soil analysis data:
Sample pH Total
N
OM Av.P K Ca Mg Texture (%) TexturalC
lass
% mgkg-1 cmoles/kg sandy clay Silt
Sample 1 6.41 0.067 1.3 9.58 0.62 4.4 1 61 16 23 Sandy
loamy
Sample 2 5.9 0.05 1.0 8.0 0.51 3.9 0.8 63 18 19 Sandy
loamy
Field Experiment:
To evaluate Soil Organic carbon and grain yield in different treatments of only Organic, integrated (Inorganic Fertilizers + Organic inputs) and only inorganic farming practices in Maize (Zea mays).
Crop: Maize (Zea Mays)
Variety: Longe-5
Seed rate: 10-12 kg seed/Acre
Spacing: 75 cms x 30 cms (Bet. R–R: 75 cms; P–P: 30 cms)
Maturity: 100 -115 days
No. of treatments: 6 (T0, T1, T2, T3, T4, T5,)
No. of replications: 3 (R1, R2, R3)
Experiment Design: Randomized block design (RBD) (Addelman, Sidney, 1969)
Total Area: 1 Acre, Each Block: 224 sq.mts
Field Experiment Plot details with block-wise Treatment number and Replication number:
T0-R1 T1-R1 T2-R1 T3-R1 T4-R1 T5-R1
T5-R3 T0-R3 T2-R3 T3-R3 T1-R3 T4-R3
Treatments:
T0: Control (No fertilizer)
T1: 100% Inorganic fertilizers
T2: 100% Organic inputs
T3: 75% Inorganic fertilizers + 25% Organic fertilizers
T4: 50% Inorganic fertilizers + 50 % Organic fertilizers
T5: 25% Inorganic fertilizers + 75% Organic fertilizers
Inorganic fertilizers:
DAP (Di-ammonium phosphate), Urea, MOP (Muriate of potash)
Organic inputs (Organic acids–gluconic acid, lactic acid, amino acids):
Organic N: source Aminoacids from vegetable protein
Organic P: Phosphorous, proteinhydrolysates/Aminoacids
Organic K: Potassium Gluconate and potassium lactate/potassium blend of proteinhydrolysates, gluconic acid and lactic acid.
Organic Micronutrients: micronutrients Ca, Mg, B, Cu, Fe, Mo, Mn blend of gluconic and lactic acids.
Organic Zn : Zinc blend with amino acids, gluconic and lactic acids.
Table 1: Total organic carbon (TOC) in each Organic input.
Organic Inputs %Total Organic Carbon(TOC)(mg kg-1)
Compost 3.364
Organic P 3.230
Organic N 3.054
Organic K 3.970
Organic Micronutrient 2.931
Treatments Dosage of fertilizer/Acre Application stage
T0
No fertilizer
Control–no fertilizer nil
T1
100% Inorganic
DAP: 50 kg;
UREA: 100 kg;
MOP: 50 kg
Basal Dosage
2 splits 25 & 45 DAS
45 DAS
T2
100% Organic
Compost 100 kg
Organic P 50 kg
Organic N 50 kg
Organic k 50 kg
Organic P @ 3 ml per liter of water
Organic N @ 3ml per liter
Organic Zn @ 3ml per liter of water
Organic Micronutrient @ 3ml per liter of water
Organic k @ 3ml per liter of water
Last Basal
Basal/At sowing
25 DAS
45 DAS
20 DAS
between 21–30 DAS
between 31 - 35 DAS
between 40–50 DAS
between 50–60 DAS
T3
75% Inorganic
+
25% Organic
Compost 25 kg
DAP: 37.5 kg + Organic P:12.5kg
Urea:75kg + Organic N:12.5 kg
MOP:37.5 kg + Organic k: 12.5 kg
Organic P @ 0.75 ml per liter of water
Organic N @ 0.75 ml per liter
Organic Zn @ 0.75 ml per liter of water
Organic Micronutrient @ 0.75 ml per liter of water
Organic k @ 0.75 ml per liter of water
Last Basal
Basal/At sowing
25 DAS
45 DAS
20 DAS
between 21–30 DAS
between 31 - 35 DAS
between 40–50 DAS
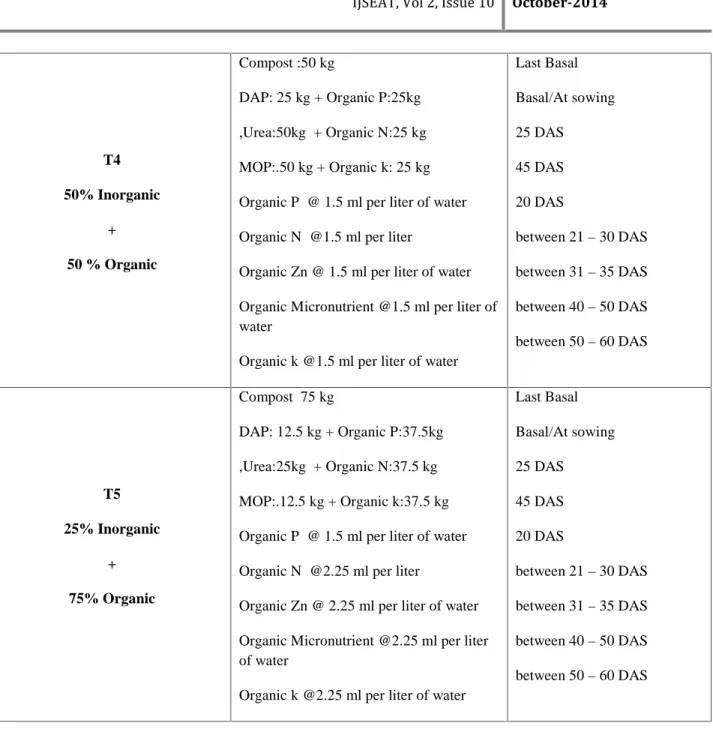
T4
50% Inorganic
+
50 % Organic
Compost :50 kg
DAP: 25 kg + Organic P:25kg
,Urea:50kg + Organic N:25 kg
MOP:.50 kg + Organic k: 25 kg
Organic P @ 1.5 ml per liter of water
Organic N @1.5 ml per liter
Organic Zn @ 1.5 ml per liter of water
Organic Micronutrient @1.5 ml per liter of water
Organic k @1.5 ml per liter of water
Last Basal
Basal/At sowing
25 DAS
45 DAS
20 DAS
between 21–30 DAS
between 31–35 DAS
between 40–50 DAS
between 50–60 DAS
T5
25% Inorganic
+
75% Organic
Compost 75 kg
DAP: 12.5 kg + Organic P:37.5kg
,Urea:25kg + Organic N:37.5 kg
MOP:.12.5 kg + Organic k:37.5 kg
Organic P @ 1.5 ml per liter of water
Organic N @2.25 ml per liter
Organic Zn @ 2.25 ml per liter of water
Organic Micronutrient @2.25 ml per liter of water
Organic k @2.25 ml per liter of water
Last Basal
Basal/At sowing
25 DAS
45 DAS
20 DAS
between 21–30 DAS
between 31–35 DAS
between 40–50 DAS
between 50–60 DAS
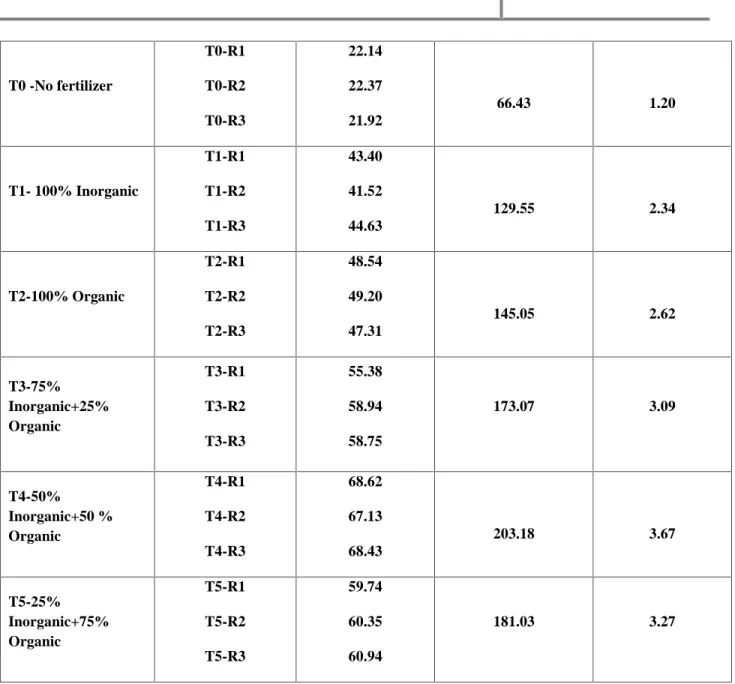
Table 3:Block-wise grain yield per each treatment (T0-T5)
TREATMENTS Plot references
Yield/Block
224 sq.mts(Kgs)
Grain yield/Treatment
Yield/ Acre
T0 -No fertilizer
T0-R1
T0-R2
T0-R3
22.14
22.37
21.92
66.43 1.20
T1- 100% Inorganic
T1-R1
T1-R2
T1-R3
43.40
41.52
44.63
129.55 2.34
T2-100% Organic
T2-R1
T2-R2
T2-R3
48.54
49.20
47.31
145.05 2.62
T3-75% Inorganic+25% Organic
T3-R1
T3-R2
T3-R3
55.38
58.94
58.75
173.07 3.09
T4-50%
Inorganic+50 % Organic
T4-R1
T4-R2
T4-R3
68.62
67.13
68.43
203.18 3.67
T5-25% Inorganic+75% Organic
T5-R1
T5-R2
T5-R3
59.74
60.35
60.94
181.03 3.27
4.0 RESULTS:
Table -4: Grain yield in tonnes acre-1for each treatment.
TREATMENTS Grain yield/Treatment
Yield/ Acre
(Tonnes)
T0 -No fertilizer 66.43 1.20
T1- 100% Inorganic 129.55 2.34
T3-75% Inorganic+25% Organic 173.07 3.09
T4-50% Inorganic+50 % Organic 203.18 3.67
T5-25% Inorganic+75% Organic 181.03 3.27
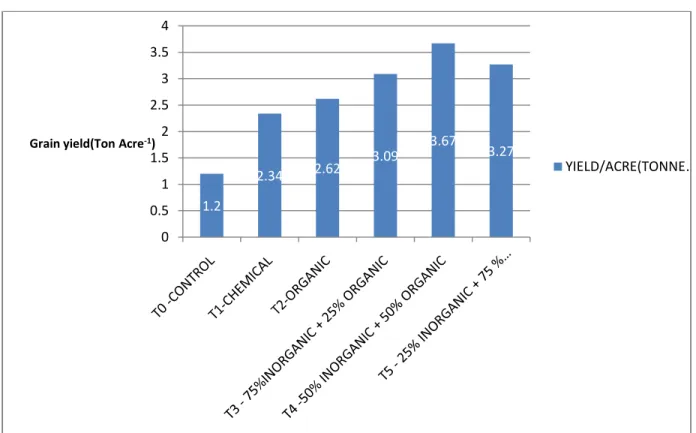
Diagram-2: Grain yield in tonnes per acre for each treatment.
Table -5: %Soil organic carbon (%SOC) in different soil levels.
TREATMENTS 0-15 Cms 15-30Cms 30-45 Cms Avg% SOC
T0 -No fertilizer 1.32 1.14 0.98 1.14
T1- 100% Inorganic 1.35 1.24 1.38 1.32
T2-100% Organic 2.23 2.36 2.20 2.26
1.2
2.34 2.62
3.09 3.67 3.27
0 0.5 1 1.5 2 2.5 3 3.5 4
Grain yield(Ton Acre-1)
T3-75% Inorganic+25% Organic 1.47 1.29 1.42 1.39
T4-50% Inorganic+50 % Organic 1.75 1.66 1.72 1.71
T5-25% Inorganic+75% Organic 1.96 1.82 1.87 1.88
Table - 6: Average Percentage of soil organic carbon (%SOC) in each treatment plot as follows:
TREATMENTS % SOC
T0 -No fertilizer 1.14
T1- 100% Inorganic 1.32
T2-100% Organic 2.26
T3-75% Inorganic+25% Organic 1.39
T4-50% Inorganic+50 % Organic 1.71
T5-25% Inorganic+75% Organic 1.88
5.0 Results:
Among different treatments and practices the maximum grain yield was recorded in T4-50% Inorganic fertilizers + 50% Organic fertilizers (3.67 t/acre) followed by T5-25% Inorganic fertilizers + 75% Organic fertilizers(3.27 t/acre), T3-75% Inorganic fertilizers + 25% Organic fertilizers(3.09 t/acre), T2-100% Organic inputs (2.62 t/acre), T1-100% Inorganic fertilizers(2.34 t/acre), T0-Control (No fertilizer) (1.20 t/acre).
The maximum percentage of increased soil organic carbon (%SOC) was recorded in T2: 100% Organic inputs (2.26) followed by T5: 25%
Inorganic fertilizers + 75% Organic fertilizers(1.88), T4: 50% Inorganic fertilizers + 50 % Organic fertilizers (1.71), T3: 75% Inorganic fertilizers + 25% Organic fertilizers(1.39), T1: 100% Inorganic fertilizers (1.32), T0: Control (No fertilizer) (1.14) .
6.0 Discussions:
respectively in T3,T4,T5 integrated treatments. Organic fertilizers are rich in carbon content that enhanced the soil organic matter thus increased the percentage of SOC. The grain yield is higher in Integrated treatments T3-75% Inorganic fertilizers + 25% Organic fertilizers(3.09 t/acre),T4-50% Inorganic fertilizers + 50% Organic fertilizers (3.67 t/acre), T5-25% Inorganic fertilizers + 75% Organic fertilizers(3.27 t/acre), than solo inorganic fertilizer T1-100% Inorganic fertilizers(2.34 t/acre), Hence the increased levels of organic fertilizer 25%, 50% and 75% in integrated (T3-T5) treatments were given higher grain yield of maize crop than T0- control and T1-100% inorganic treatment.
7.0 Conclusion:
The above comparative field studies in Maize (Zea mays) showed that the organic acids (Amino acid, gluconic and lactic acid) based products increased the percentage of soil organic carbon (SOC) in maize. The treatment T2-100% organic practice is the maximum increase of SOC (2.26). The SOC percent was increased in plots where the ratio of organic fertilizers increased gradually. The SOC was decreased where the ratio of inorganic fertilizers increased. Hence, it is clear that Organic acid based nutrients played the vital role in increasing the percentage of SOC. The highest grain yield is in T4-50% Inorganic fertilizers + T4-50% Organic fertilizers (3.67 t/acre) in compared to T1: 100% Inorganic fertilizers (1.69). This is due to the chelating nature of amino acids and organic acids in Protein-lacto-gluconate formulations in organic fertilizers increased the bioavailability of the available nutrients in the inorganic fertilizers to the crop. Hence Grain yield was increased along with the increased ratio of organic fertilizers.
References
[1] Addelman, Sidney (Oct. 1969): "The Generalized Randomized Block Design". The American Statistician 23 (4): p.35–36
[2] Ashmead, H. DeWayne (1986): Foliar Feeding of Plants with Amino Acid Chelates. Park Ridge, New jersey USA: Noyes Publications:S662.5-F65
[3] Eleanor Milne (2008): "Soil organic carbon." In: Encyclopedia of Earth. Eds. Cutler J. Cleveland ,Washington, D.C.: Environmental Information
Coalition, National Council for Science and the Environment:p.1-2
[4] Goldstein A.H., Kogers R.D., Mead G.(1993): Mining by microbe.Biotechnol.11, p.1250-1254
[5] Hepperly, P., Seidel, R., Pimentel, D., Hanson, J., and D. Douds, Jr. (2007): “Organic farming enhances soil carbon and its benefits”. p.129-153
[6] Kim K.Y., Jordan D., McDonald G.A (1997): Solubilization of hydroxyapatite by enterobacter agglomerans, phosphate solubilizing bacteria and microbial activity in soil: Effect of carbon sources, Soil Biology Biochemistry 30, p.995-1003
[7] Kloepper, J. W. (1993): Plant growth-promoting rhizobacteria as biological control agents, p.255-274
[8] Nelson, D.W., and L.E. Sommers (1982): Total carbon, organic carbon, and organic matter: p.539– 580.
[9] Okada S.(1998): Lactic acid Bacteria for developing a clean environment. Biseibutsu (in Japanese) 4: p.56-70
[10] Smith P (2004): Soils as carbon sinks: the global context, Soil Use and Management 20: p.212-218.