N-Focus Basic User Guide
March 2011 Version 4.1.2
Table of Contents
N-Focus Overview...4 Configuration...5 Overview...5 PBX Information...5 Connections...7Connecting through a C-LAN card...7
Connecting through a data module...8
Connecting through SSH...8
Connecting through JTAPI...9
Reports...10
Grouping Reports...13
Triggers...16
Setting up web triggers...16
Playing a sound...18
Setting up web triggers...18
Options...18 Remote Servers...20 Database...21 Database History...21 Database Backup...23 Database Check/Repair...24
Database Size Management...25
Security...26
Managing Users and Groups...27
Adding a new user...27
Assigning individual permissions...28
Adding a new group...29
Assigning group permissions...30
Assigning users to groups...30
"Group-centric" interface...30 "User-centric" interface...31 Tabs Visibility...32 Holidays...33 SMTP Server...34 Advanced Options...35 Logged Users...36
Data gathering Statistics...36
Reports...37
Overview...37
Sorting reports...38
Navigation...39
Choosing Report Fields...39
Overview...41
The auto-refresh window...41
Triggers...43
Charts ...44
System Status Report...45
Split and Skill Status Reports...46
VDN Status Report...48
Trunk Groups Status Report...49
Split stats Report...50
Daily Activity Reports...51
Overview...51
Agent Daily Overview Report...51
Agent Login/Logout Historical Report...52
Split and Skill Daily Overview Report...53
VDN Daily Overview Report...55
Trunk Group Daily Overview Report...57
Historical Analysis Reports...58
Overview...58
Reporting on multiple ACDs...58
Drilling down reports...59
Report options...60
Exporting reports...62
Emailing reports...62
Mobile reports...66
Copyrights...68
Licenses for third party components used by N-Focus...68
N-Focus Overview
N-Focus is a web based analysis and reporting tool for the Avaya call center. It produces a wide range of real-time and historical reports, which provide powerful insight into the call center operations. Sortable along with drill down capabilities allows for a very easy to understand tool providing in-depth analysis of the call center. N-Focus allows managers to make informed, timely decisions that result in increased call center performance.
Configuration
Overview
To configure N-Focus, click on the Admin tab. The Configuration menu is mainly to define how to connect to the switch and what reports to get, and to manage user permissions. The Console menu is to monitor N-Focus usage, for example which users are logged into N-Focus.
Figure 1: the Admin tab We are now going to describe each option in more detail.
PBX Information
For each PBX you want to get data from, you need to define an entry in the list of PBXs. Click on PBX, then click on Add a PBX, as on Figure 2.
Figure 2: Adding a PBX entry
This will bring up a page like the one on Figure 3, where you define some general information about the PBX.
Figure 3: PBX General Information 1. If you turn off Active, N-Focus does not get data for that PBX. 2. Give a name which identifies this PBX inside N-Focus.
3. A tab is created to display the reports for each PBX. Give the name for this PBX tab. 4. You can add a description to document this entry.
5. Type the version of the software on the PBX.
6. Once N-Focus is connected, it displays the versions it found.
7. Checking the Dump data to 'cap' files option tells N-Focus to dump to files all data it gets from the switch. This is used to diagnostic problems only.
Connections
Once you have set the general information about the switch, you need to tell how to connect to the switch. This is done either through C-LAN cards or through data modules. For both, you first need to go to the Connections page:
1. Click on PBX.
2. Click on the Connections link for the PBX of your choice, like on Figure 4.
Figure 4: Connection link
The next screen will be the Connections page, like on Figure 5. The Inter-command delay is the number of milliseconds N-Focus is waiting after it finished getting a report from the PBX and before it requests a new report. If you connect to the PBX through C-LAN cards, you might want to adjust this value to speed up getting reports, but be careful not to overwhelm your PBX. The default value should fit most needs.
Figure 5: Connections
Connecting through a C-LAN card
Figure 6: Socket configuration 3. Click Submit.
Connecting through a data module
1. From the Connections page, Click on Add a COM port connection.
2. Type your user name, password, the port and dialing number of the data module (see Figure 7).
Figure 7: Socket configuration 3. Click Submit.
Connecting through SSH
1. From the Connections page, Click on Add a SSH connection.
2. Type your user name, password, IP address of the switch, the port to connect to, and the cipher (see Figure 8).
Figure 8: SSH configuration 3. Click Submit.
Connecting through JTAPI
If you have an Application Enablement Services (AES) server, you can use an EAS JTAPI connection to collect reason codes of agents in AUX mode, as well as collect agent login/logout data. The AUX reason codes are added to the real-time split reports. The agent login/logout data can be accessed from the historical agent login/logout reports.
To create an AES JTAPI connection:
1. From the Connections page, click on Add an AES JTAPI connection.
2. Type your user name, password, host (IP address) of an AES Server, and the port to connect to. The default port is 450.
3. Type the name of the Tlink you want to use. A Tlink is a TSAPI CTI link between the AES server and Communication Manager.
4. Choose the number of simultaneous JTAPI requests for agent AUX reason codes N-Focus is sending to the AES server. Adjust depending on the number of agents you have, and the refresh rate you want to achieve. Each environment behaving differently, the best is to experiment. You can use the Connection Stats page to measure the effect. Note that sending too many simultaneous requests might decrease performance.
5. Choose the delay between polling requests, in milliseconds. If sending JTAPI requests is having an impact too important on the CPU usage of the N-Focus server, you may want to add a delay between JTAPI requests. In most cases decreasing the number of simultaneous requests should be sufficient.
Figure 9: JTAPI configuration 7. Click Submit.
Reports
Once N-Focus is connected to the switch, you can choose which reports you want to get data for. 1. Click on PBX.
Figure 10: Commands configuration 3. Check all the commands you want reports for, then click Submit.
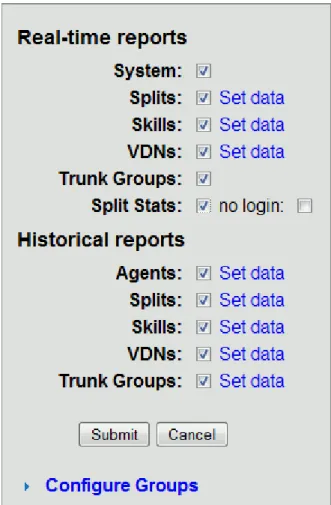
4. Now all the commands you checked are followed by a Set data link if they have more options. Click that link to set the options (see Figure 11 for the Historical agent report screen).
Figure 11: historical agent report configuration
5. N-Focus automatically gets a list of all available agents, splits or skills, VDNs, and trunk groups. Choose which ones you want to monitor.
6. Choose how often you want to update the data. If the pre-defined frequencies do not suit your needs, choose Other, then type the specific times to update the data (see Figure 12).
Figure 12: Setting times to update the data 7. Click Submit.
In case you already have the list of items you want to report on in a text file, you can click on 'Hide List', then copy/paste your list, one item per line, in the text area, as shown in Figure 13.
Figure 13: historical agent report configuration
Grouping Reports
Once you have chosen which reports you want, you can group them. For example, you can define a group of agents, and then, when you want a historical report on those agents, instead of selecting the agents, you select the group.
1. Click on PBX.
2. Click on Reports for the PBX of your choice. 3. Click on Configure Groups (see Figure 14).
Figure 14: Command groups 4. Click on Add a group.
5. Enter the name of the group. Optionally, enter the type and description. These latter two options are not used by N-Focus, and are intended only for documenting. See Figure 15.
Figure 15: Creating a new Command Group
6. Click Create. This brings you back to the screen depicted on Figure 14.
7. You can now edit this new group by clicking on Edit after its name (see Figure 16).
Figure 16: Editing a Command Group
Figure 17: Adding agents to a Command Group
Triggers
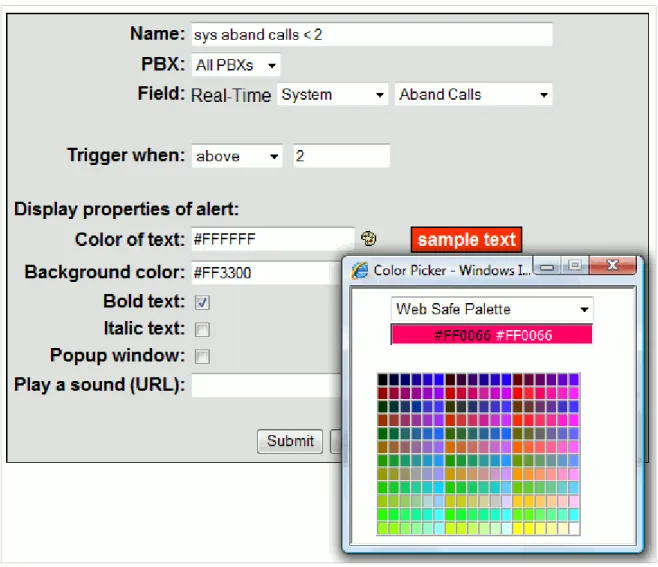
Triggers help locate problems in your call center by attracting your attention to these problems. You can define triggers for problem values on specific statistics, and when these statistics hit the values, the trigger runs the actions you have set for it. Two types of triggers are available: web and email triggers. Figure 18 shows a web trigger configured to fire when Aband Calls > 2, and to display these values with a red background. Email triggers send an email when the trigger threshold is crossed.
Figure 18: Trigger on Aband Calls
Setting up web triggers
1. Click on Triggers in the Admin configuration menu, or in a report page.
Figure 19: Editing triggers 2. Click on Add a web trigger (see Fig. 19).
3. Choose a name for the trigger, so that you can easily locate it (see Fig. 20).
4. If editing triggers from the Admin configuration, the Display user triggers option is available. This option enables to view the triggers defined in report pages.
Figure 20: Editing a web trigger 5. Choose which PBX this trigger is for.
6. Set Field to the report the trigger is for.
7. Set Trigger when to the condition which runs the trigger.
8. Color of text, Background color, Bold text and Italic text control what the field looks like when the trigger condition is met. Clicking on the palettes pops up a palette of colors to choose from.
9. Check Popup window if you want the window to get the focus when the trigger condition is first met.
Playing a sound
First create a sound file using your favorite audio recorder. Then, once you have the sound file, you have to make it available for download to N-Focus. Drop your sound file in folder <installation folder>/tomcatbase/webapps/niks/sounds. If, say, the file name is warning.wav, you can then reference it with the url /niks/sounds/warning.wav. If you have sound files available on a web server, you can use them with the syntax
http://<server>:<port>/pathToAudioFile.
If the sound does not play in the browser, make sure some audio plugin, like Quicktime or Windows Media Player, is installed in the browser. Some devices (mobile and handheld) may not play all audio file formats. Internet explorer should not need a plugin to play .wav files.
Setting up web triggers
1. Click on Triggers in the Admin configuration menu, or in a report page. 2. Click on Add an email trigger (see Fig. 19).
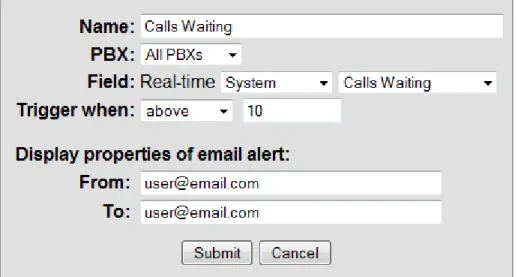
3. Choose a name for the trigger, so that you can easily locate it (see Fig. 21).
Figure 21: Editing an email trigger 4. Choose which PBX this trigger is for.
5. Set Field to the report the trigger is for.
6. Set Trigger when to the condition which runs the trigger.
7. Set the From (sender) and To (recipient) email addresses. The sender field is available only if no email address is configured for the current user.
Options
Some options can be controlled by the administrator: 1. Click on Options (see Figure 22).
Figure 22: Display options
2. Choose how often real-time popup windows can refresh at a minimum. Allowing real-time reports to refresh too often can hurt the server performance, especially when many users view auto-refresh reports simultaneously.
3. Session Timeout is the maximum number of minutes that can elapse while a session is idle before it is terminated. Choose the session timeout.
1. The current state in which agents are is displayed in the split and skill real-time reports. You can customize their foreground and background colors.
Remote Servers
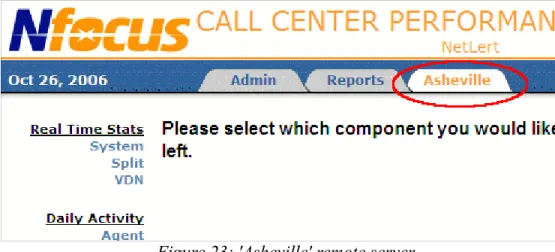
If you installed N-Focus on several sites, you can monitor the reports for all sites from within a single browser window. You need to define remote servers on one of the servers, and for each of those remote servers N-Focus adds a tab for their reports, like on Figure 23.
Figure 23: 'Asheville' remote server To add a remote server definition:
1. Click on Remote Servers on Admin Configuration page.
Figure 24: Editing remote servers
2. Click on Add configuration for a remote server (see Fig. 24).
3. The name of the remote server is only intended to identify the remote server (see Fig. 25).
4. The tab name is the text displayed in the tab.
5. Set the IP address of the computer hosting the remote N-Focus server. 6. Set the port used to access the server. By default N-Focus is using port 8080. 7. Choose one of the tabs available on the remote server.
Database
The database maintenance operations you can perform are listed on Figure 26:
Figure 26: Database
Enter a database administrator email address to receive an email when an error occurs during database maintenance, like backup, check/repair, or size management.
Database History
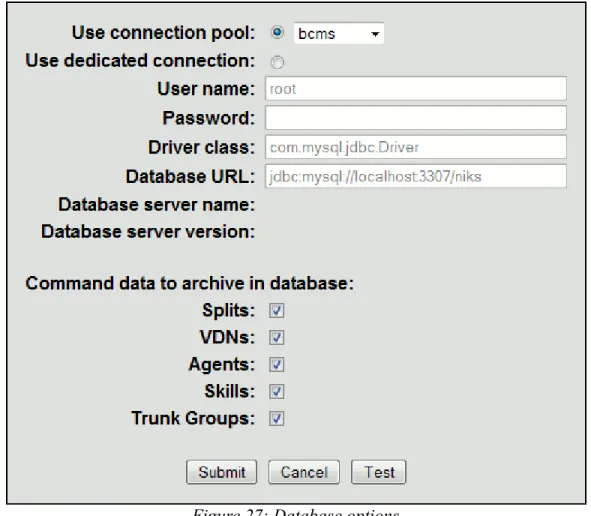
All the historical data N-Focus gets from the switch is stored in a database. When you install N-Focus, it installs a MySQL server, and by default N-Focus is configured to use that server. You can choose to use another database server.
Figure 27: Database options
2. There are two ways to define how to access the database. N-Focus can either use a connection pool, or a dedicated connection. See the chapter on connection pools for an explanation of both. From this page, you can also choose not to store some historical data in the database. By default, N-Focus stores all historical data it retrieves from the switch.
Database Backup
N-Focus can automatically backup the database on the server hard-disk at regular intervals. By default, it runs the backup procedure everyday at 1:00am, and puts the backup in the backup folder under the installation folder. To change these settings, or see the information on the latest backup, do the following:
1. Click on Database Backup from the Database menu entry in the Admin configuration menu.
Figure 28: Database backup options 2. Choose the frequency and time to run the backup.
3. You can change the folder where the backup is stored. If the path is relative, it is relative to the N-Focus installation folder.
4. This page displays the time the last backup was run, and the messages MySQL issued. 5. You can choose to run the backup immediately by clicking Run now!.
Please note that the backup is stored on the same hard-disk as the original database. You should then copy this backup to some backup system.
Database Check/Repair
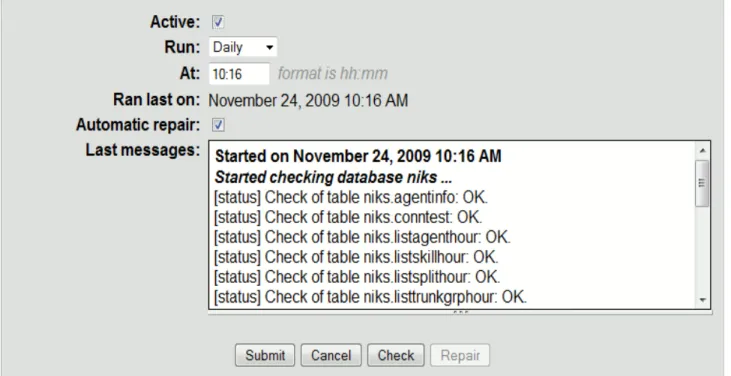
N-Focus can automatically check, and optionally repair if needed, the database at regular intervals. By default, it runs the check procedure everyday at 2:00am. To change these settings, or see the information on the latest check, do the following:
1. Click on Database Check/Repair from the Database menu entry in the Admin
configuration menu.
Figure 29: Database check/repair options 2. Choose the frequency and time to run the check.
3. You can choose to automatically repair in case the database is corrupted.
4. This page displays the time the last check was run, and the messages MySQL issued. 5. You can choose to check the database immediately by clicking the check button.
6. If the database is corrupted the repair button is enabled. You can repair the database by clicking it.
Database Size Management
N-Focus can automatically run at regular intervals the database size management procedure, which deletes the old data from the database. By default, it runs the size management procedure everyday at 3:00am. To change these settings, or see the information on the latest size management, do the following:
1. Click on Database Size Management from the Database menu entry in the Admin
configuration menu.
Figure 30: Database size management options 2. Choose the frequency and time to run the size management.
3. Choose what data should be deleted. Leave the data fields blank to keep all data. Note that 0 is interpreted like a blank field
4. You can choose to automatically optimize. When the old data are deleted from the database, the data file unused space is reclaimed and the data file is defragmented.
5. This page displays the time the last size management was run, and the messages MySQL issued. 6. You can choose to run the size management immediately by clicking Run now!.
Security
To change the security options, click on Security in the menu, which displays a page like on Figure 31. From there you manage users, groups of users, and assign permissions to them.
Figure 31: Security options
You can choose what type of authentication is performed. The choices are:
• File based: users have to provide their assigned name and password. These are checked against a list of valid logins stored in a file on the server. This is the default.
• Database: if you already have a database of users, you can use it to authenticate users. N-Focus will read from, but not write to, this database.
You can allow N-Focus to remember passwords. If Enable 'Remember login' option is selected, N-Focus will display the Remember login box on the login page (see Figure 32). If the box is checked, then N-Focus remembers the login information until the provided login expiration time in days, or the user logs off.
Figure 32: Login
You can define the list of users and groups of users, each having a set of permissions, and which tabs require a permission to be viewed.
Managing Users and Groups
It is sometimes desirable to allow only certain members of an organization to view portions of the data gathered by N-Focus. Allowing certain viewers to see data while excluding others from seeing this same data is accomplished by creating users and assigning them permissions detailing the types of information to which they are privy. If multiple users will be permitted to view the same data, users may be grouped, with permissions for that data assigned on a "per group" basis rather than a "per user" basis. This can save time during configuration by alleviating some of the repetitiveness involved in assigning multiple users with similar access credentials. Individual and group permissions may be used together, thus giving complete flexibility to the N-Focus administrator to establish the user set exactly as the organization's requirements demand.
Adding a new user
1. From the Security page, click on Edit users (see Figure 31).
Figure 33: Managing users
2. Click the Create a new user link (see Figure 33). This will bring the Create User
page.
3. Enter the user name, password, password confirmation (See Figure 34). Providing an email will enable N-Focus to set the sender for reports emailed by this user.
selecting Change password in the reports menu (see Figure 35). 5. Then, click the Submit button.
6. The new user's login name should now appear in the list of users. This user must now be assigned individual permissions or admitted to a group in order to have access to reports.
Figure 35: User changing password
Assigning individual permissions
1. From the Security page, click on Edit users, then on Edit permissions, which brings a page as on Figure 36.
Figure 36: User permissions
2. Either choose which permission to add from the drop-down list and click Add, or click the
Edit link for the permission you want to edit.
then click Add permission or Save Changes (depending on whether you are adding a new permission or editing an existing one).
Figure 37: Agent Report permission
Adding a new group
1. From the Security page, click on Edit groups (see Figure 31).
Figure 38: Managing groups
Figure 39: Editing a group
4. If Can change password is selected, members of the group can change their own password by selecting Change password in the reports page menu (see Figure 35 on page 28).
5. The new group should now appear in the list of groups.
Assigning group permissions
This works the same way as assigning permissions to users. You reach the page for editing group permission by clicking on the links Security, then Edit groups, then Edit permissions. From there, do as for users.
Assigning users to groups
This task may be accomplished in 2 different ways, each providing the same results. The dual options exist only for flexibility. Users may be added to a permissions group through either a "group-centric" interface or through a "user-centric" interface.
"Group-centric" interface
From the Security page, click on Edit groups, then on Edit users. From there, check which users you want in the group (see Figure 40).
Figure 40: Editing group users
"User-centric" interface
From the Security page, click on Edit users, then on Edit groups. From there, check which groups you want the user to belong to (see figure 41).
Figure 41: Editing user groups
As shown, complete flexibility is given to the N-Focus administrator for assigning user permissions and checking authentication. Individual users may be assigned to a group (or multiple groups) for
Tabs Visibility
You can control which tabs each users can view:
1. From the Security page, click on Edit tabs visibility (see Figure 31).
Figure 42: Tabs visibility
2. Check which tabs require a permission to be viewed (see Figure 42). Please note that the
Admin and Advanced tabs can be viewed only by users with Admin permission.
Now you need to assign tab permissions to all users or groups allowed to view the tabs requiring permissions. To assign to a user:
1. From the Security page, click on Edit users, then the name of the user to edit, then
Edit permissions. 2. Add a Tab permission.
3. Check which tabs the user is allowed to view (see Figure 43).
Holidays
You can define which days should be considered holidays for your organization. Then, when you print a historical report, you can choose to exclude holidays from the report.
Figure 44: Holidays configuration 1. Click on Holidays in the Admin configuration menu.
2. The screen now displays the holidays defined for the current year. If you want to view the holidays for another year, either type the year in the Go field and then click on Go button, or use the Previous and Next links denoted with arrows.
3. There are two types of dates: if the year is defined, then the holiday is specific to that year, while if the year is omitted, then the holiday is understood to be for all years (so that you have to type it only once).
SMTP Server
The SMTP server is the address of the server handling your outgoing mail. You need to set it if you want to use the email feature in reports.
1. Click on SMTP Server on Admin Configuration page.
Figure 45: SMTP Server configuration 2. Enter the IP address of your SMTP server.
3. Enter the port number of your SMTP server (leave it blank for default port of 25). 4. Enter the login information to use if the SMTP server requires to authenticate.
Advanced Options
This feature is used by NetLert support.Logged Users
N-Focus provides a screen displaying all N-Focus users (see Figure 46) which are logged in. Bear in mind that if the browser is closed without logging out, the web session stays alive until it times out. The default time-out is 30 minutes.
Figure 46: List of logged N-Focus users To view the list of logged users:
1. Click on Logged Users in the Admin configuration menu.
Data gathering Statistics
N-Focus provides a few statistics on how much time it takes to get data from the switch. For each report, it lists the average, minimum and maximum time it took to get data for that report (see Figure 69). These numbers can help you decide on a balance of which reports to monitor and how fast they are going to be refreshed.
Figure 47: Data gathering statistics To view the statistics:
Reports
Overview
All the reports are under the reports tabs, displayed in Figure 48. Reports are grouped by category: • Real-Time Stats: These reports provide current status and cumulative measurement data. They
correspond to the 'monitor' commands on the switch. They can be opened in an auto-refresh popup window for all-day monitoring.
• Daily Activity: These reports provide information for the last 24 intervals of time, an interval of time being an half-hour or an hour depending on how the switch is configured. They correspond to the 'list bcms' commands.
• Historical Analysis: These reports are intended to analyze daily activity data in the past. They provide features which help find and use information like drill-down, exporting to PDF or Excel, and emailing.
• Settings: This section groups pages to change the current user settings, like the Scheduled
Figure 48: N-Focus reports
Sorting reports
Reports can be sorted on any column. Clicking on the header of a column sorts on that column in ascending order, and displays a double-arrow with the up arrow highlighted. Clicking again on the column header reverses the order (see Figure 49).
Navigation
Some reports include hyperlinks to easily navigate from one report to another related one. For example, in the real-time System Status report, clicking on the name of a split or skill switches to the page for that split or skill real-time Status report. The available hyperlinks are:
In System Status, from split or skill name to the split or skill Status report.
In Split or Skill Status, from the split or skill name to the split or skill Daily Activity report. In Split or Skill Status, from an agent name to that agent Daily Activity report.
In VDN Status, from the VDN name to that VDN Daily Activity report.
In Trunk Group Status, from a trunk group number to that trunk group Daily Activity report. In Historical Analysis reports, from the Time column for monthly and weekly reports to the
daily report for the agent (split, ...) on that row, and from the Time column for daily reports to the hourly report for the agent (split, ...) on that row. See Drilling down reports for more details.
Choosing Report Fields
All reports enable to choose which fields to display: 1. Click Choose Fields button (see Figure 50)
Figure 51: Choose Fields button
Custom Reports
Once a report fits your needs, you can save its properties, like the selection of fields, the field used to sort the report, and others, as a custom report (see Figure 52).
Figure 52: Saving as a custom report
There is the option to remember the selection, which will remember the selected items of each report. If the current user has administrator privileges, then there is an option to make that report available to all users. If not, the custom report is private to the current user. The custom report can now be selected in the page used to select which items to report on (see Figure 53):
Figure 53: Selecting a custom report
Clicking 'Set As Default' will make the selected custom report the default report on that page. A custom report can be modified or deleted by selecting the custom report, changing the properties if needed, and in the report page, choosing the appropriate action (see Figure 54):
Figure 54: Modifying a custom report
Choosing 'Save As...' creates a new custom report, leaving the current custom report unchanged.
Real-Time Reports
Overview
The real-time reports provide current status and cumulative measurement data. They display ever-changing information, and to help you monitor the changes, N-Focus provides an auto-refresh window and triggers.
Figure 55: Auto-refresh window The content is configurable to fit your needs. To do so:
Figure 56: Auto-refresh window options
2. You can set Rows per page to limit the number of rows displayed. If there are more rows, the window will go through them in sequence. For example, with the configuration on Figure 56, only 4 rows are displayed at a time, like shown on Figure 55.
3. By default, the window refreshes every five seconds. Be aware that a high refresh rate might burden the server if there are many auto-refresh windows opened.
4. The title can be displayed either at the top or bottom of the window.
5. The headers contain data on top of the rows. If you are not interested in that data, you can hide it by unchecking Display headers.
6. You can change the font sizes to fit your needs. For example, if you want to display the popup window on a wide screen in readerboard style, you can change the font so that it can be read from far.
Triggers
Charts
All real-time reports can be viewed either as a table or as a chart. To view as a chart:
1. Choose the type of report you want from the menu, then click the Choose Fields button (see Figure 50) .
2. Choose the graph type, and select the fields to report on (see Figure 57).
Figure 57: Choosing fields for a real-time graph report
3. Click report to generate a chart (a bar graph in Figure 58, a pie chart in Figure 59, and a time series in Figure 60).
Figure 59: Real-time pie chart
Header Definition
Split name The name of the split.
Num The split number.
Calls Waiting The number of calls in the split queue that are currently waiting to be answered and calls ringing at an agent telephone.
Oldest Call The number of minutes and seconds the oldest call in queue has been waiting to be answered.
Avg Speed Answer The average amount of time it takes before the calls are answered by agents. Avail Agents The number of agents in this split who are currently available to receive an ACD call directed to this split. Aband Calls The total number of ACD callers that have hung up while waiting to be answered. Avg Aband Time The average time before an ACD call abandons.
Acd Calls The number of ACD calls completed during the current interval. Avg Talk Time The average duration of ACD calls for each split.
Avg After Call The average ACW time for call-related ACW time completed by agents in this split during this time interval.
% In Svc Lvl The percentage of calls answered within the administered service level for this split.
Table 1: System Status report headers
Split and Skill Status Reports
The Split and Skill Status reports provide the current status and cumulative measurement data for those agents assigned to the split or skill. The fields for the Split Status report are described in Table 2. Those for the Skill Status report are similar. Please see your BCMS manual for more details.
Header Definition
Split name The name of the split.
Num The split number.
Calls Waiting The number of calls currently queued and calls ringing at an agent telephone.
Oldest Call The number of minutes and seconds that the oldest call in queue has been waiting to be answered.
Acceptable Service Level
The desired time for an agent to answer a call for a given hunt group or VDN.
% In Svc Lvl The percentage of calls answered within the administered service level. Aband Calls The total number of ACD callers that have hung up while waiting to be answered. Staffed The number of agents currently logged into the split.
Avail The number of agents in this split or skill currently available to receive an ACD call.
ACD The number of agents who are currently on an ACD call for this split.
ACW The number of agents in this split who are currently in ACW mode for this split. AUX The number of agents in this split who are currently in the AUX work mode for this split. Extn Calls The number of agents in this split who are currently on non-ACD calls.
Other
The number of agents in this split who: • Are on a call from another split
• Are in ACW work mode for another split
• Have placed a call on HOLD and made no other state selections • Have a call ringing at their telephones
Ext The extension number for the age. State The current work state for the agent.
Elapsed Time The amount of time the agent has been in the current work state.
Reason The reason associated with the auxiliary work state of this agent. (Only available with AES JTAPI connection)
Acd Calls The number of ACD calls that the agent has completed since the beginning of the current interval.
Extn In Calls The number of non-ACD calls that the agent has received since the beginning of the current interval. Extn Out Calls The number of non-ACD calls that the agent has made since the beginning of the current interval.
Table 2: Split Status report headers
VDN Status Report
The VDN status report gives real-time status information for internally measured VDNs. Table 3 describes the fields. Please see your BCMS manual for more details.
Header Definition
VDN name The name of the VDN.
Ext The extension of the VDN.
Calls Waiting The number of calls that encountered this VDN and have not been answered, abandoned, outflowed, or forced busy/disc.
Oldest Call The time the oldest call currently waiting has waited in the VDN.
Acd Calls The number of completed ACD calls answered in a BCMS-measured split. Avg Speed Answer The average speed of answer for ACD and connect calls that have completed
for this VDN during the current period.
Aband Calls The number of calls to this VDN that have abandoned before being answered during the current period. Avg Aband Time The average time abandoned calls waited before abandoning during the current period. Avg Talk/Hold
Time
The average talk time for ACD calls completed by this VDN during the current period.
Conn Calls The number of completed calls that were routed to a telephone, attendant, announcement, messaging split, or call pickup and were answered there. Flow Out The number of calls that were routed to another VDN or to a trunk, including successful look-ahead attempts. Calls Busy / Disc The number of calls that were forced busy or forced disconnect during the current interval. % In Svc Lvl The percent of calls offered that completed and were answered within the
acceptable service level.
Table 3: VDN Status report headers
Header Definition
Group The trunk group number.
Group Size The number of members administered for each trunk. Active Members The number of members in a group that are active on a call. Queue Length The length of the queue administered for a group.
Calls Waiting The number of calls waiting in the group queue to be serviced. Table 4: Trunk Groups Status report headers
Split stats Report
The Split stats report provides a few status measurements for splits or skills. One of the advantages of this report is the option to view it without logging in. Please refer to Reports (Page number 10) to enable the Split stats reports, and the option to view it without logging in.
Daily Activity Reports
Overview
Daily Activity reports provide information for the last 24 intervals of time, an interval of time being an half-hour or an hour depending on how the switch is configured.
Agent Daily Overview Report
The agent report provides traffic information for the specified agent. Table 5 describes the fields of the report. Please see you BCMS manual for more details.
Header Definition
Agent The agent number.
Agent name The name of the agent.
From/To The time range of the report.
Time The time interval.
Acd Calls The number of ACD calls answered by this agent for all splits during the reporting interval.
Avg Talk Time The average duration of ACD calls for all splits the agent was logged into. Total After Call
Time
The total amount of time that the agent spent in call-related or non-call-related ACW work states for all splits during the reporting interval.
Total Avail Time The sum of the time that the agent was available to receive ACD calls during the reporting interval. Total Aux/Other The total time that this agent was unavailable to receive calls in any split during the reporting interval. Extn Calls The total number of non-ACD incoming and outgoing calls for this agent
during the reporting interval.
Avg Extn Time The average amount of time that the agent spent on non-ACD calls while logged into at least one split during the reporting interval. Total Time Staffed The total time that the agent spent logged into at least one split during the reporting interval. Total Hold Time The total time that the agent placed ACD calls on hold.
Table 5: Agent Daily Overview report headers
Agent Login/Logout Historical Report
The agent Login/Logout historical report shows the times that agents in a given skill logged in and logged out, the reason codes associated with the logout (if there is one), and the skills with which the agents logged in and out. Table 6 describes the fields of the report. Only available with AES JTAPI connection.
Skill number The split number. Skill name The name of the split.
From/To The login time range of the report. Agent name The name of the agent.
Login Id The login id of the agent.
Extn The extension where the agent logged in.
Login Time The time that the agent logged in with the given set of skills. Logout Time The time that the agent logged out from the given set of skills. Logout
Reason
The reason for logout.
Table 6: Agent Login/Logout Historical report headers
Split and Skill Daily Overview Report
The Split and Skill Daily Overview reports provide traffic information for the specified split or skill number. Table 7 describes the fields of the Split Daily Overview report. The Skill Daily Overview report has similar fields. Please see you BCMS manual for more details.
Header Definition
Split The split number.
Split name The name of the split.
From/To The time range of the report.
Acceptable Service
Level The desired time for an agent to answer a call for a given hunt group.
Time The time interval.
Acd Calls The number of ACD calls completed for this split during the current interval. Avg Speed Answer The average amount of time answered ACD calls spent in queue and ringing
at an agent telephone before being answered during the reporting interval. Aband Calls The total number of ACD calls that have hung up while waiting to be answered during this time interval. Avg Aband Time The average time before an ACD call abandons.
Avg Talk Time The average amount of time agents are active on ACD calls for each split. Total After Call
Time
The amount of time that the agents in this split spent in call-related or noncall-related ACW mode during the reporting interval.
Flow In
The total number of completed calls that this split received as a coverage point (intraflowed) from another BCMS-measured split, or are call forwarded (interflowed) to this split and completed during the reporting interval.
Flow Out
The total number of calls queued to this split that were:
• Successfully sent to the split coverage point after queuing for the specified don’t answer interval.
• Forwarded-out via call forwarding.
• Forwarded-out via a route-to extension vector step. • Answered via the Call Pickup feature.
• Forwarded-out via Look Ahead Interflow.
• First queued to this split and were answered by the second or third split.
• Redirected back to this split or its coverage path due to Redirect On No Answer timing.
Total Aux/Other The total time that logged-in agents in this split were unavailable to receive calls during the reporting interval.
Avg Staff The average number of agents who were logged into this split during the reporting interval. % In Svc Lvl The percentage of calls answered within the administered service level.
Table 7: Split Daily Overview report headers
VDN Daily Overview Report
The VDN Daily Overview report provides statistical information for the specified VDN. Table 8 describes the fields of the report. Please see you BCMS manual for more details.
Header Definition
VDN The VDN number.
VDN name The name of the VDN.
From/To The time range of the report.
Acceptable Service
Level The desired time to answer calls to the VDN.
Time The time interval.
Calls Offered The total number of completed calls that accessed the VDN during the current interval.
Acd Calls The total number of calls to the VDN that ended in the specified interval and were answered by an agent in a BCMS-measured hunt group. Avg Speed Answer The average speed of answer for answered ACD and CONNect calls that have ended for this VDN during the current period. Aband Calls The total number of calls that have abandoned from the VDN before being
answered or outflowed to another position during the current interval.
Avg Aband Time The average time calls spent waiting in this VDN before being abandoned by the caller during the current interval. Avg Talk/Hold
Time The average duration of calls for this VDN during the current interval.
Conn Calls The number of completed calls that were routed to a telephone, attendant, announcement, messaging split, or call pickup and were answered there. Flow Out The total number of completed calls that were routed to another VDN or to a
trunk, including successful lookahead attempts.
Call Busy / Disc The total number of calls that were forced busy or forced disconnect during the current interval. % In Svc Lvl The percentage of calls that were answered with the administered service level for this VDN.
Trunk Group Daily Overview Report
The Trunk Group Daily Overview report gives statistical information for all BCMS measured trunk groups. Table 9 describes the fields of the report. Please see your BCMS manual for more details.
Header Definition
Trunk Group The trunk group number Trunk group name The name of the trunk group.
From/To The time range of the report.
Number of Trunks The number of individual trunks in the trunk group at the end of the first interval being reported..
Time The time interval.
Incoming Calls The total number of incoming calls carried by this trunk group. Incoming Aband
The number of incoming calls that queued to ACD splits, then abandoned without being answered by a staffed agent within this split during the reporting interval.
Incoming Time The average holding time for incoming calls to this trunk group during the specified reporting interval.
Incoming CCS The total holding time for incoming calls to the trunk group during the specified reporting interval. Outgoing Calls The total number of outgoing calls for this trunk group during the specified reporting interval. Outgoing Comp The total number of outgoing calls that were placed over this trunk group
and answered during the specified reporting interval.
Outgoing Time The average holding time for outgoing calls during the specified reporting interval. Outgoing CCS The total holding time for outgoing calls from this trunk group.
Historical Analysis Reports
Overview
Historical Analysis reports are intended to analyze daily activity data in the past. They provide features which helps find and use information, like drill-down, exporting to PDF or Excel, and emailing. The following paragraphs describe these features in more detail.
The following instructions are using agent reports as an example. It works just the same for the other types of reports.
Reporting on multiple ACDs
If you need to report on multiple ACDs, on the page to select which items to report on, click on the 'Report Options' button, and select the ACDs you want to report on (see Figure 62).
Figure 62: Multiple-ACD selection
Figure 63: Multiple-ACD report
Drilling down reports
Figure 64 shows the first page of options for an Agent Historical Analysis report. That page displays an agent report for the previous work day. Clicking on the number or name of an agent displays the report for that agent for that day.
Figure 64: Drilling down from the first page of options
By default that agent report is sorted on Acd Calls in reverse order. You can sort on any column to find which agent you want to drill down on.
Figure 65: Monthly report
Clicking on the Time column in the row for agent number 4244 brings the page as shown on Figure 66. The server having been started on January 5th 2006 and the command being run on the 26th of the same month, the report shows all data available for each day of that month. Clicking on one of the dates would bring a hourly report with the data for that day.
Figure 66: Daily report for agent 4244
Report options
If you want a report other than a default report for the previous work day, you need to set the options for the report:
1. Click on Agents under Historical Analysis.
like on Figure 67.
Figure 67: Second page of options 3. Set the range of time to report on.
4. Choose if each row of the report should display numbers for an hour (or half-hour if the switch is configured for half-hours), a day, a week or a month.
5. Choose if you want the report displayed as a table of rows, or as a bar graph. The bar graph is available only if a single agent is selected.
6. Choose if you want rows with the same date and/or time to be grouped. If so, there is only one row per date and or time.
7. You can exclude week-ends and holidays (as defined in Admin/Holidays tab) from the report.
8. You can filter the report by choosing a certain time range for each day, selecting days of the week and days of the month.
9. Click Choose Fields. This brings up a new option page, as in Figure 68. Click Report to display the report, as on Figure 69.
11. Click Submit, this displays the report, as on Figure 69.
Figure 69: Agent historical report
Exporting reports
Historical Analysis reports can be exported to PDF or Excel files. Selecting an option from the
Export menu will open a Save as dialog box prompting you for the name of the file.
Emailing reports
Historical Analysis reports can be emailed, either immediately, at some time, or at regular intervals. To email a report, from the report page:
1. Create a report with the options you want.
2. From that report page, click on Email Report. This displays a popup window like on Figure 70.
Figure 70: Editing a report email configuration
3. From contains the sender's email address, and To the recipient's email address. If the email of the current user has been set by the administrator, then that email is used as the sender, and the
From line is not displayed.
4. Choose which format to send, PDF or Excel.
5. Choose when to send the report: Now, Once, Daily, Weekly or Monthly. For each of these options, set the details of the time the report should be sent.
6. Choose a name identifying the report.
7. If you chose Now, Once or Daily, set the time to report on.
Figure 71: Scheduled tasks
2. The Status column indicates when the task last ran, and the Message column contains more information about the status, when available. For example it could contain an error message telling why an email could not be sent.
Editing email tasks
1. In the menu, click on Scheduled Tasks. This displays a page like on Figure 71.
2. Click Edit, which brings a page similar to the one you get from the report page, as shown on Figure 70. It has an additional button, Run now, to send the message immediately. If the email was configured to be sent once, running it immediately removes that task from the list of tasks. The Next button, which brings a page as shown on Figure 72, enables to edit the selection.
Figure 72: Editing an email task selection
3. After editing the selection click Run now, to send the message immediately, Submit to save the changes. Click Next to change more report options, which brings the page as shown on Figure 73.
Figure 73: Editing an email task options
4. After editing the options click Run now, to send the message immediately, Submit to save the changes. Click Next to change the selection of fields, which brings the page as shown on Figure 74.
Figure 74: Editing an email task field selection
5. After editing the fields click Run now, to send the message immediately, Submit to save the changes. Click Next to change the sort options, which brings the page as shown on Figure 75.
Mobile reports
The real time System report and Split report can be accessed from mobile devices. To access the real time reports.
1. Go to http://nfocusserver:8080/niks/do/bcms/mobile/logon from a mobile device browser. 2. Once successfully logged in, select the appropriate report to view (see Fig 76).
Figure 76: Mobile reports
3. Choose the report to view and select the splits, row per page and the fields to be displayed on the reports and click submit. The report with the selected option will be displayed (see Fig 77).
Copyrights
N-Focus is a product of NetLert Communications, Inc. ©2000, NetLert®. All Rights Reserved.
Licenses for third party components used by N-Focus
This product includes software developed by Sun Microsystems Inc. (http://java.sun.com): Java Virtual Machine (JVM) license, and third party license.This product includes software developed by the Apache Software Foundation (http://www.apache.org/).
This product includes software developed by the OpenSymphony Group (http://www.opensymphony.com/).
Avaya and BCMS are registered trademarks of Avaya Inc. N-Focus is using the following open-source projects:
• Jakarta :
• Tomcat: web server
website: http://tomcat.apache.org/index.html
license: Apache 2.0 license.
• JSP Standard Template Library (JSTL): standard tag library for jsp pages. website: http://tomcat.apache.org/taglibs/
license: Apache 2.0 license. • Struts:
website: http://struts.apache.org/
license: Apache 1.1 license. • Codec:
website: http://commons.apache.org/codec/
license: Apache 2.0 license. • HttpClient: http connections.
website: http://hc.apache.org/httpcomponents-client/httpclient/index.html
license: Apache 2.0 license. • commons-lang: date formatting.
website: http://commons.apache.org/lang/
license: Apache 2.0 license. • JasperReports :
• JasperReports: report generator.
website: http://jasperforge.org/projects/jasperreports
license: LGPL v3.
• Jakarta commons-beanutils:
website: http://commons.apache.org/beanutils/
website: http://commons.apache.org/collections/
license: Apache 2.0 license. • Jakarta commons-digester:
website: http://commons.apache.org/digester/
license: Apache 2.0 license. • Jakarta commons-logging:
website: http://commons.apache.org/logging/
license: Apache 2.0 license. • Jakarta commons-logging-api:
website: http://commons.apache.org/logging/
license: Apache 2.0 license. • Jakarta POI: XLS writer.
website: http://poi.apache.org/index.html
license: Apache 2.0 license. • itext: PDF writer.
iText Library - Copyright (C) 1999-2005 by Bruno Lowagie and Paulo Soares. All Rights Reserved.
website: http://www.lowagie.com/iText
license: MPL
• jdt-compiler: Java compiler. website: http://www.eclipse.org
license: CPL-v10. • Bitstream Vera Font:
website: http://www.gnome.org/fonts/
license: Bitstream Vera Fonts Copyright
• MySQL: database and JDBC driver. website: http://dev.mysql.com/
license: license agreement for commercial use. • Sitemesh: web page layout.
website: http://www.opensymphony.com/sitemesh/
license: OpenSymphony 1.1 License. • Dojo: Javascrip toolkit.
website: http://dojotoolkit.org/
license: Modified BSD license. • jQuery: Javascrip toolkit.
website: http://jquery.org/
license: jQuery licenses. • amCharts: Charts.
website: http://amcharts.com/
Index
Alphabetical Index
Aband Calls...46p., 49, 54, 56 Acceptable Service Level...47, 54, 56
ACD...47
Acd Calls...46, 48p., 52, 54, 56 Active Members...50
ACW...47
Add a COM port connection...8
Add a group...13
Add a PBX...5
Add a SSH connection...8
Add a TCP/IP connection...7
Add a web trigger...16
Add an AES JTAPI connection...9
Add an email trigger...18
Add configuration for a remote server...20
Add permission ...29
Adding a new group...29
Adding a new user...27
Advanced Options...35
Agent...52
Agent Daily Overview Report...51
Agent Login/Logout Historical Report...52
Agent name...47, 52 Assigning group permissions...30
Assigning individual permissions...28
Assigning users to groups...30
automatically optimize...25
automatically repair...24
AUX...47
Avail...47
Avail Agents...46
Avg Aband Time...46, 49, 54, 56 Avg After Call...46
Avg Extn Time...52
Avg Speed Answer...46, 49, 54, 56 Avg Staff...55
Avg Talk Time...46, 52, 54 Avg Talk/Hold Time...49, 56 Call Busy / Disc...56
Calls Busy / Disc...49
Change password...28
Charts...44
Choosing Report Fields...39
Configuration ...5
Configure Groups ...13
Conn Calls...49, 56 Connection Stats...36
Connections...8p. Connections ...7
Create a new group...29
Create Group...29
Custom Reports...40
Daily Activity...37
Daily Activity Reports...51
Data gathering Statistics...36
Data History ...21
Database...21
Database Backup...23
Database Check/Repair...24
Database History...21
Database Size Management...25
Drilling down reports...59
Dump data to 'cap' files...6
Edit permissions...28
Edit tabs visibility ...32
Edit users...28
Editing email tasks...64
Elapsed Time...48 Email Report...62 Emailing reports...62 Export...62 Exporting reports...62 Ext...48p. Extn Calls...47, 52 Extn In Calls...48
Extn Out Calls...48
Figure 26: Database...21
Figure 48: N-Focus reports...38
File based...26
Incoming Calls...57
Incoming CCS...57
Incoming Time...57
Logged Users...36
login expiration time...26
Login Id...47
Mobile reports...66
N-Focus...4
Navigation...39
Number of Trunks...57
Oldest Cal...46
Oldest Call...46p., 49 Options...18 Other...47 Outgoing Calls...57 Outgoing CCS...57 Outgoing Comp...57 Outgoing Time...57 PBX...5 PBX Information...5
Playing a sound...18
Queue Length...50 Real-Time Reports...41 Real-Time Stats...37 Reason...48 Remember ...26 Remember login...26
Remote Servers ...20
Report options...60
Reporting on multiple ACDs...58
Reports...37, 50 Reports ...10
Scheduled Tasks...63p. Security...26
Session Timeout...19
Setting up web triggers...16, 18 SMTP Server...34
Sorting reports...38
Split...54
Split and Skill Daily Overview Report...53
Split and Skill Status Reports...46
Split name...46p., 54 Split stats Report...50
Staffed...47
State...48
Total After Call Time...52, 54 Total Aux/Other...52, 55
Total Avail Time...52
Total Hold Time...52
Total Time Staffed...52
Triggers...16, 43 Trunk Group...57
Trunk Group Daily Overview Report...57
Trunk group name...57
Trunk Groups Status Report...49
VDN...56
VDN Daily Overview Report...55
VDN name...49, 56 VDN Status Report...48
"Group-centric" interface...30
"User-centric" interface...31
% All Busy...57
% In Svc Lvl...46p., 49, 55p. % Time Maint...57