Please cite this article as: A. Sadri Esfahani, M.B. Fakhrzad, Outsourcing through Three-dimensional Competition, International Journal of Engineering (IJE), TRANSACTIONS C: Aspects Vol. 27, No. 12, (December 2014) 1863-1871
International Journal of Engineering
J o u r n a l H o m e p a g e : w w w . i j e . i rOutsourcing through Three-dimensional Competition
A. Sadri Esfahani, M. B. Fakhrzad*
Department of Industrial Engineering, Faculty of Engineering, Yazd University, Yazd, Iran
P A P E R I N F O
Paper history:
Received 12 January 2014
Received in revised form 12 July 2014 Accepted 14August 2014
Keywords: Supply Chain Competition Outsourcing
A B S T R A C T
In this paper, we study an outsourced supply chain consisting of one buyer and two suppliers in which the buyer outsources manufacturing of a physical product to two competing suppliers. The suppliers compete for the buyers' demands share, and the buyer allocates the demands to the competing suppliers based on three-dimensional allocation functions. We consider two certain types of allocation functions which depend on price, service level and product quality level. They include the exponential allocation function and the Cobb-Douglas allocation function. A three-stage game-theoretic framework is presented to derive the equilibrium values. Since the problem lacks a closed-form solution, numerical studies are conducted over a wide range of some key parameters.
doi: 10.5829/idosi.ije.2014.27.12c.09
1. INTRODUCTION1
A supply chain consists of suppliers, manufacturers, distributors, retailers and end customers, cooperating to meet the customers' needs. Over the past several decades, outsourcing of inputs has become a major business phenomenon in industries and has played an essential role in supply chains [1-3]. Outsourcing can be stated as “the allocation of business activities from a source internal to a source outside of the organization” [4]. The main aim of outsourcing is to achieve lower costs and higher operational efficiency rates. In fact, nowadays, in order to make supply chains more effective, outsourcing cannot be ignored [3]. In decision making about outsourcing, buyers often consider a multiple sourcing strategy. In other words, the buyers encounter competing suppliers. In general, competition, as a useful mechanism, can improve the suppliers’ performance from the buyer's viewpoint.
In this paper, we consider a dual-sourcing problem faced by a buyer who commits to outsource the manufacturing of a given product to two selected suppliers. In our proposed model, the buyer allocates demand to the suppliers using a three-dimensional
1*Corresponding Author’s Email: [email protected] (M.B. Fakhrzad)
allocation function. For this problem, we try to determine the behavior of the competing suppliers.
This paper is organized as follows. The next section presents a brief review of the related literature and underlines our contribution. Section 3 presents the model description including the model assumptions and formulation. Section 4 introduces a three-stage game-theoretic framework. Section 5 presents some computational results and a sensitivity analysis with respect to some parameters. Finally, section 6 concludes the paper and makes suggestions for future research.
2. LITERATURE REVIEW AND CONTRIBUTION
Stream of investigations treated various issues of outsourcing in competitive environments. The papers in this field can be divided into two categories. Some of them focus on the aspects of outsourcing decision making, while some others try to take into account the competition among suppliers for the demand share of a single buyer which outsources a production input. The main focus of the first-category study is on assessing the effectiveness of outsourcing and deciding about the rate of outsourcing. Cachon and harker [5], Dube et al. [6], Chang et al. [7], Ni et al. [8], Kumar et al. [9], McIvor [10] and Bae et al. [11] have focused on effectiveness of
outsourcing or outsourcing decision making. The manner in which the demand is allocated to the competing suppliers can be taken as exogenous or endogenous. In exogenous manner, the allocation parameters are taken as fixed and given, while in endogenous manner the allocation parameters are taken as decision variables. Companies are increasingly utilizing a range of criteria to evaluate the performance of their suppliers [12]. Some of the most commonly used criteria in the literature are as follows: price, service level (fill rate), lead time, product quality, supplier’s reliability, production capacity and inventory level. Therefore, we can classify the second-category investigations in terms of exogenous or endogenous parameters based on which suppliers compete. Next, we categorize the studies with endogenous parameters based on the number of considered parameters.
Suppliers’ competition based on one or more exogenous parameters for demand share has been studied in a stream of research in the literature. Moorthy [13], Banker et al. [14], Hall and Porteus [15], Tsay and Agrawal [16], Gans [17], Chayet and Hopp [18], Boyaci and Gallego [19], Allon and Federgruen [20], Matsubayashi [21], Ozer and Raz [22], Lu et al. [23], Hafezolkotob and makui [24] and Ahmadvand et al. [25] have taken exogenous parameters into consideration.
In Gilbert and Weng [26], Ha et al. [27], Cachon and Zhang [28], Benjaffar et al. [2], Ching et al. [29], Elahi et al. [30] and Elahi [12], the authors have studied firms’ competition based on a single endogenous parameter.
As far as the present authors’ search through the literature shows there is only one work that considers an allocation policy with more than one endogenous parameter. Jin and Ryan [3] considered a problem faced by a single buyer who must decide how to allocate a demand to two make-to-stock suppliers based on both suppliers’ prices and service levels (fill rates). In fact, in their model, the suppliers face a two-dimensional strategy space. The buyer utilizes an exponential allocation function that characterizes the relative importance of the price versus the service. In their model, the buyer’s objective is to minimize his total cost, and the suppliers’ objective is to maximize their profits. In the real world, companies are interested in using multi-criteria to evaluate the performance of their suppliers. In other words, buyers buy a product or service based on not only its price but also its supplier’s service level, its quality, etc. For example, price and quality competition is very common in the broadband Internet market in Japan [21]. As another example, Royal Philips Electronics puts 15% weight on the price among other service and innovation-related criteria [12]. However, some companies place a lower weight on some criteria as compared to other ones, though ignoring these criteria does not seem logical. As noted
in Jin and Ryan [3], the analysis of a setting with a multi-dimensional strategy space is more sophisticated than other settings with single-dimensional strategy space.
In this paper, we will extend the model of Jin and Ryan [3] by considering a three-dimensional strategy space and propose a game-theoretic framework that has the ability to be generalized to a strategy space with more dimensions. In our model, the buyer allocates demands to the competing suppliers based on the price and the service level as well as the product quality. We will try to account for the buyer’s trade-off among these three criteria by using two certain allocation functions: 1) the exponential allocation function, and 2) the Cobb-Douglas allocation function.
3. MODEL DESCRIPTION
We examine a supply chain consisting of one buyer and two suppliers in which the buyer outsources manufacturing of a physical product to two suppliers. The suppliers operate as make-to-stock and compete for the buyer’s share of demand based on price, service level and product quality. In a make-to-stock environment, the typical measures of service level consist of fill rate, expected order delay and the probability that the order delay does not exceed a quoted lead time [2, 12, 30]. In this paper, in consistence with Benjaffar et al. [2], Elahi et al. [30], Jin and Ryan [3] and Elahi [12], we assume that the service level is measured by fill rate that is determined by the supplier’s base-stock level. In addition, we use the mean of the quality characteristic of interest as a proxy for product quality. Here, we consider the specification limits for the quality characteristic of interest, and the suppliers try to determine the optimum process mean. It should be noted that when a product does not fulfill at least one of the specification limits, the item is reprocessed or scrapped and sold at a discount price. Hence, the process mean may be set higher to reduce the costs incurred due to producing defective products. On the other hand, an increase in the process mean causes an increase in the production cost [31].
In order to minimize his average cost, the buyer must use an allocation policy to allocate a fraction of the demand to his suppliers. In this paper, we focus on two certain allocation functions: the exponential and the Cobb-Douglas allocation functions that have been widely used in marketing and operation management [32]. The exponential allocation function can be represented as:
2
1
i i i
j j j
s p
i
s p
j e
e
a b m
a b m
h - +
- +
= =
where a and β can be interpreted as the relative importance of price and quality vs. service level, respectively. In fact, hi specifies the fraction of the demand that is allocated to supplier i based on his price (pi), service level (si) and product quality (mi). The Cobb-Douglas allocation function can be written as:
2
1
i i i i
i i i j
s p
s p
g a b g a b
m h
m
-=
=
å
(2)whereg, a and β denote the absolute elasticity of supplieri 's score function with respect to its own service level, price and quality level, respectively.
The notations (parameters and decision variables), assumptions and mathematical formulation are as follows:
3. 1. Parameters 0
f : Variable production cost per unit for each supplier
q
e : Quality related variable cost for each supplier
s
e : Service related variable cost for each supplier e : Performance inspection cost per unit for each supplier
l : The rate of Poisson demand process at the buyer
p
m : The rate of exponentially distributed production times at each supplier
r: The utilization rate for each supplier (
p l r
m
= )
L: The lower specification limit for the product of each
supplier
0
x : The target value of product quality level h: The holding cost per unit
b: The backorder cost per unit
3. 2. Decision Variables i
s : The service level provided by supplieri , i =1, 2
i
p : The price offered by supplieri , i =1, 2
i
m : The unknown mean of the normal quality
characteristic of supplieri 's product (Xi), 2
[ , ]
i i i
X ºN m s , where si is the known standard deviation of Xi , i=1, 2
3. 3. Assumptions Suppliers are homogeneous with identical cost structures.
Suppliers operate in a make-to-stock environment. Suppliers have perfect and complete information on each others' price, service level and quality level.
Capacity and process mean adjustment are inexpensive. Collusion is not considered between the suppliers. There is a lower specification limit for the quality characteristic of interest.
Only the buyer bears responsibility for the backorder cost and deviation cost from the target value of the product quality level.
Surrogate variable is not considered for the quality characteristic of interest.
Products with Xi<Lare not sold. The scrap cost for the non-conformance product is assumed to be zero.
3. 4. Model Formulation This section describes the supplier's and buyer's objectives and introduces the profit functions of each of them.
3. 4. 1. Supplier's Problem The supplier's objective is to determine the price, service level and quality level based on a given allocation policy to maximize her profit function. The choice of the policy is subject to the behavior of the competing supplier. The supplier's profit function can be determined by the following equation:
Supplier's profit=total revenue - total production cost - total capacity cost - total quality cost - total performance inspection cost - total expected holding cost
The total expected holding cost is expressed as
h.(expected inventory). Using the approaches of
Benjaffar et al. [2], Ching et al. [29], Jin and Ryan [3] and Elahi [12] and modifying them based on our assumptions, we may express the expected inventory mathematically as:
ln(1 ) ( )
ln( ) 1
i i
i i
i i
s
E I r s
r r
¢
-=
-¢ - ¢ (3)
where
1
(1 ( )) 1 ( )
i
i i
p
i i
L L
l
r m r m
m f f
s s
¢ = = ´
-
--
-, f(.) and 1 ( ii)
L m
f s
-are the cumulative distribution function of the standard normal variable and the probability of producing non-defective products, respectively. Therefore, the supplier's profit function can now be expressed as:
0
( (1 ( )) )
ln(1 )
.( )
ln ln(1 ( )) 1 ( )
s i
i i i q i i
i i
i
i i
i i
L
p f
s
h L L s
e m
p h l f e m e
s r
r
m m
r f r f
s s
-= - - - -
--
--
-- - -
-(4)
Buyer's cost function= total purchasing cost + total expected backorder cost +total expected quality loss
The total expected backorder cost is expressed as:
b.(expected backorder). The approaches of Benjaffar et
al. [2], Ching et al. [29], Jin and Ryan [3] and Elahi [12] have also been used to find the expected backorder. The expected backorder incurred by supplier i can be written as:
( ) (1 )
1 ( )
i i
i i
E B s
L r m r f s =
-- - (5)
In this paper, in line with Chen and Kao [33], Chen and Koo [34] and Chen and Lu [35], we use the adopted Taguchi's quadratic quality loss function for the buyer's quality loss cost. Taguchi's quadratic quality loss function has been widely used in quality control literature [35]. Quality loss per unit (Loss X( )) can be presented asLoss X( )=k X( -x0)2, where k and x0are
the quality loss coefficient and target value of product quality level, respectively. Therefore, the expected quality loss per unit is given by:
2 2 2
0 0
( ( i)) ( i ) ( ) ( i ( i ) )
E Loss X +¥k X x f x dx ks m x
-¥
=
ò
- = + - (6)where f x( )is the normal density function. Hence, the buyer's cost function can be stated mathematically as:
2 2 2
2 2
0
1 1 1
(1 ) ( ( ) )
1 ( )
i i i i i i
i i i i
i
C p b s k x
L
r
h l m h l s m
r f s = = = = + - + + --
-å å å (7)
4. COMPETITION EQUILIBRIUM
In the present study, we develop a three-stage sequential game-theoretic model, in which the suppliers decide on the quality level in the first stage, the suppliers choose their service level in the second stage, and the suppliers make the pricing decisions in the third stage. We can summarize the proposed game stages as follows: Stage 1: each supplier decides on the quality level to be provided (mi)
Stage 2: each supplier decides on the service level to be provided (si)
Stage 3: each supplier decides on the price to be offered (pi)
Equilibrium analysis based on the exponential allocation function similar to Bae et al. [11], we begin from stage 3 to find the Subgame Nash Equilibrium. In other words, firstly, we assume that the quality level and the service level are given, and each supplier competes for a demand share by choosing a price that maximizes her profit.
It should be noted that Jin and Ryan [3] proved the existence of a unique and symmetric equilibrium for the game with a two-dimensional strategy space. It is straightforward to prove that there exists a unique and symmetric equilibrium for the proposed model by applying a similar approach; therefore, we save the proof by taking it for granted. Substituting hi in (1) into
i
p in (4) gives the profit function in terms of
, , , , ,
i i i j j j
p s m p s m as follows:
2
1
0
( , , , , , )
( (1 ( )) )
ln (1 )
.( )
ln ln (1 ( )) 1 ( )
i i i
j j j s p i i i i j j j
s p j
s i
i q i i
i i i i i i i e
p s p s
e L p f s h s L L
a b m a b m
p m m
e m
l f e m e
s r
r
m m
r f r f
s s - + - + = = ´ -- - - - -- -- -- - - -å (8)
By applying the first-order condition to
( , , , , , )
i p si i i p sj j j
p m m with respect to piand letting
i j
p = p =p, si =sj =sand mi =mj =m, given the quality level and service level, the unique pthat maximizes the profit function is determined as in the following: ¶pi ¶ =pi 0. The first-order condition yields
0
2(1 ( )) ( )
(1 ( ))
s q L f p L e m
f a e m e
s r m a f s -- + + + + = -- (9)
At the second stage, each supplier decides upon the service level given the quality level. Using the first-order condition on (8) by differentiating with respect to
i
s
and lettingpi =pj =p, si =sj =sand mi=mj =m , the following is obtained:0
1 ( (1 ( ) )
4
1 1
.[( )( ) ] 0
1 ln ln(1 ( )) 1 ( )
s i q i L p f s h L L s e
p l f m e m e
s r
r
m m
r f r f
s s ¶ = - - - - - -¶ + + = - -- - - - -(10)
Substituting P in (9) into (10) and solving the first-order condition, the optimal service level as a function of quality level is obtained as follows:
2 (1 ( )) 1
1
(1 ( ))(1 ( )) 2 ln ln(1 ( ))
L h
s
L L h L
m
a r f
s
m m m
l f r f ar r f
s s s
-= + ´
- -
-- - - + - - (11)
It should be noted that the condition r 1 f(Lsm) <
-is needed to ensure that the service level is smaller than 1.At the first stage, individual suppliers choose the quality level simultaneously. Applying the first-order condition in (8) with respect to mi and substituting
i j
0
2 2
1
( (1 ( )) ) [ ( ) ]
4 2
( )( ln(1 )) ( )
[ ] 0
(1 ( ))(ln ln(1 ( ))) (1 ( ))
s i
q q
i
L p L
p f
L s L s
h
L L L
e
p bl f m e m e l j m e
m s r s s
m m
j s rj s
m m m
s f r f s r f
s s s
¶ = - - - - - - + - - + ¶ - - - -- = - - -- - - - -(12)
where j(.) is the standard normal density function. By incorporating P in (9) and sin (11) into (12), we can write (12) in terms of only one decision variable,µ. Solving the resulting Equation (12) for µ gives the equilibrium value of the quality level provided by each supplier. Hence, the equilibrium values of the price and the service level can be derived by substituting the determined µ into (9) and (11), respectively. Due to the nonlinear terms involved in the resulting Equation (12), (j(.) andf(.)), it is difficult to provide a closed-form expression forµ. Therefore, the equilibrium values of the proposed model can be obtained by using a numerical search. It is to be note that in order to ensure the concavity of the profit function, the second-order condition should be checked at the equilibrium point. Hence, we need to show that the Hessian matrix is negative definite. In other words, we need to show that the leading principal minors of the Hessian matrix alternate in sign. The leading principal minor is determinant of the leading principal sub-matrix obtained by deleting the last n k- rows and columns of a n n´ matrix, wherek =0 1, ,...,n-1. The Hessian matrix of the profit function and the leading principal minors are given as follows:
2 2 2
2
2 2 2
2
2 2 2
2
i i i
i i i i i
i i i
i i i i i
i i i
i i i i i
p s p p
H
s p s s
p s
p p p
m
p p p
m
p p p
m m m
æ ¶ ¶ ¶ ö
ç ¶ ¶ ¶ ¶ ¶ ÷
ç ÷
ç ¶ ¶ ¶ ÷
ç ÷
=
¶ ¶ ¶ ¶ 
ç ÷
ç ¶ ¶ ¶ ÷
ç ÷
ç¶ ¶ ¶ ¶ ¶ ÷
è ø
2
1 2i
i A p p ¶ = ¶ 2 2 2
2 2 2
2
i i
i i i
i i
i i i
p p s
A
s p s
p p p p ¶ ¶ ¶ ¶ ¶ = ¶ ¶ ¶ ¶ 
2 2 2
2
2 2 2
3 2
2 2 2
2
i i i
i i i i i
i i i
i i i i i
i i i
i i i i i
p p s p
A
s p s s
p s
p p p
m
p p p
m
p p p
m m m
¶ ¶ ¶ ¶ ¶ ¶ ¶ ¶ ¶ ¶ ¶ = ¶ ¶ ¶ ¶ ¶ ¶ ¶ ¶ ¶ ¶ ¶ ¶ ¶ (13)
where the second-order partial derivatives should be derived from the first-order condition Equations. If
1 0, 2 0
A < A > and A3<0 , then His negative definite.
Equilibrium analysis based on the cobb-dougl as allocation function by substituting hi in (2) into pi in (4), the supplier's profit function can be expressed in terms of p si, ,i mi,p sj, ,j mjas follows:
2
1
0
( , , , , , ) ( (1 ( ))
ln(1 )
) .( )
ln ln(1 ( )) 1 ( )
i i i i
i i i i j j j i
i i i i
j
s i
q i i i
i i
i i
s p L
p s p s p
s p
s
f h s
L L
g a b g a b
m m
p m m l f
s m
e e m e r
m m
r r f r f
s s -= -= -- - - -- -- - -å (14)
Similar to the previous case, we begin from stage 3. In this stage, equating the first derivative of pi in (14) with respect to pi zero and letting pi =pj =p ,
i j
s =s =sand mi =mj =m yields:
0
( )
( 2 )(1 ( ))
s q f p L e
a e m e
r m a f s + + + =
-- - (15)
In order to ensure that p >0, we require a>2. Incorporating P in (15) intopiin (14) and applying the
first-order condition given thepi =pj =p ,
i j
s =s =sand mi =mj =m , the following is given:
0
2 4
( )
2 ln ln(1 ( ))1
4
0
1 ( )
s i q i h s f L s s h s L e
p gl e m e
m
a r r f
s r m r f s ¶ = + + + + -¶ - - - -+ = -(16) Now, defining 0 2 ( ) 2 s q
A gl f e e m e
a r
= + + +
- ,
4 ln(1 ( )) ln
h B L m f r s = --
-and 4
1 ( )
h C L r m r f s = -- -,
we obtain the supplier's equilibrium service level in terms of A, B and C as follows:
2 2 2 2 2 2
2
A B C A B C AB AC BC
s
C
- - + + + + + +
-= (17)
Finally, at stage 1 of the proposed game, differentiating i
p in (14) with respect tomiand letting pi =pj =p ,
i j
s =s =sand mi =mj =m , we have:
0
2 2
1
( (1 ( )) ) ( ( ) )
4 2
ln(1 ) ( ) ( )
( ) 0
(1 ( ))(ln ln(1 ( ))) (1 ( ))
s i
q q
i
L p L
p f
L L
s
h s
L L L
e
p b l f m e m e l j m e
m m s r s s
m m
j rj
s s
m m m
s f r f s r f
s s s
¶ = - - - - - - + - -¶ - -- + = - - -- - - -(18)
5. COMPUTATIONAL RESULTS
As already mentioned, the problem lacks explicit expression for the supplier's quality level. Therefore, in this section, a numerical study with a sensitivity analysis of some key parameters is carried out to illustrate the behavior of the proposed model.
5. 1. Numerical Study We assume that the input parameters are set as:
7
a= , b=2, g=1, l=1000, s =1.5, r=0.8,
40
L= , f0=5, es =2, eq =0.3, e=1, h=2, 10
b= , k=10 x0=43.
Under the given parameters, the equilibrium values of the decision variables as well as the optimal supplier's profit and the optimal buyer's cost are depicted in Table 1.The results in Table 1 show that under the considered condition, both sides gain more profit by applying the Cobb-Douglas allocation function in the model. As can be seen in Table 1, in competition with the Cobb-Douglas allocation function, the suppliers offer higher prices, higher service levels and lower quality levels
than in competition with the exponential allocation function.
5. 2. Sensitivity Analysis In this section, the effect of parameters α, β and ρ on the equilibrium values of P, sand µ will be investigated by performing a sensitivity analysis. The results of the sensitivity analysis are summarized with respect to α in Table 2. It is to be noted that we only allow αto vary from 5 to 20 and fix the other parameters similar to those in the previous sub-section.
Table 2 indicates that the equilibrium values of P, sand µ decrease in α for both types of competition (games with the exponential allocation function and the Cobb-Douglas allocation function). As shown in Table 2, the difference between the equilibrium prices of the two competition modes decreases as the relative importance of the price vs. service level α increases. This is similar to the impact of α on the difference between the equilibrium quality levels and in contrast with the impact of α on the difference between the equilibrium service levels.
TABLE 1. Equilibrium values of the decision variables (with a g=7,b g=2) *
p s*(%) m* p* C* A1 A2 A3
Exponential Allocation
Function 22.353 88.7 45.205 130.359 93491.3 -1749.5 1229806.3 -204864261.6 Cobb-Douglas
Allocation Function 30.611 99.4 44.44 4327.823 73848.8 -35802380 77271067944 -666676409515143000
TABLE 2. Sensitivity analysis with respect to α
a
5 7 9 15 20E*. Co**. E. Co. E. Co. E. Co. E. Co.
*
p 22.519 36.865 22.353 30.611 22.081 28.041 21.917 25.122 21.871 24.184
*
s (%) 91.6 99.6 88.7 99.4 85.8 99.3 77.9 98.7 72.3 98.3
*
m 45.38 45.38 45.21 44.44 44.41 44.17 44.00 43.91 43.9 43.84
*
p 184.99 7330.341 130.353 4327.823 110.232 3070.827 58.983 1635.172 43.931 1173.267
*
C 101914 116248.1 93491.3 73848.8 64485 64232 54553.6 55997 52516.8 53743
*E.: Exponential Allocation Function **Co.: Cobb-Douglas Allocation Function
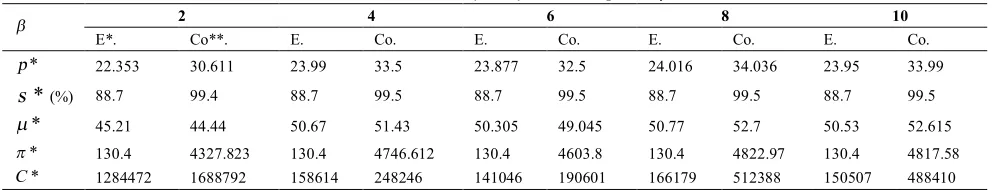
TABLE 3. Sensitivity analysis with respect to β
b 2 4 6 8 10
E*. Co**. E. Co. E. Co. E. Co. E. Co.
*
p 22.353 30.611 23.99 33.5 23.877 32.5 24.016 34.036 23.95 33.99
*
s (%) 88.7 99.4 88.7 99.5 88.7 99.5 88.7 99.5 88.7 99.5
*
m 45.21 44.44 50.67 51.43 50.305 49.045 50.77 52.7 50.53 52.615
*
p 130.4 4327.823 130.4 4746.612 130.4 4603.8 130.4 4822.97 130.4 4817.58
*
C 1284472 1688792 158614 248246 141046 190601 166179 512388 150507 488410
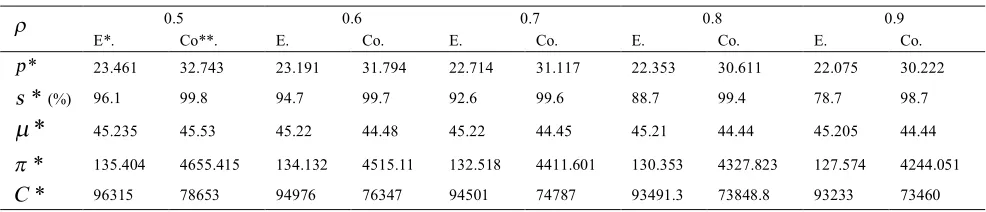
TABLE 4. Sensitivity analysis with respect to r
r 0.5 0.6 0.7 0.8 0.9
E*. Co**. E. Co. E. Co. E. Co. E. Co.
*
p 23.461 32.743 23.191 31.794 22.714 31.117 22.353 30.611 22.075 30.222
*
s (%) 96.1 99.8 94.7 99.7 92.6 99.6 88.7 99.4 78.7 98.7
*
m
45.235 45.53 45.22 44.48 45.22 44.45 45.21 44.44 45.205 44.44*
p 135.404 4655.415 134.132 4515.11 132.518 4411.601 130.353 4327.823 127.574 4244.051
*
C 96315 78653 94976 76347 94501 74787 93491.3 73848.8 93233 73460
*E.: Exponential Allocation Function **Co.: Cobb-Douglas Allocation Function
Table 3 shows the results of the sensitivity analysis of the equilibrium values with respect toβ. We vary the value of b from 2 to 10 and let a=7, g=1, l=1000,
1.5
s = , r=0.8, L=40, f0=5, es =2, eq =0.3, e=1,
2
h= , b=20, k=50and x0=50.
As showed by Table 3, an increase in β has no significant impact on the equilibrium service level. We also find that there are no clear trends in the equilibrium price and the equilibrium quality level. However, an interesting insight is that the trend of the price level is similar to that of the quality level. In other words, the buyer pays a higher price for a higher-quality product received, and vice versa. This implies that the buyer makes a trade-off between the higher price paid and the higher quality received.
The results of the sensitivity analysis of the equilibrium values with respect to ρ are shown in Table 4. In this case, the input parameters are given as:a=7, b=2,
1
g= , l=1000, s=1.5, L=40, f0=5, es =2, eq =0.3,
1
e= , h=2, b=10, k=10and x0=43.
As Table 4 shows, once the utilization rate ρ increases, none of the equilibrium values increase. In other words, the buyer makes a trade-off between the price and the service level, as ρ increases.
6. CONCLUSION
In recent years, outsourcing of inputs has become a major phenomenon in industries. On the other hand, in decision making about outsourcing, the splitting of an order among multiple suppliers, namely multi-sourcing, is one of the sourcing strategies that has recently been regarded. In this setting, the buyer encounters competing suppliers. Therefore, understanding the behavior of the buyer and suppliers is an important issue.
This paper is a study of an outsourced supply chain consisting of one buyer and two suppliers in which the buyer outsources manufacturing of a physical product to two competing suppliers. The proposed model
postulates a three-dimensional strategy space in which the buyer allocates his demands to the competing suppliers based on the price, the service level and the product quality level. In this paper, two certain types of allocation function, namely the exponential allocation function and the Cobb-Douglas allocation function have been used. A three-stage game-theoretic framework is presented to derive the equilibrium values. Since the problem does not have a closed-form solution, numerical studies are carried out over a wide range of some key parameters. The numerical results show that the equilibrium values of price, service level and quality level tend to decrease, as α increases for both competition modes. Service level is not sensitive to β. The numerical results also indicate that as β increases, the buyer makes a trade-off between the higher price paid and the higher quality received. He also makes a trade-off between the higher price paid and the higher service level received as ρincreases. In this case, future research is suggested to be done in some directions. It is interesting to consider the competition at the two levels of a supply chain where the buyers compete for the market share and the suppliers compete for the buyers' demand share. Another extension is to consider heterogeneous suppliers in cost structures and utilization rates. Further extension would be to relax some of the assumptions considered in the paper. For example, a setting may be considered in which the buyer and the suppliers bear responsibility for the back order cost.
7. REFERENCES
1. Buhler, S. and Haucap, J., "Strategic outsourcing revisited",
Journal of Economic Behavior & Organization, Vol. 61, No. 3, (2006), 325-338.
2. Benjaafar, S., Elahi, E. and Donohue, K.L., "Outsourcing via service competition", Management Science, Vol. 53, No. 2, (2007), 241-259.
3. Jin, Y. and Ryan, J.K., "Price and service competition in an outsourced supply chain", Production and Operations Management, Vol. 21, No. 2, (2012), 331-344.
performance", Journal of Operations Management, Vol. 28, No. 2, (2010), 124-143.
5. Cachon, G.P. and Harker, P.T., "Competition and outsourcing with scale economies", Management Science, Vol. 48, No. 10, (2002), 1314-1333.
6. Dube, P., Liu, Z., Wynter, L. and Xia, C., "Competitive equilibrium in e-commerce: Pricing and outsourcing",
Computers &Operations Research, Vol. 34, No. 12, (2007), 3541-3559.
7. Chang, D.S., Kuo, Y.C. and Chen, T.Y., "Productivity measurement of the manufacturing process for outsourcing decisions: The case of a taiwanese printed circuit board manufacturer", International Journal of Production Research, Vol. 46, No. 24, (2008), 6981-6995.
8. Ni, D., Li, K.W. and Tang, X., "Production costs, scope economies, and multi-client outsourcing under quantity competition", International Journal of Production Economics, Vol. 121, No. 1, (2009), 130-140.
9. Kumar, S., Zampogna, P. and Nansen, J., "A closed loop outsourcing decision model for developing effective manufacturing strategy", International Journal of Production Research, Vol. 48, No. 7, (2010), 1873-1900.
10. McIvor, R., "The influence of capability considerations on the outsourcing decision: The case of a manufacturing company",
International Journal of Production Research, Vol. 48, No. 17, (2010), 5031-5052.
11. Bae, S.H., Yoo, C.S. and Sarkis, J., "Outsourcing with quality competition: Insights from a three-stage game-theoretic model",
International Journal of Production Research, Vol. 48, No. 2, (2010), 327-342.
12. Elahi, E., "Outsourcing through competition: What is the best competition parameter?", International Journal of Production Economics, Vol. 144, No. 1, (2013), 370-382.
13. Moorthy, K.S., "Product and price competition in a duopoly",
Marketing Science, Vol. 7, No. 2, (1988), 141-168.
14. Banker, R.D., Khosla, I. and Sinha, K.K., "Quality and competition", Management Science, Vol. 44, No. 9, (1998), 1179-1192.
15. Hall, J. and Porteus, E., "Customer service competition in capacitated systems", Manufacturing & Service Operations Management, Vol. 2, No. 2, (2000), 144-165.
16. Tsay, A.A. and Agrawal, N., "Channel dynamics under price and service competition", Manufacturing & Service Operations Management, Vol. 2, No. 4, (2000), 372-391.
17. Gans, N., "Customer loyalty and supplier quality competition",
Management Science, Vol. 48, No. 2, (2002), 207-221. 18. Chayet, S. and Hopp, W., "Lead time competition under
uncertainty", Working paper, Northwestern University, Evanston, IL,(2002).
19. Boyaci, T. and Gallego, G., "Supply chain coordination in a market with customer service competition", Production and Operations Management, Vol. 13, No. 1, (2004), 3-22. 20. Allon, G. and Federgruen, A., "Competition in service
industries", Operations Research, Vol. 55, No. 1, (2007), 37-55.
21. Matsubayashi, N., "Price and quality competition: The effect of differentiation and vertical integration", European Journal of Operational Research, Vol. 180, No. 2, (2007), 907-921. 22. Ozer, O. and Raz, G., "Supply chain sourcing under asymmetric
information", Production and Operations Management, Vol. 20, No. 1, (2011), 92-115.
23. Lu, J.-C., Tsao, Y.-C. and Charoensiriwath, C., "Competition under manufacturer service and retail price", Economic Modelling, Vol. 28, No. 3, (2011), 1256-1264.
24. Hafezalkotob, A. and Makui, A., "Modeling risk of losing a customer in a two-echelon supply chain facing an integrated competitor: A game theory approach", International Journal of Engineering, Vol. 25, No. 1, (2012), 11-34.
25. Ahmadvand, A., Asadi, H. and Jamshidi, R., "Impact of service on customers' demand and members' profit in supply chain",
International Journal of Engineering, Vol. 25, No. 3, (2012), 213-222.
26. Gilbert, S.M. and Weng, Z.K., "Incentive effects favor nonconsolidating queues in a service system: The principal– agent perspective", Management Science, Vol. 44, No. 12-part-1, (1998), 1662-1669.
27. Ha, A.Y., Li, L. and Ng, S.-M., "Price and delivery logistics competition in a supply chain", Management Science, Vol. 49, No. 9, (2003), 1139-1153.
28. Cachon, G.P. and Zhang, F., "Obtaining fast service in a queueing system via performance-based allocation of demand",
Management Science, Vol. 53, No. 3, (2007), 408-420. 29. Ching, W.-K., Choi, S.-M. and Huang, X., "Inducing high
service capacities in outsourcing via penalty and competition",
International Journal of Production Research, Vol. 49, No. 17, (2011), 5169-5182.
30. Elahi, E., Benjaafar, S. and Donohue, K.L., "Optimal service-based procurement with heterogeneous suppliers",Management Science and Information Systems Faculty Publication Series,
paper 6, (2011).
31. Lee, M.K. and Jang, J.S., "The optimum target values for a production process with three-class screening", International Journal of Production Economics, Vol. 49, No. 2, (1997), 91-99.
32. Huang, J., Leng, M. and Parlar, M., "Demand functions in decision modeling: A comprehensive survey and research directions", Decision Sciences, Vol. 44, No. 3, (2013), 557-609. 33. Chen, C.-H. and Kao, H.-S., "The determination of optimum process mean and screening limits based on quality loss function", Expert Systems with Applications, Vol. 36, No. 3, (2009), 7332-7335.
34. Chen, C.-H. and Khoo, M.B., "Joint determination of optimum process mean and economic specification limits for rectifying inspection plan with inspection error", Journal of The Chinese Institute of Industrial Engineers, Vol. 25, No. 5, (2008), 389-398.
.
Outsourcing through Three-dimensional Competition
A. Sadri Esfahani, M.B. Fakhrzad
Department of Industrial Engineering, Faculty of Engineering, Yazd University, Yazd, Iran
P A P E R I N F O
Paper history:
Received 12January 2014
Received in revised form 12 July 2014 Accepted 14August2014
Keywords: Supply Chain Competition Outsourcing
هﺪﯿﮑﭼ
ﻦﯿﻣﺄﺗودوراﺪﯾﺮﺧﮏﯾﻞﻣﺎﺷﻦﯿﻣﺄﺗهﺮﯿﺠﻧزﮏﯾ،ﻪﻟﺎﻘﻣﻦﯾارد ﯽﻣﻪﺘﻓﺮﮔﺮﻈﻧردهﺪﻨﻨﮐ
دﻮﺷ
. راﺪـﯾﺮﺧ،ﻦﯿﻣﺄﺗهﺮﯿﺠﻧزﻦﯾارد
ﻦﯿﻣﺄﺗودﻪﺑارﯽﮑﯾﺰﯿﻓلﻮﺼﺤﻣﺎﯾﻪﻌﻄﻗﮏﯾﺖﺧﺎﺳ نوﺮﺑﺐﯿﻗرهﺪﻨﻨﮐ
ﯽﻣيرﺎﭙﺳ ﺪﯾﺎﻤﻧ
.
ﻦﯿﻣﺄﺗ
ﻢﻬـﺳﺐـﺴﮐياﺮـﺑنﺎﮔﺪﻨﻨﮐ
ﯽﻣﺖﺑﺎﻗرﻪﺑراﺪﯾﺮﺧيﺎﺿﺎﻘﺗزايﺮﺘﺸﯿﺑ ﺪﻧزادﺮﭘ
.
ﻦﯿﻣﺄـﺗﻪﺑيﺪﻌﺑﻪﺳﺺﯿﺼﺨﺗﻊﺑﺎﺗﮏﯾﻪﯾﺎﭘﺮﺑاردﻮﺧيﺎﺿﺎﻘﺗراﺪﯾﺮﺧ
-ﯽﻣﺺﯿﺼﺨﺗﺐﯿﻗرنﺎﮔﺪﻨﻨﮐ ﺪﻫد
.
بﺎﮐوﯽﯾﺎﻤﻧﺺﯿﺼﺨﺗﻊﺑﺎﺗود،ﻪﻟﺎﻘﻣﻦﯾارد
-
ﯽﻣﻪﺘﻓﺮﮔﺮﻈﻧردسﻼﮔاد ﮏﯾﺮﻫﻪﮐدﻮﺷ
ﯽﻣلﻮﺼﺤﻣﺖﯿﻔﯿﮐﺢﻄﺳوﺖﻣﺪﺧﺢﻄﺳ،ﺖﻤﯿﻗزاﯽﻌﺑﺎﺗ ﺎﺑ
ﺪﺷ
. ﻪـﯾﺮﻈﻧبﻮﭼرﺎـﭼﮏﯾ،لﺪﻣﯽﻟدﺎﻌﺗيﺎﻬﺑاﻮﺟﻦﺘﻓﺎﯾياﺮﺑ
ﻪﻠﺣﺮﻣﻪﺳيزﺎﺑ ﯽﻣﻪﺋارايا
دﻮﺷ
. ﻞـﯿﻠﺤﺗويدﺪـﻋتﺎﻌﻟﺎﻄﻣ،ﺖﺳاﻪﺘﺴﺑمﺮﻓوﯽﻠﯿﻠﺤﺗباﻮﺟﮏﯾﺪﻗﺎﻓﻪﻟﺄﺴﻣﻪﮐﺎﺠﻧآزا
ﺪﺷﺪﻫاﻮﺧمﺎﺠﻧالﺪﻣيﺪﯿﻠﮐيﺎﻫﺮﺘﻣارﺎﭘزاﯽﺧﺮﺑيورﺮﺑﺖﯿﺳﺎﺴﺣ
.