Open Access
Research article
Copula based prediction models: an application to an aortic
regurgitation study
Pranesh Kumar*
1,2and Mohamed M Shoukri
1,3Address: 1Department of Biostatistics, Epidemiology and Scientific Computing, King Faisal Specialist Hospital and Research Center, Riyadh 11211, Saudi Arabia, 2Department of Mathematics, University of Northern British Columbia, Prince George, BC, Canada and 3Department of
Epidemiology and Biostatistics, Schulich School of Medicine, University of Western Ontario, London, Ontario, Canada Email: Pranesh Kumar* - [email protected]; Mohamed M Shoukri - [email protected]
* Corresponding author
Abstract
Background: An important issue in prediction modeling of multivariate data is the measure of dependence structure. The use of Pearson's correlation as a dependence measure has several pitfalls and hence application of regression prediction models based on this correlation may not be an appropriate methodology. As an alternative, a copula based methodology for prediction modeling and an algorithm to simulate data are proposed.
Methods: The method consists of introducing copulas as an alternative to the correlation coefficient commonly used as a measure of dependence. An algorithm based on the marginal distributions of random variables is applied to construct the Archimedean copulas. Monte Carlo simulations are carried out to replicate datasets, estimate prediction model parameters and validate them using Lin's concordance measure.
Results: We have carried out a correlation-based regression analysis on data from 20 patients aged 17–82 years on pre-operative and post-pre-operative ejection fractions after surgery and estimated the prediction model: Post-pre-operative ejection fraction = - 0.0658 + 0.8403 (Pre-operative ejection fraction); p = 0.0008; 95% confidence interval of the slope coefficient (0.3998, 1.2808). From the exploratory data analysis, it is noted that both the pre-operative and post-operative ejection fractions measurements have slight departures from symmetry and are skewed to the left. It is also noted that the measurements tend to be widely spread and have shorter tails compared to normal distribution. Therefore predictions made from the correlation-based model corresponding to the pre-operative ejection fraction measurements in the lower range may not be accurate. Further it is found that the best approximated marginal distributions of pre-operative and post-operative ejection fractions (using q-q plots) are gamma distributions. The copula based prediction model is estimated as: Post -operative ejection fraction = - 0.0933 + 0.8907 × (Pre-operative ejection fraction); p = 0.00008 ; 95% confidence interval for slope coefficient (0.4810, 1.3003). For both models differences in the predicted post-operative ejection fractions in the lower range of pre-operative ejection measurements are considerably different and prediction errors due to copula model are smaller. To validate the copula methodology we have re-sampled with replacement fifty independent bootstrap samples and have estimated concordance statistics 0.7722 (p = 0.0224) for the copula model and 0.7237 (p = 0.0604) for the correlation model. The predicted and observed measurements are concordant for both models. The estimates of accuracy components are 0.9233 and 0.8654 for copula and correlation models respectively.
Conclusion: Copula-based prediction modeling is demonstrated to be an appropriate alternative to the conventional correlation-based prediction modeling since the correlation-based prediction models are not appropriate to model the dependence in populations with asymmetrical tails. Proposed copula-based prediction model has been validated using the independent bootstrap samples.
Published: 16 June 2007
BMC Medical Research Methodology 2007, 7:21 doi:10.1186/1471-2288-7-21
Received: 4 December 2006 Accepted: 16 June 2007
This article is available from: http://www.biomedcentral.com/1471-2288/7/21
© 2007 Kumar and Shoukri; licensee BioMed Central Ltd.
Background
Researchers, clinicians, and scientists are increasingly interested in the statistical models that have been designed to predict the occurrence of endpoint events given the diagnostic risk factors. The number and sophis-tication of cancer risk prediction models have grown rap-idly over recent years and some researchers have expressed concerns as to whether they are always appropriately applied, correctly developed and rigorously evaluated. In 2004 the National Institutes of Health sponsored a work-shop on Cancer Risk Prediction Models: a Workshop on
Development, Evaluation, and Application in Washington
D.C., USA. Experts associated with developing, evaluat-ing, or using risk prediction models met to identify the strengths and limitations of cancer and genetic suscepti-bility prediction models currently in use and under devel-opment, in order to explore the methodological issues related to their development, evaluation and validation and also to identify the research priorities and resources needed to advance the field [1].
In this paper, a basic methodological issue of including the dependence parameter in the prediction model is con-sidered. Pearson's linear correlation coefficient known as correlation is widely applied as a linear dependence meas-ure. However, the correlation has several drawbacks and has a major impact on the accuracy of prediction models [2]. Correlation does not provide a complete description of the dependence structure even when there is a straight-line relationship between two random variables. Rather correlation is the canonical measure of the stochastic dependence used with normal (elliptical) distributions and is strongly affected by extreme endpoints. Independ-ence of two random variables implies that they are uncor-related but zero correlation, in general, does not imply independence unless distributions are multivariate nor-mal. Furthermore, correlation is not invariant under non-linear strictly increasing transformations of random varia-bles. Nonparametric measures of association like Kend-all's rank correlation, Spearman's rank correlation and c-statistic are alternate measures of dependence which are more robust [3]. The kappa statistic is often used to meas-ure the level of agreement when two categorical measmeas-ure- measure-ments of the same subjects are available. For an excellent review of dependence measures and their desirable prop-erties, we refer to [2-4].
An alternative dependence measure is a copula which overcomes the limitations of correlation as a measure of dependence [5-8]. Use of copulas is a relatively new con-cept and has been applied in survival data analysis and actuaries [9,10]. Copulas are functions that join or couple multivariate distribution functions to their one-dimen-sional marginal distribution functions. Advantages of using copulas in modeling are (i) allowance to model
both linear and non-linear dependence, (ii) arbitrary choice of a marginal distribution and (iii) capable of modeling extreme endpoints.
This paper describes the copula-based prediction mode-ling which can be employed as an alternative to the con-ventional correlation-based modeling in any multivariate clinical applications including risk-prediction. Implemen-tation of copula based prediction approach is illustrated by analyzing data from patients with aortic regurgitation and corrective surgery [11].
Methods
Study exampleThe study example is adapted from an investigation [11] which enrolled 20 patients for isolated aortic regurgita-tion both before and after surgery and 20 patients for iso-lated mitral regurgitation. To correct the malfunctioning of the aortic valve, open heart surgery was performed and an artificial valve was sewn into the heart. Data collected were on patient's age, gender, NYHA class (amount of impairment in daily activities), heart rate (beats/minute), systolic blood pressure (mmHG), ejection fraction (frac-tion of blood in the left ventricle pumped out during a beat), EDVI-volume (ml/m2) of the left ventricle after the
heart relaxes adjusted for body surface area (BSA), SVI-volume (ml/m2) of the left ventricle after the blood is
pumped out adjusted for BSA, ESVI- volume (ml/m2) of
the left ventricle pumped out during one cycle adjusted for BSA; ESVI=EDVI-SVI. These measurements were taken before and after valve replacement surgery. The patients were selected to have left ventricular volume overload, i. e., expanded EDVI. For the purpose of illustration, we have used data on post-operative ejection fraction and pre-operative ejection fraction from 20 patients with aor-tic regurgitation.
What are copulas?
We denote the cumulative probability distribution of pre-operative ejection fraction (X) and post-operative ejection fraction (Y) by H(x, y) and marginal distributions of X and
Y by F(x) and G(y) respectively. For uniform random var-iables U and V defined on [0,1] (by applying probability transforms U = F(X) and V = G(Y) to X and Y), there exists a bivariate copula function C(u, v) such that:
H(x, y) = Pr[X ≤x, Y ≤y] = C [F(x, G(y)] = C(u, v). (1)
It is shown [2-4] that correlation r is only a limited description of the dependence between random variables except for the multivariate normal distribution where the correlation fully describes the dependence structure. If
range of G(y). Since copulas link univariate marginals to their full multivariate distribution, an important feature of copulas is that any choice of marginal distributions can be used. Copulas are constructed on the assumption that marginal distributions are known or estimated from the data.
The two standard non-parametric dependence measures expressed in copula form are:
The dependence measures τ and ρ calculated from the application data are used to estimate the copula parame-ter. It may be noted that the Pearson's correlation r cannot be expressed in copula form.
A special class of copulas known as Archimedean copulas [12] is defined by C(u, v) = φ-1 [φ(u) + φ(v)] for all u, v ∈
[0,1], where φ(t) is a generator function such that for all t
∈ (0,1) φ(1) = 0 φ'(t) < 0, i.e., φ(t) is a decreasing func-tion of t and φ"(t) ≥ 0, i.e., φ(t) is convex. One-parameter families of the Archimedean copulas with their generator functions are tabulated by Nelson [[6], p. 94].
From the copulas perspective multi-normal distribution has normal marginals and Gaussian (normal) copula dependence. Non-Gaussian copulas such as t and
Archimedean can be used as an underlying dependence
structure with any other non-normal marginals. Thus cop-ulas provide flexibility in modeling datasets. Some exam-ples of bivariate Archimedean copulas are given in Table 1.
Sample versions of measures of dependence can be expressed in terms of empirical copula and corresponding empirical copula frequency function [6].
Definition. Given (xi, yi), i = 1, ...n, a sample of size n from a
bivariate distribution, the empirical copula is =
[Number of pairs (x, y) in the sample such that x ≤x(i)and y ≤
y(j)]/n, where x(i) and y (j), 1 ≤i, j ≤n, denote order statistics from the sample. The empirical copula frequency function is
given by , if (x(i), y(j)) is an element of the sample;
Otherwise zero.
Simulation of bivariate Archimedean copulas
The following algorithm generates random variables (U,
V) whose joint distribution is an Archimedean copula C(u,
v) with generator function φ(t).
1. Generate two independent uniform random variables p
and q on the interval [0,1].
2. Set t = KC-1(q) where K
c is a copula function C(u, v).
3. Set u = φ-1 [p·φ(t)] and v = φ-1 [(1-p)·φ(t)].
4. Let x = F-1(u) and y = F-1(v).
5. Repeat n times steps 1 through 4 to generate n pairs of data (xi, yi), i = 1,..., n.
For implementing the algorithm, we perform the follow-ing steps [13]:
A. Kendall's rank correlation τby the formula:
B. Copula parameter θfrom τ.
C. Generator function φ(t).
D. First derivative of the generator function, φ'(t).
E. Inverse of the generator function, φ-1(t).
F. Copula function .
G. Inverse of copula function KC-1(t) In case no close form
exists, solution is obtained by numerical root finding
through the equation .
H. u = φ-1 [p·φ(t)] and v = φ-1 [(1-p)·φ(t)].
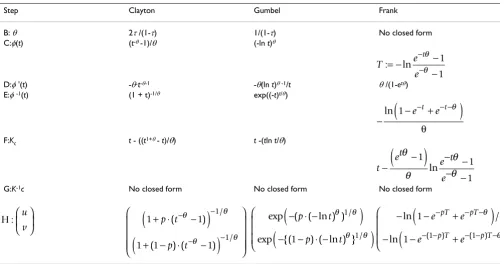
For ready reference algorithm implementation steps for some commonly applied Archimedean copulas are worked out and are given in Table 2.
Evaluating copulas
The first step in modeling and simulation is to identify the appropriate copula form. To identify the most appropriate copula for the given application data set (xi, yi), i = 1,...n, we follow the procedure [3,7]:
Kendall’s Tau: τ =4
∫∫
( , )d ( , )−1 2C u v C u v
I
(2)
Spearman’s Rho: ρ =12
∫∫
( , )d d −3 2C u v u v
I
(3)
C i
n j n
( , )
c i
n j
n n
( , )=1
τ =⎛ ⎝
⎜ ⎞
⎠
⎟ ⎡⎣ − − ⎤⎦
−
<
∑
nxi xj yi yj
i j 2
1
Sign ( )( ) . (4)
C u v K t t t
t
C
( , ) ( ) ( )
( )
= = −
′ ϕ ϕ
t t
t q
− ′ ⎡ ⎣
⎢ ⎤
⎦ ⎥ − ϕ ϕ
1. Calculate the non-parametric Kendall's rank correlation
τusing the formula in equation (4).
2. Construct an empirical copula function KE(t) as fol-lows:
i. Determine the pseudo observations Ti = {Number of(xj
<xi) such that xj ≤xi and yj ≤yi}/(n-1).
ii. The empirical copula KE(t) = proportion of Ti's ≤t, 0 ≤t
≤ 1.
In non-mathematical terms, it means that for all pairs of subjects in which the Y-value for a given subject is lower (or higher) than the Y-value of a second subject, for what
proportion of X-values does the first subject also have a lower (or higher) value?
3. Construct the Archimedean copula function
.
In order to select the Archimedean copula that best fits the application data, we use a probability – plot or choose that copula which minimizes the non-parametric distance measure DM: ∫ [Kc(t) - KE(t)]2dK
E(t). For simulating
bivar-iate Archimedean copulas, we refer to [14].
K t t t
t
C( )
( ) ( ) = − ′ ϕ ϕ
Table 1: Bivariate Archimedean copulas, generator functions and Kendall's τ.
Copula Generator φ(t) C(u, v) Kendall τ
Product (Independent) -ln t u·v 0
Clayton (t-θ -1/θ, θ∈ [-1,∞)\{0} (u-θ + v-θ -1)-1/θ θ/(θ+ 2)
Gumbel (-lnt)θ, θ∈ [1, ∞) Exp [-{(-ln u)θ + (-ln v)θ }1/θ ] (θ-1)/θ
Frank
* Dk(x) is the Debye function for any positive integer k, given by .
− −
− ∈
− −
lne ,
e R tθ θ θ 1 1 − + − − − − − − ⎡ ⎣ ⎢ ⎢ 1
1 1 1
1 θ
θ θ
θ ln (e u )(e v
e
1−4
[
1− 1]
∗θ D ( )θ
Dk x k
xk tk et x t ( )= − ∫ 1 0 d
Table 2: Algorithm steps for the Archimedean copulas.
Step Clayton Gumbel Frank
B: θ 2τ/(1-τ) 1/(1-τ) No closed form
C:φ(t) (t-θ -1)/θ (-ln t)θ
D:φ'(t) -θ·t-θ-1 -θ(ln t)θ -1/t θ/(1-etθ)
E:φ-1(t) (1 + t)-1/θ exp((-t)t/θ)
F:Kc t - ((t1+θ - t)/θ) t -(tln t/θ)
G:K-1c No closed form No closed form No closed form
T e
e
t := −ln −
− − − θ θ 1 1 −
(
− +)
− − −ln 1 e t e t θ θ
t
et e t
e −
(
−)
− − − − θ θ θ θ 1 1 1 lnH : u
v ⎛ ⎝
⎜ ⎞
⎠
⎟ 1 1
1 1 1
1 1 + ⋅ −
(
)
+ − ⋅ −(
)
⎛ ⎝ ⎜ ⎜ ⎜⎜ ⎞ ⎠ ⎟ ⎟ ⎟⎟ − − − − p t p t ( ) ( ) ( ) / / θ θ θ θexp ( ( ln ) )
exp {( ) ( ln ) }
/ / − ⋅ −
(
)
− − ⋅ −(
)
⎛ ⎝ ⎜ ⎜ ⎜ p t p t θ θ θ θ 1 1 1 −(
− +)
−(
− + ⎛ ⎝ ⎜ ⎜ ⎜ − − − − − − − − ln /ln ( ) ( )
1
1 1 1
e e
e e
pT pT
p T p T
θ
θ
Further it may be worth exploring the connections of cop-ulas to other non-parametric association statistics like c-statistic which are defined in terms of the concordant (C) and discordant (D) pairs. One such relationship is easily seen to exist between the Gumbel copula parameter θand the concordant and discordant pairs. The Kendall's rank correlation τin terms of (C, D) pairs is τ= 2(C-D)/n(n-1) and the Gumbel copula parameter θand Kendall's rank correlation are related by τ= (θ-1)/θ. Thus it is easily seen
that .
Validating the prediction model
To validate a prediction model, joint assessment of preci-sion and accuracy is required. In [15], Lin proposed the concordance correlation coefficient to evaluate the
agreement (reproducibility) between two sets of observed (y) and predicted (y) data. The concordance correlation
is defined as:
where μy and are means of (y) and ( ), σy2 and
denote variances of (y) and ( ) and is the population
covariance between (y) and ( ). The concordance
corre-lation is a product of precision (correlation
between Y and ) and accuracy , where accuracy
The estimation of concordance correlation and its
asymptotic sampling distribution are discussed in Lin [15].
Results
ApplicationThe measurements on pre-operative and post-operative ejection fraction from 20 patients with aortic regurgitation including their ages are given in Table 3. The exploratory data analysis indicates that both the pre-operative and post-operative ejection fractions: (i) have slight depar-tures from symmetry, (ii) are skewed in left tails (skewness
θ = − −
− ⎡
⎣
⎢ ⎤
⎦ ⎥
−
1 2 1
1
( )
( )
C D
n n
ρyyˆ
ρyyˆ
ρ
yyˆ=
2
σ
yyˆ/[
σ
y 2+
σ
yˆ 2+
(
μ
y−
μ
yˆ) ],
2 (5)μyˆ yˆ
σ
ˆy 2ˆ
y σyyˆ
ˆ
y
ρyyˆ ryyˆ
ˆ
Y γyyˆ
γ
yyˆ=
2
σ σ
y yˆ/
⎣
⎡
σ
y 2+
σ
y 2ˆ+
(
μ
y−
μ
yˆ)
2⎤
⎦
.
(6)
ρyyˆ
Table 3: Data from patients with aortic regurgitation.
Case Age(years) Sex NYHA Class Pre-operative Ejection
Fraction
Post-operative Ejection Fraction
1 33 M I 0.54 0.38
2 36 M I 0.64 0.58
3 37 M I 0.50 0.27
4 38 M I 0.41 0.17
5 38 M I 0.53 0.47
6 54 M I 0.56 0.50
7 56 F I 0.81 0.56
8 70 M I 0.67 0.59
9 22 M II 0.57 0.33
10 28 F II 0.58 0.32
11 40 M II 0.62 0.47
12 48 F II 0.36 0.24
13 42 F III 0.64 0.63
14 57 M III 0.60 0.33
15 61 M III 0.56 0.34
16 64 M III 0.60 0.30
17 61 M IV 0.55 0.62
18 62 M IV 0.56 0.29
19 64 M IV 0.39 0.26
20 65 M IV 0.29 0.26
Mean 49 0.5490 0.3955
Standard Deviation 14 0.1173 0.1436
Gamma Distribution Shape 21.8920 7.5870
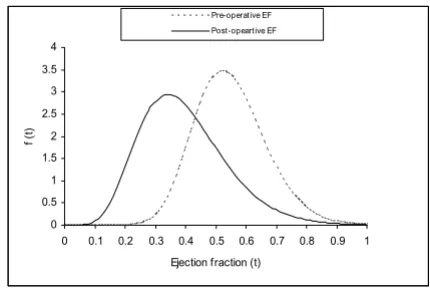
coefficients being -0.3340 and 0.3730, respectively), (iii) have tendency of measurements to cluster less and (iv) have shorter tails (kurtosis coefficients being 0.9680 and -1.2540, respectively). Since both the pre-operative and post-operative measurements show deviations from nor-mal distributions, probability plots for nornor-mal, gamma and Weibull distributions were fitted. From the plots, gamma distributions are found to be the best fit since data points clustered mostly around a straight line for the gamma fit. Estimates of parameters of marginal distribu-tions of pre-operative and post-operative measurements are given in Table 3. Probability plots are graphed in Fig-ure 1 and estimated marginal distributions are given in Figure 2.
There is an evidence of significant association between the pre-operative and post-operative ejection fractions since the Pearson's correlation coefficient r = 0.6870 (p < 0.0010), Kendall's rank correlation τ = 0.5050 (p < 0.0020) and Spearman's rank correlation ρ = 0.6970 (p < 0.0010).
For predicting the post-operative ejection fraction of a patient after surgery given pre-operative ejection fraction measurement, we have estimated the conventional pre-diction regression model using correlation coefficient:
Post-operative ejection fractioncorrelation = -0.0658 +
0.8403 × (Pre-operative ejection fraction); p = 0.0008; 95% confidence interval: (0.3998, 1.2808).
The p-value indicates that the estimated model is useful in predicting the post-operative ejection fraction of a patient given the pre-operative ejection fraction. However, predic-tions made in the lower range of pre-operative ejection fractions may not be accurate because of the skewness exhibited by data in the left tail. As an alternative a copula-based prediction model is discussed below.
Simulation study
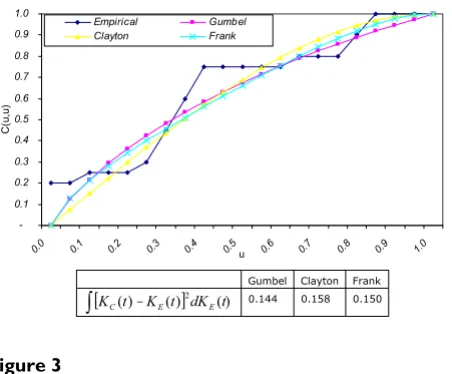
Three copulas of the Archimedean family namely Gum-bel, Clayton, Frank and an empirical copula [16-19] are estimated from the aortic regurgitation patients' data. These copulas are shown in Figure 3. Values of the non-parametric distance measure DM: ∫ [Kc(t) - KE(t)]2dK
E(t)
for the Gumbel, Clayton and Frank copulas are 0.1440, 0.1580 and 0.1500 respectively. Thus, Gumbel copula is the best fit to model the given data. Monte Carlo
simula-Marginal distributions of pre-operative and post-operative ejection fractions
Figure 2
Marginal distributions of pre-operative and post-operative ejection fractions.
0 0.5 1 1.5 2 2.5 3 3.5 4
0 0.1 0.2 0.3 0.4 0.5 0.6 0.7 0.8 0.9 1
Ejection fraction (t)
f (
t)
Pre-operative EF Post-opeartive EF
Pre-operative Ejection Fraction: f(t) (3.0017 u1015)t20.892e t/0.02508,t t0.
Post-operative Ejection Fraction: f(t) (2.4429 u106)t6.587e t/0.0521241,t t0.
Quantile Plots of pre-operative and post-operative ejection fractions
Figure 1
Quantile Plots of pre-operative and post-operative ejection fractions.
0.8 0.6
0.4 0.2
0.0 0.8
0.6
0.4
0.2
0.0
Post-Operative EF
1.0 0.8
0.6 0.4
0.2 0.8
0.7
0.6
0.5
0.4
0.3
tions are performed to replicate datasets 50, 100, 150, 200, 250 and 300 times by implementing the algorithm to simulate bivariate data from the Gumbel copula.
The estimated prediction model and 95% confidence intervals are given in Table 4. The prediction regression model for the post-operative ejection fraction using Gum-bel copula and based on 300 simulations is:
Post-operative ejection fractioncopula = -0.0933 + 0.8907 ×
(Pre-operative ejection fraction); p = 0.00008; 95% confi-dence interval: (0.4810, 1.3003).
Since patient's age may be an important risk factor, we have included age as another predictor in the model. The estimated parameters of the age-adjusted copula based model and correlation based models are summarized in Table 5. Both prediction models indicate highly signifi-cant predictive power (R-values are 0.7010 and 0.7650 for correlation and copula based models respectively). The
regression coefficient of age in both models is not signifi-cant (p-values being 0.2120 for correlation model and 0.2610 for copula model).
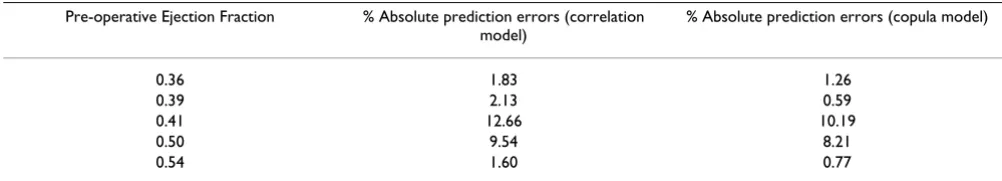
For comparison, predicted values of the post-operative ejection fractions from both copula and correlation based prediction models and actual data are shown in Figure 4. The percent absolute prediction errors for the lower pre-operative ejection fractions from the copula and correla-tion methods are given in Table 6. It is clear from Table 6 that prediction errors due to the copula method are smaller than those based on the correlation method. It is therefore demonstrated that the copula is a more appro-priate dependence measure capable of modeling asym-metrical tails whereas correlation is not appropriate to model skewed data.
Further, it may be noted that estimates, standard errors and width of confidence intervals from 50,100,150,200,250 and 300 copula simulations in Table 4 are very close. Thus, the proposed copula based predic-tion method does not require a large number of simula-tions to attain consistent estimates.
Validation using bootstrap independent data set
To validate the prediction model we were unable to obtain an independent dataset from the same population. Alternatively we have simulated fifty independent data-sets by sampling with replacement from our dataset (bootstrap method). Such an approach is recommended for simulating independent datasets for methodological validation while analyzing small datasets. We found pre-cision coefficient to be 0.8363 (p < 0.0001) indicating
that the observed and predicted measurements have a strong association. The estimate of concordance statistic is 0.7722 (p = 0.0224) for the copula model and
0.7237 (p = 0.0604) for the correlation model. The pre-dictions and observed measurements are therefore
con-ryyˆ
ρyyˆ
Which copula fits the best?
Figure 3
Which copula fits the best?.
-0.1 0.2 0.3 0.4 0.5 0.6 0.7 0.8 0.9 1.0
0.0 0.1 0.2 0.3 0.4 0.5u 0.6 0.7 0.8 0.9 1.0
C
(u,
u)
Empirical Gumbel Clayton Frank
Gumbel Clayton Frank
[ () ()]2 ()
t dK t K t
KC E E
∫
– 0.144 0.158 0.150Table 4: Estimated prediction models and 95% confidence intervals.
Intercept Slope (b) Standard Error (b) 95% Lower Confidence Interval
95% Upper Confidence
Interval
Confidence Interval Width
Correlation model -0.0658 0.8403 0.2097 0.3998 1.2808 0.8810
Gumbel model simulations
50 -0.0768 0.8560 0.1913 0.4541 1.2579 0.8038
100 -0.0996 0.8974 0.1918 0.4945 1.3002 0.8057
150 -0.0938 0.8886 0.1914 0.4866 1.2907 0.8041
200 -0.0908 0.8855 0.1925 0.4812 1.2898 0.8087
250 -0.0965 0.8963 0.1931 0.4906 1.3020 0.8114
cordant for both models. The estimates of accuracy coefficient are 0.9233 and 0.8654 for copula and
cor-relation models respectively.
Discussion
It is documented [2-4] that in prediction models the Pear-son's linear correlation coefficient is not a complete and accurate description of dependence structure between dependent and predictor variables even when there exists a straight-line relationship between them. An alternative method is to model the dependence structure using copu-las which overcomes the limitations of correlation. Copu-las are functions that join multivariate distribution functions to their one-dimensional marginal distribution functions. Copulas allow modeling of both linear and non-linear dependence. Through copulas any choice of marginal distribution functions can be used and extreme endpoint distributions can be modeled.
The copula-based approach to prediction modeling in clinical research methodology is described and is illus-trated by estimating the prediction model for post-opera-tive ejection fraction given the pre-operapost-opera-tive ejection measurements from an aortic regurgitation patients study. The approach provides flexibility in modeling and simu-lating datasets because many families of copulas are known to exist in the literature. It may be noted that cop-ula based methodology is general, since it is applicable to model data with discrete, continuous and dichotomous outcomes. However a note of caution is about the evalua-tion of the method based on a small data set. A more
rig-orous validation should be based on an independent sample taken from the population.
There appears to be connections of copulas to other non-parametric association statistics like c-statistic which are defined in terms of concordant (C) and discordant (D) pairs. One such relationship between the Gumbel copula parameter and concordant-discordant pairs is shown to exist.
Conclusion
We emphasize that the commonly used Pearson's linear correlation coefficient is not a complete description of dependence structure even when there is a straight-line relationship between two random variables. An alterna-tive copula-based methodology for prediction models in clinical research is described. The proposed copula-based model is capable of modeling the behavior of skewed data whereas correlation model is not appropriate for asym-metrical tails. The main statistical advantage of copulas is in replicating datasets through simulation with any type of marginal distributions.
Competing interests
The author(s) declare that they have no competing inter-ests.
Authors' contributions
PK conceived of the study problem. MMS participated in formalizing study and providing data. Both authors car-ried out calculations. Both authors read and approved the final manuscript.
γyyˆ
Table 6: Percent absolute prediction errors in the lower tail from copula and correlation models.
Pre-operative Ejection Fraction % Absolute prediction errors (correlation model)
% Absolute prediction errors (copula model)
0.36 1.83 1.26
0.39 2.13 0.59
0.41 12.66 10.19
0.50 9.54 8.21
0.54 1.60 0.77
Table 5: Estimated prediction model adjusted for age and 95% confidence intervals.
Correlation model Gumbel model
Intercept -0.1210 -0.1300
Slope coefficient of age (BA) (p-value) 0.0010 (0.4230) 0.0010 (0.5220)
Slope coefficient of pre-operative EF (BE) (p-value)
0.8400 (0.0010) 0.8550 (0.0010)
95% Lower confidence Interval for BA -0.0020 -0.0020
95% Upper confidence for BA 0.0040 0.0030
95% Lower confidence for BE 0.3940 0.4160
95% Upper confidence for BE 1.2870 1.2940
Publish with BioMed Central and every scientist can read your work free of charge
"BioMed Central will be the most significant development for disseminating the results of biomedical researc h in our lifetime."
Sir Paul Nurse, Cancer Research UK
Your research papers will be:
available free of charge to the entire biomedical community peer reviewed and published immediately upon acceptance cited in PubMed and archived on PubMed Central yours — you keep the copyright
Submit your manuscript here:
http://www.biomedcentral.com/info/publishing_adv.asp
BioMedcentral
Acknowledgements
Authors wish to thank reviewers especially Jesse Berlin and Eric Lim for their insightful and critical review which has improved on earlier draft of the manuscript. Thanks are also due to MarilynLockyer, KingFaisalHeartInsti-tute for her careful reading of the manuscript. Authors thank Research Centre, KFSH&RC for sponsoring the research project ORA: 2060 022.
References
1. Freedman AN, Seminara D, Gail MH, Hartge P, Colditz GA, Ballard-Barbash R, Pfeiffer RM: Cancer Risk Prediction Models: A Workshop on Development, Evaluation, and Application.
Journal of the National Cancer Institute 2005, 97(10):715-723. 2. Embrechts P, Mcneil AJ, Straumann D: Correlation and
depend-ence in risk management: properties and pitfalls. In Risk Man-agement: Value at Risk and Beyond Edited by: Dempster M, Moffatt HK. Cambridge University Press; 1999.
3. Frees EW, Valdez E: Understanding relationships using copulas.
North American Actuarial Journal 1998, 2:1-25.
4. Schweizer B, Wolff EF: On nonparametric measures of depend-ence for random variables. Annals of Statistics 1981, 9:879-885. 5. Sklar A: Functions de repartition a n dimensions et leurs
merges. Publ Inst Statist Univ Paris 1959, 8:229-231.
6. Nelson RB: An Introduction to Copulas. Springer-Verlag New York, Inc; 1999.
7. Genest C, Rivest L: Statistical inference procedures for bivari-ate Archimedean copulas. Journal of the American Statistical Associ-ation 1993, 88:1034-1043.
8. Joe H: Parametric families of multivariate distributions with given marginals. Journal of Multivariate Analysis 2005, 46:262-282. 9. Gross AJ, Lam CF: Paired observations from a survival
distribu-tion. Biometrics 1981, 37:505-511.
10. Marshall AW, Olkin I: Families of multivariate distributions.
Journal of the American Statistical Association 1988, 83:834-841. 11. Fisher LD, van Belle G: Biostatistics- A Methodology for the
Health Sciences. John Wiley & Sons, Inc; 1993:410-411. 12. Schweizer B: Thirty years of copulas. In Advances in Probability
Dis-tributions with Given Marginals Edited by: Dall'Aglio G, Kotz S, Salinetti G. Kluwer Academic Publishers; 1991:13-50.
13. Melchiori MR: Which Archimedean copula is the right one?
Yield Curve 2003, 37:1-20.
14. Financial Risk Management [http://www.riskglossary.com/ papers/Copula.zip]
15. Lin LI: A concordance correlation coefficient to evaluate reproducibility. Biometrics 1989, 45:255-268.
16. Gumbel EJ: Bivariate exponential distributions. Journal of the American Statistical Association 1960, 55:698-707.
17. Gumbel EJ: Distributions des valeurs extremes en plusiers dimensions. Publ Inst Statist Univ Paris 1960, 9:171-173.
18. Clayton DG: A model for association in bivariate life tables and its applications in epidemiological studies of familial ten-dency in chronic disease incidence. Biometrika 1978,
65:141-151.
19. Frank MJ: On the simultaneous associativity of F(x, y) and x + y -F(x, y). Aequationes Math 1979, 19:194-226.
Pre-publication history
The pre-publication history for this paper can be accessed here:
http://www.biomedcentral.com/1471-2288/7/21/prepub
Predicted post-operative ejection fractions based on the cop-ula- and correlation- based prediction models
Figure 4
Predicted post-operative ejection fractions based on the cop-ula- and correlation- based prediction models.
0 0.1 0.2 0.3 0.4 0.5 0.6 0.7
0 0.1 0.2 0.3 0.4 0.5 0.6 0.7 0.8 0.9
Pre-Operative EF
P
os
t-O
per
at
iv
e E
F