Please cite this article as: L. Siqi, Y.Tianlai, J.Junfeng, Empirical Seismic Vulnerability and Damage of Bottom Frame Seismic Wall Masonry Structure: A Case Study in Dujiangyan (China) Region, International Journal of Engineering (IJE), IJE TRANSACTIONS C: Aspects Vol. 32, No. 9, (September 2019) 1260-1268
International Journal of Engineering
J o u r n a l H o m e p a g e : w w w . i j e . i rEmpirical Seismic Vulnerability and Damage of Bottom Frame Seismic Wall Masonry
Structure: A Case Study in Dujiangyan (China) Region
L. Siqi*a, Y.Tianlaia, J.Junfengb
aSchool of civil Engineering, Northeast Forestry University, Harbin, China b College of Architecture and Civil Engineering of BJUT, Beijing, China
P A P E R I N F O
Paper history: Received 07 June 2019
Received in revised form 23 June 2019 Accepted 05 July 2019
Keywords:
Bottom Frame Seismic Wall Masonry Structure Fragility Curves
Mean Damage Index Vulnerability Analysis Vulnerability Matrix
A B S T R A C T
In order to understand the seismic performance and mechanism of bottom frame seismic wall masonry structure (BFSWMS) and its vulnerability in empirical seismic damage,based on the statistical and numerical analysis of the field seismic damage observation data of 2178 Dujiangyan structures in the Wenchuan great earthquake urban of China on May 12, 2008, a non-linear function model between the seismic grade and the number of field damage samples is established, and the regression curve is given. The empirical seismic vulnerability matrices in multiple intensity regions are established, and the regression model functions of each intensity region and the vulnerability curves based on seismic damage grade and exceeding probability are obtained, respectively.A vulnerability matrix model with mean damage index (MDI) as its parameter is proposed, and the empirical vulnerability matrix is embedded in it. The vulnerability matrix based on this parameter and the regression curve of MDI in Dujiangyan city are derived.The above research results can provide the necessary practical reference for the vulnerability study of BFSWMS and the seismic code of China.
doi: 10.5829/ije.2019.32.09c.05
NOMENCLATURE
D
N Survey samples number 3 2
I DL DL DL
D =pS +qS +mS +n Nonlinear fitting model of seismic damage
D
R Seismic damage grade (R) p q m n, , , Regression parameters
I
D Empirical damage ratio (numbers between 0 & 1) Greek Symbols
DG
S Seismic damage grade d Damage index
MDI Mean damage index Damage ratio
u
MDI Upper limit of MDI [MDI]= ji
di Matrix of MDIm
MDI Median of MDI
l
MDI Lower of MDI
1. INTRODUCTION1
On May 12, 2008, an M8.0 earthquake occurred in Wenchuan County, Sichuan Province, China, caused massive casualties, buildings damage and property losses. Among various structural types, bottom frame
*Corresponding Author Email: [email protected] (L. Siqi)
wall structure is adopted in the bottom or the bottom two stories of the building ,due to the spacious space required for the use of functions, setting up a certain amount of seismic walls along the vertical and horizontal direction The upper storys are normally residential buildings, using masonry walls with more vertical and horizontal walls as load-bearing system, which is the bottom frame-seismic wall masonry buildings (BFSWMS). Ye and Lu [1] group of civil engineering experts conducted a field survey of seismic damage of building structures in Sichuan earthquake urban region. Statistical analysis of seismic damage was carried out according to construction age, estimated intensity of seismic region and service function. Based on the seismic damage characteristics of reinforced concrete frame structures (RC), masonry structures (MS) and BFSWMSs, the evaluation based on four vulnerability grades was given. Rai et al [2] analyzed the characteristics of seismic hazards in engineering geology, building and lifeline engineering, respectively. They gave the methods and opinions of improving seismic measures. The concept of conceptual design of structural and lifeline engineering is further emphasized, and the seismic contribution of non-structural components is sufficiently considered, which is of guiding significance to the revision of seismic design codes. However, structures, lifeline projects and geological surveys conducted by experts from Tsinghua University and Rai et al. [2] were normally selected for investigation and analysis with relatively serious damage. The overall failure discipline of buildings and structures in a certain seismic zone is unconspicuous. Sun et al. [3] carried out statistical analysis on seismic damage investigation samples of various building structures, and gives the seismic vulnerability matrix of MS considering seismic fortification factors. The vulnerability matrix of masonry structure based on the survey database of empirical seismic damage in Wenchuan earthquake is given, and the overall damage situation of masonry structure is accurately evaluated. Dumova-Jovanoska et al. [4] selected RC structures in Skopje region and Macedonia historic buildings as research objects, and established vulnerability curve and probability matrix between seismic intensity and damage level. Schwarz et al [5] used the EMS-98 intensity scale to field investigate the seismic damage of city Antakya/Turkey RC structure, and established the function model curves of the seismic damage grade and PGA for various site conditions. Kassaras et al. [6] conducted statistical analysis on the investigation data of Lefkada Old Town earthquake damage in Greece on August 14, 2003. Detailed maps of vulnerability distribution were established considering construction period, number of stories, material type and structural system factors , respectively. Gautam et al [7] combined with the seismic damage data of residential buildings in Nepali Bihar earthquake in 1934, Chainpur earthquake in
1980, Eastern earthquake in 2011 and Gorkha earthquake in 2015, the fragility curves under multiple seismic damage levels were given in literature [3–7]. The vulnerability matrices and curves considering multiple factors were established based on the seismic damage database of several typical violent earthquakes in the world. However, it is difficult to obtain the actual relationship between different seismic grade and the number of samples in a certain earthquake region. Asgari et al. [8] established a structural wall model based on the inspection data of structural seismic damage, and given the analysis of non-linear static and dynamic responses. Haryanto et al. [9] studied the acceleration of seismic design of the Batubesi dam located in the middle part of Sulawesi island in Sorowako region. The probabilistic seismic vulnerability analysis was given and the empirical seismic parameters were analyzed by using the theory of ground motion attenuation. Tiong et al. [10] applied finite element method to analyze the dynamic response of isolated and non-isolated models of low RC structures. The ground acceleration and the structural response of base and shear demand were compared and analyzed. Yang [11] investigated the damage of masonry in-filled RC structure during the Yushu earthquake in China, and given the relationship between natural period and frequency spectrum of multiple damage levels [8– 11].
2. VULNERABILITY ANALYSIS OF BFSWMS IN DU JIANG WEIR URBAN
According to CSIS99 (BG/T 17742-1999, China) and the scale (GB/T18208.3-2000 appendix A1.2, China), the expert group was in underway field investigated and evaluated the seismic damage to 8625 buildings in Dujiang Weir city. Samples of survey structure types include: MS, RC, BFSWMS, single-storey reinforced concrete bent workshop (SSB), and other mixed structures (OS), are shown in Figure 1. Combined with the damage characteristics of the region, the seismic damage grade was divided into five criteria: destruction (5), severely damage (4), moderately damage (3), slightly damage (2) and basically intact (1), respectively, as catagorized in Table 1. In order to evaluate the damage characteristics and degree of buildings in seismic zone more accurately and meticulously, five seismic damage grades are refined into nine seismic grades, i.e. 51, 41, 42, 43, 31, 32, 33, 21 and 11. Among, severely damage and moderately damage are subdivided into three seismic grades of (41, 42, 43) and (31, 32, 33), respectively.
Considering the spatial distribution of seismic damage and location of the buildings as a function of the soil classification, according to the characteristics of the
Figure 1. Quantity distribution of seismic damage investigation for structural types in Dujiangyan City
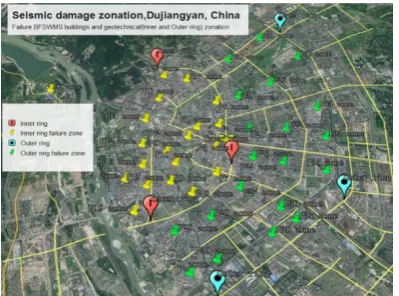
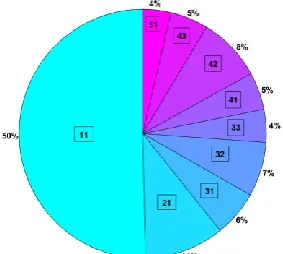
site and the direction away from the mountain in space, it is classified inner and outer ring. Seismic damage zones in the city are divided into 40 structural failure zones for seismic field damage inspection. Location of the buildings as function of the soil classification are universally of second type site. However, half of the city is surrounded by mountains. The distance from the mountain body results in remarkable discrepancy in geological and site conditions. Almost all the parts of the back-mountainous body are rocky mountain bodies formed by tectonism, so the inner ring site is apparently grievous than the outer, which results in that the ground motion intensity of the inner ring site is pervasively stronger than that of the outer ring site. Figure 2 shows the BFSWMS seismic damage zoning map considering the damage characteristics, spatial distribution of seismic damage and geotechnical zoning factors. According to the macro-damage situation, the BFSWMS accounts for 2178 buildings. Among them, 80 collapsed, 396 were seriously damaged (41 for 106, 42 for 182, 43 for 108), 378 were moderately damaged (31 for 131, 32 for 154, and 33 for 93), 227 were slightly damaged and 1097 were basically intact. Based on the actual survey results, the seismic damage survey data are summarized and analysed.
Figure 2. seismic damage and damage characteristics zonation
TABLE 1. Criteria for evaluating Seismic damage grade
Basically intact (1) Slightly damage (2) Moderately damage (3) Severely damage (4) Destruction (5)
Load-bearing and non-load-bearing components are intact, or individual non-load-bearing components are slightly damaged and can still be used without repair.
Individual bearing components have visible cracks and non-bearing components have obvious cracks, mortar dropped significantly, Cracks in bottom seismic wall and filling wall, which can be used without repair or minor repair.
Most of the load-bearing components have slight cracks, some of which have obvious cracks, and individual of the non-load-bearing components are seriously damaged, Cracks occur in the joints of beam-column joints and seismic walls of frame structures on the bottom story, which can be used after general repair.
Most of the load-bearing components are seriously damaged, and the non-load-bearing components are partially collapsed, reinforcement anchorage failure, buckling under compression, inclination of columns and collapse of a few columns in bottom frame beams, which makes it difficult to repair.
2. 1. Data Statistics and Numerical Analysi The damage situation of the 2178 buildings with the BFSWMS in Dujiangyan city was analysed and summarized, as shown in Figures 3 and 4. Considering the statistical analysis of multiple seismic grade data, 61% of the structures are in grades 11 and 21, most of the well-functioning BFSWMSs were designed and constructed following the relevant chapters of the Code for Seismic Design of Buildings (GB50011-2001,China). In the 51 grade, which account for 4% of the ensemble sample, a portion of the building is commonly built by inhabitants themselves without aseismic design in the 1980s and 1990s, when subjected to the reciprocating action of strong ground motions, local or overall collapse occurs. Severely damage (4) and moderately damage (3) grades after refinement, the proportion of seismic grade seismic damage is relatively uniform, while the proportion of 42 and 32 is relatively uptilted. From the statistical analysis of the ensemble sample, the BFSWMS has better seismic performance in Wenchuan earthquake, and basically accomplish the goal of "no collapse under strong earthquake" in China.
For the more accurate and complete evaluation of the overall damage characteristics of the BFSWMSs in Dujiangyan urban area and to analyse the empirical seismic damage situation and failure mechanism in the administrative region, the seismic failure discipline of the
Figure 3. Statistical analysis of structural damage
Figure 4. Distribution of regional earthquake damage
structure is obtained, which will provide the indispensable fundamental date for the revision of the seismic fortification intensity.
The authors performed a numerical analysis of the survey data. Due to the larger discreteness of data samples, phenomena such as excessive variance, poor robustness and regularity in choosing the regression function models and times prevent the accurate measurements of the seismic damage characteristics of BFSWMS in Dujiangyan city. Sun et al. [12] established the exponential first-order and polynomial third-order probability models (Sun- exponential first-order probability mode (Sun-EFPM) and Sun- polynomial third-order probability mode (Sun-PTPM)), and combined with the empirical seismic damage survey data, regression analysis was carried out to determine the parameters of the two models. However, the regression degree is not particularly satisfactory when the sample data of 2178 BFSWMSs are embedded in the model. Through analysing a plentiful number of numerical models and algorithms, in this paper, a polynomial quadratic (PQPM) and Gaussian quadratic probability model (GQPM) are established, which can continuously approximate its discrete seismic damage investigation points.
Given the relationship between the seismic grade (RD) and the number of seismic damage investigations (ND) in the probability model, RD can be selected by
referring to the seismic grades corresponding to the nine criteria in section 2. In order to provide a more accurate and convenient theoretical support for apace report of seismic damage assessment, the large stock of BFSWMSs affected by strong motion in Wenchuan earthquake is enormous. This paper uses MATLAB numerical simulation analysis software to evaluate the data, choosing polynomial quadratic fitting with a Gaussian quadratic fitting function model and calculation according to a 95% confidence interval, and obtains the numerical calculation Formulas (1) and (2). Figure 5 show the failure law of the BFSWMSs in Dujiangyan city, and the Sun probability model (EFPM, Sun-PTPM) is compared with this model. The regression degree of probability model curve of Formulas (1) and (2) is more precise, and more continuous to approximate the seismic damage investigation points of samples.
In Figure 5, the “▼” are the numbers of samples with seismic damage corresponding to each of the damage grades (NSD).
𝑁𝐷= 0.001907𝑅𝐷4− 0.3054𝑅𝐷3+ 17.8𝑅𝐷2−
448.6𝑅𝐷+ 4255
(1)
𝑁𝐷= 2.26 × 10¹⁷𝑒
(−(𝑅𝐷−380.168.12 )2)
+ 127.3𝑒(−(𝑅𝐷−40.2816.06 ) 2
)
(2)
Figure 5. Fitting curve of seismic grade and sample number
obtained and provide the necessary basic reference for determining the mean damage index (MDI) in this region. The validation of Formulas 1 and 2 by using 2178 BFSWMSs adequately shows that they have certain applicability and can be popularized in future practical applications.
2. 2. Vulnerability Matrix of Empirical Seismic
Damage The empirical seismic vulnerability matrix
can effectively measure the overall damage of structures in multiple intensity zones. However, it is relatively difficult to establish the empirical seismic vulnerability matrix because of the enormous sample. Eleftheriadou et al. [13], [14], according to the vulnerability matrix, based on the structural damage survey data obtained in the Athens earthquake of September 7, 1999, and combined with the structural characteristics of buildings in southern Europe, the probability matrices of RC and hybrid structures are established respectively. The vulnerability curves under multiple peak acceleration are given.
For intensive evaluation, the earthquake-induced ground motion and its influence on the BFSWMS was studied in Dujiangyan urban area. According to GB/T17742-1999 China Seismic Intensity Scale (CSIS99), with degree VI damage, cracks appeared in walls, eave tiles fell, and a few roof chimneys cracked and fell. With degree Ⅶ mild damage, local damage and cracking, and minor repairs or no repairs are needed for continued use; with degree Ⅷ moderate damage, moderately damage structure that needs to be repaired for use; with degree Ⅸ serious damage, structural failure and local collapse, and repairs are difficult; with degree Ⅹ damage, most of the building will collapse; and with degree Ⅺ damage, universal collapse. According to the description of the above mentioned seismic damage clauses, the intensity of 2178 BFSWMSs in the city is evaluated and statistically processed.
Considering the characteristics of the city urban area in multiple intensity zones, the seismic damage assessment is carried out with multiple grades of intensity, the remarkable discrepancy in the degree of structural damage in multiple intensity zones, in order to
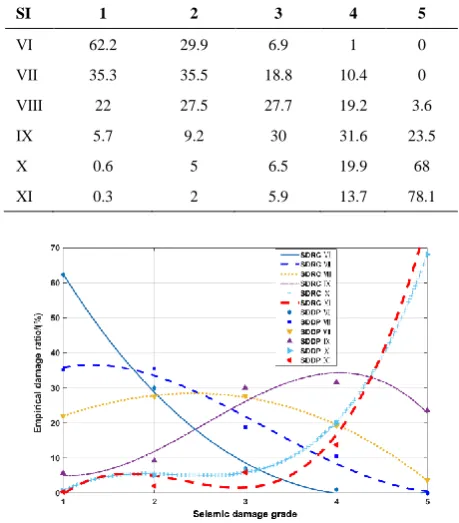
lucubrate the failure characteristics of BFSWMS in different intensity zones. According to the sample database information of 2178 BFSWMSs in Dujiangyan seismic field damage observation, and the Seismic damage grade in the VI -Ⅺ degree range, the seismic vulnerability matrix of BFSWMS in this region is established [12], as shown in Table 2, “SI” indicates seismic intensity, The damage ratio of VI -Ⅶ degree regions are mainly in 1 and 2 seismic damage grades. The damage ratio of 5 seismic damage grade begins to appear in Ⅷ degree region. In Ⅷ to Ⅸ degree and Ⅸ to Ⅹ degree region, the damage ratio increases sharply, which is consistent with the logarithmic increase model of earthquakes.
The polynomial cubic (PC) regression analysis is established by numerical simulation method. As shown in Figure 6, the Seismic damage regression curve (SDRC) and Seismic damage discrete Points (SDDP) in the graph represent the seismic damage of BFSWMS in multiple intensity regions, it can be distinctly observed that the discrete points and damage ratio of seismic damage is located in multiple intensity regions, the validity of the deried empirical damage ratio vulnerability curves has been evaluated by the empirical and observed damage, and directly derived continuous fragility curve model of the BFSWMS building typology. Figure 7 shows the fragility curve model considering exceeding probability of BFSWMS in the city's multi- intensity regions, it depicts the vulnerability
TABLE 2.VulnerabilityMatrixofEmpiricalSeismicdamage(%)
SI 1 2 3 4 5
Ⅵ 62.2 29.9 6.9 1 0
Ⅶ 35.3 35.5 18.8 10.4 0
Ⅷ 22 27.5 27.7 19.2 3.6
Ⅸ 5.7 9.2 30 31.6 23.5
Ⅹ 0.6 5 6.5 19.9 68
Ⅺ 0.3 2 5.9 13.7 78.1
Figure 7. Fragility curves model for multiple intensity regions
characteristics of the BFSWMS in the VI -Ⅺ intensity region, among them. The trend of VI -Ⅸ degree variation shows an orderly increasing trend, while the tendency of Ⅹ and Ⅺ degree change is approximate. Taking into account of the empirical seismic damage situation of BFSWMS in urban zone and the area regional macroseismic intensity spans multiple regions, a new regression model is proposed, the regression model of seismic intensity and damage grade is established, Establish PC regression non-linear fitting model, such as Formula 3. Among them, “𝐷𝐼” indicates the empirical
damage rate under different seismic damage grades in the I intensity region; “𝑆𝐷𝐺”stands for seismic damage grade;
p, q, m and n are regression parameter factors. In this paper, the regression parameter factors of the functional models of multiple seismic intensity regions (SIR) are determined based on the regression analysis of the empirical seismic damage investigation parameters, and the functional models of the intensity regions of (𝐷𝐼) and
(𝑆𝐷𝐺) under the macroscopic seismic damage are given.
As shown in the numerical Formulas (4)-(9) in Table 3, which can provide necessary reference for future empirical seismic damage assessment.
3 2
I DG DG DG
D =pS +qS +mS +n (3)
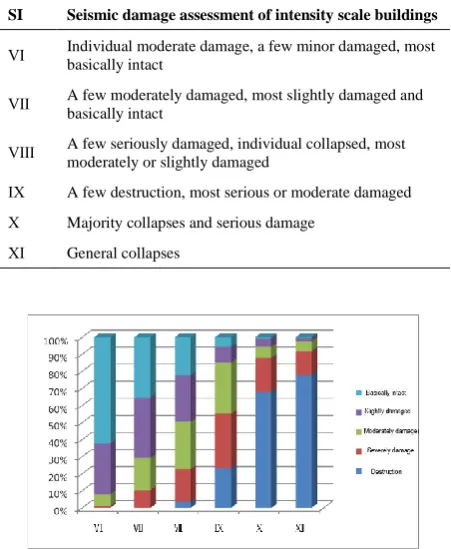
Using the quantitative evaluation criteria of the provisions in the scale, as shown in Table 4, “individual” is less than 10%, “a few” is 10% - 50%, “most” is 50% - 70%, “majority” is 70% - 90%, and “general” is more than 90%. The seismic damage situation of the BFSWMSs in multiple intensity zones and the quantitative evaluation of the provisions of the intensity scale are analysed and counted, as shown in Figure 8. The results of the statistical analysis of the database conform to the intensity grade demarcated by the Earthquake Administration of China in the Dujiangyan urban area.
These results also verify that the of seismic damage for the BFSWMS of multiple intensity regions conforms to the quantitative evaluation of the provisions stipulated in the seismic intensity scale.
TABLE 3. Nonlinear regression models of PC in multiple intensity regions
SIR PC
Ⅵ 3 2
0.0037 0.0899 0.5814 1.12
I DG DG DG
D = − S + S − S + (4)
Ⅶ 3 2
0.0125 0.1219 0.2556 0.21
I DG DG DG
D = S − S + S + (5)
Ⅷ 3 2
0.0015 0.0229 0.1376 0.21
I DG DG DG
D = − S − S + S + (6)
Ⅸ 3 2
0.0225 0.1722 0.2913 0.19
I DG DG DG
D = − S + S − S + (7)
Ⅹ 3 2
0.0313 0.2111 0.4636 0.28
I DG DG DG
D = S − S + S − (8)
Ⅺ 3 2
0.0453 0.3156 0.6830 0.42
I DG DG DG
D = S − S + S − (9)
TABLE 4. Different intensity levels for the provisions of quantitative seismic evaluation criteria
SI Seismic damage assessment of intensity scale buildings
Ⅵ Individual moderate damage, a few minor damaged, most basically intact
Ⅶ A few moderately damaged, most slightly damaged and basically intact
Ⅷ A few seriously damaged, individual collapsed, most moderately or slightly damaged
Ⅸ A few destruction, most serious or moderate damaged
Ⅹ Majority collapses and serious damage
Ⅺ General collapses
Figure 8. Seismic damage assessment statistics of multiple intensity grades
3. MEAN DAMAGE INDEX (MDI)
time-history analysis, the functional model of seismic damage index is established, and the non-linear curve is obtained by regression. Yazdi et al. [16] introduced the Erduran seismic damage index;, which analyzed by effective damage calculation method. The RC structures with four and eight layers were designed and applied.
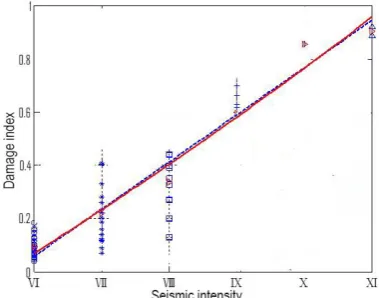
The damage index refers to the degree of seismic damage to buildings as expressed numerically. Generally, “1.00” means complete collapse, and “0” means non-destructive. In the middle, it is necessary to divide the index into a number of seismic damage levels, which are expressed by appropriate numbers between 0 and 1.00. The numerical regression analysis method is used to analyze the empirical seismic damage data of Dujiangyan. The regression curve model based on the seismic damage index is given in Figure 9. The map shows the seismic damage database information of 40 survey sample zones in Dujiangyan region considing the seismic damage index factor, and carries on the numerical analysis, obtains the linear and non-linear regression curve model, and shows the damage situation of the BFSWMS of Dujiangyan city in multiple intensity zones to a certain extent. The MDI refers to the average value of the damage index of all buildings in a building group or a certain area, that is, the sum of products the ratio of buildings damaged by all levels and the corresponding seismic damage index [16]. The mean damage index (MDI) is calculated by the following Formula (10):
5
1
i i i
MDI d
=
=
(10)In the formula, 𝑑𝑖 is the damage index of the buildings
with damage grade 𝑖 and 𝜆𝑖 is the damage ratio of the
buildings with damage level 𝑖 (𝑖= 1, 2, 3, 4, 5), which represents the ratio of damaged area to total area or the number of damaged buildings to the total number of
Figure 9. Relationship between different intensity area seismic index and intensity grades
damaged buildings. Vulnerability matrix based on mean seismic index is established according to Table 3 and Formula (10), such as Formulas (11) and (12). Where 𝜆𝑗𝑖
is the damage ratio of BFSWMS in the state of damage level 𝑖, when the seismic intensity CSIS= 𝑗 ; 𝐷𝑗 is mean
seismic damage index as BFSWMS, when subjected to CSIS=𝑗, (𝑗=6, 7, 8, 9, 10, 11).
61 62 6
1
71 72 7
2
81 82 8
1 2
[ ]
i
i
i ji i
i
j j ji
d d
MDI d
d
= =
(11)
6 7 8
[ j]
j
MDI MDI MDI MDI
MDI
=
(12)
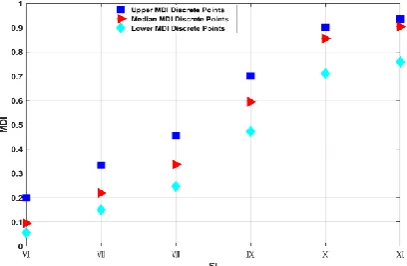
Based on the investigative data of the BFSWMS of Dujiangyan city and Formulas (11) and (12), statistical calculations and analysis are performed, and the rules for the MDI and damage grade are given, as shown in Table 5. According to the damage situation of the BFSWMS from multiple intensity regions and the upper, median and lower limits of the damage index in the CSIS08 [17], the vulnerability matrix based on MDI parameters, such as Formulas (13-15), is obtained by embedding the established vulnerability matrix into the function model (Formulas 11 and 12). Among them, 𝑀𝐷𝐼𝑢, 𝑀𝐷𝐼𝑚 and
𝑀𝐷𝐼𝑙 are the vulnerability matrices of MDI upper limit,
median and lower limit, respectively. The numerical analysis and curve fitting are performed. The MDI , the seismic damage in different intensity grades are shown in Figure 10. Figure 11 shows the points discrete distribution of MDI seismic damage in Dujiangyan region under multiple intensity levels. The empirical seismic damage law of BFSWMS in Dujiangyan region can be obtained.
TABLE 5. Relationship between the upper and lower limits and numerical median damage index of different seismic grade
Damage grade Median Interval
Basically intact (1) 0.00 0.00 ≤d< 0.10
Slightly damaged (2) 0.20 0.10 ≤d< 0.30
Moderately damaged (3) 0.40 0.30 ≤d< 0.55
Severely damaged (4) 0.70 0.55 ≤d< 0.85
0.0561
0.1491
0.2468
[ ]
0.4728
0.7120
0.7589 l
MDI
=
(13)
0.0944 0.2190 0.3362
[ ]
0.5946 0.8553 0.9045 m
MDI
=
(14)
0.1984 0.3336 0.4561
[ ]
0.7019 0.9005 0.9362 u
MDI
=
(15)
Figure 10. Fragility curves in different intensity regions
Figure 11. Distribution points of MDI seismic damage in multiple intensity regions
Throgh the analysis of data statistics and regression results, a regular increasing trend is shown. The empirical
seismic damage law of the BFSWMS in Dujiangyan urban area is obtained. Statistical analysis and calculation of seismic damage of discrete investigation points of structural damage under multiple intensity levels are carried out, and the relationship between mean damage index and intensity grade is obtained, as shown in Table 6.
TABLE 6. Relationship between intensity grades and MDI
Seismic intensity region MDI
Ⅵ 0-0.11
Ⅶ 0.09-0.31
Ⅷ 0.29-0.51
Ⅸ 0.49-0.71
Ⅹ 0.69-0.91
Ⅺ 0.89-1.0
4. CONCLUSION
Based on the analysis and induction of the seismic damage investigative data of 2178 BFSWMS, the nonlinear model relationship between the seismic damage investigation samples and the seismic grade of structures is given. According to the numerical analysis and calculation of the survey data, the general law of damage of structure in Dujiangyan urban area was obtained. Vulnerability matrix and regression model based on empirical seismic damage of BFSWMS in Dujiangyan urban area were established, The model and curve of seismic vulnerability function in multi-intensity region were obtained, which can be applied to theoretical analysis and practical research of structural vulnerability in the future.
According to the seismic damage of the BFSWMS from Dujiang Weir city, multiple intensity grades of CSIS99 are used to evaluate the damage. A vulnerability matrix model considering MDI parameters is proposed, and the empirical seismic vulnerability matrix is embedded, the MDI vulnerability matrix in the multi-intensity region of the region is obtained, which conforms to the normal rule of a fitting curve. The conclusion fits well with the actual spatial distribution of seismic damage, and can be widespread applied in the future structural vulnerability assessment and analysis. This analysis provides some reference for revising the MDI in the (CSIS08) seismic intensity scale.
5. REFERENCES
Vol. 29, No. 4, (2008), 1–9.
2. Rai, D.C., Singhal, V., Raj S.B. and Sagar, S.L., “Reconnaissance of the effects of the M7.8 Gorkha (Nepal) earthquake of April 25, 2015”, Geomatics, Natural Hazards and Risk, Vol. 7, No. 1, (2016), 1–17.
3. Sun, B.T. and Zhang, G., “Statistical analysis of the seismic vulnerability of various types of building structures in Wenchuan M8.0 earthquake”, China Civil Engineering Journa, Vol. 45, No. 5, (2012), 26–30.
4. Dumova-Jovanoska, E., “Fragility curves for reinforced concrete structures in Skopje (Macedonia) region”, Soil Dynamics and
Earthquake Engineering, Vol. 19, No. 6, (2000), 455–466.
5. Schwarz, J., Abrahamczyk, L., Leipold, M. and Wenk, T., “Vulnerability assessment and damage description for R.C. frame structures following the EMS-98 principles”, Bulletin of
Earthquake Engineering, Vol. 13, No. 4, (2015), 1141–1159.
6. Kassaras, I., Kalantoni, D., Pomonis, A., Kouskouna, V., Karababa, F. and Makropoulos, K., “Development of seismic damage scenarios in Lefkada old town (W. Greece): part I— vulnerability assessment of local constructions with the use of EMS-98”, Bulletin of Earthquake Engineering, Vol. 13, No. 3, (2015), 799–825.
7. Gautam, D., Fabbrocino, G., and Santucci de Magistris, F., “Derive empirical fragility functions for Nepali residential buildings”, Engineering Structures, Vol. 171, (2018), 617–628. 8. Asgari, M. and Tariverdilo, S., “Investigating The Seismic Response of Structural Walls Using Nonlinear Static and Incremental Dynamic Analyses”, International Journal of Engineering - Transactions B: Applications, Vol. 30, No. 11, (2017), 1691–1699.
9. Haryanto, W., Prasetio, A., Mulyo, A. and Zakaria, Z., “Seismicity of Batubesi Dam at Sorowako Region Based on
Earthquake Data and Microtremor Measurement”, International
Journal of Engineering - Transactions B: Applications, Vol. 31,
No. 8, (2018), 1180–1186.
10. Tiong, P.L.Y., Adnan, A., Rahman, A.B.A. and Mirasa, A. K., “Seismic performance of low-ductility precast wall structure with base isolation”, International Journal of Engineering -
Transactions B: Applications, Vol. 26, No. 2, (2013), 153–162.
11. Yang, D.H., “Natural Period of Masonry in-Filled R/C Frame Structures Tested in Earthquake Field Investigation”, Applied
Mechanics and Materials, Vol. 303–306, (2013), 2885–2888.
12. Sun, B. and Zhang, G., “Study on vulnerability matrices of masonry buildings of mainland China”, Earthquake Engineering
and Engineering Vibration, Vol. 17, No. 2, (2018), 251–259.
13. Eleftheriadou, A.K. and Karabinis, A.I., “Evaluation of damage probability matrices from observational seismic damage data”,
Earthquakes and Structures, Vol. 4, No. 3, (2013), 299–324.
14. Eleftheriadou, A.K. and Karabinis, A.I., “Development of damage probability matrices based on Greek earthquake damage data”, Earthquake Engineering and Engineering Vibration, Vol. 10, No. 1, (2011), 129–141.
15. Faraji, K. and Miri, M., “Correlation between Damage Indexes in Knee Bracing Frames Subjected to Earthquakes”, Advanced
Materials Research, Vol. 255–260, (2011), 2350–2354.
16. Yazdi, S.M.Z. and Kazemi, M.T., “Investigation of Damages in RC Frames Under Near Field Earthquakes Using a Damage Index”, International Journal of Structural Stability and
Dynamics, Vol. 16, No. 2, (2016), 1450094-1-1450094-13.
17. Chung, S.S. and Zhang, C., “An evaluation of legislative measures on electrical and electronic waste in the People’s Republic of China”, Waste Management, Vol. 31, No. 12, (2011), 2638–2646.
Empirical Seismic Vulnerability and Damage of Bottom Frame Seismic Wall Masonry
Structure: A Case Study in Dujiangyan (China) Region
L. Siqia, Y.Tianlaia, J.Junfengb
aSchool of civil Engineering, Northeast Forestry University, Harbin, China b College of Architecture and Civil Engineering of BJUT, Beijing, China
P A P E R I N F O
Paper history: Received 07 June 2019
Received in revised form 23 June 2019 Accepted 05 July 2019
Keywords:
Bottom Frame Seismic Wall Masonry Structure Fragility Curves
Mean Damage Index Vulnerability Analysis Vulnerability Matrix
هدیکچ
هزرل درکلمع کرد روظنم هب ا ی ناکم و مسی گنس راتخاس شارت ی د هراوی هزرل ا ی اپ باق نیی (BFSWMS) سآ و بی ذپ یری نآ
سآ رد بی هلزلز ا ی برجت ی لحت ساسا رب ، لی
رامآ ی ددع و ی هداد اه ی هزرل تراسخ هدهاشم ا
ی م ینادی نامتخاس زا اه ی
Dujiangyan
گرزب هلزلز رد
Wenchuan چ رهش نی رات رد خی 12 هم 2008 ، کی غ درکلمع لدم ری طخ ی ب نی هزرل هجرد ا ی
تراسخ هنومن دادعت و اه ی م ینادی ا داجی نحنم و هدش ی سرگر نوی رتام .تسا هدش هداد سی اه ی سآ بی ذپ یری هزرل ا ی برجت ی
ز تدش اب قطانم رد دای
ا داجی ترت هب و هدش بی
سرگر لدم عباوت نوی
نحنم و تدش هقطنم ره ی اه ی سآ بی پ یریذ ساسا رب سآ هجرد بی هزرل ا ی ب و شی م تسدب لامتحا زا ی آ دنی . کی رتام لدم سی سآ بی ذپ یری م اب نیگنای سآ صخاش بی (MDI) هب
رتام و ،تسا هدش هئارا نآ رتماراپ ناونع سی سآ بی ذپ یری برجت ی بعت نآ رد هی رتام .تسا هدش سی سآ بی ذپ یری نتبم ی ا رب نی
نحنم و رتماراپ ی سرگر نوی MDI رد رهش Dujiangyan
اتن .تسا هدمآ تسد هب جی
قحت قی م قوف ی لمع عجرم دناوت ی مزلا ارب ی سآ هعلاطم بی ذپ یری BFSWMS
هزرل دک و راگن ی چ نی دنک مهارف ار
.