International Journal of Finance and Managerial Accounting, Vol.4, No.14, Summer 2019
59
With Cooperation of Islamic Azad University – UAE Branch
Stock Portfolio Optimization Using Water Cycle Algorithm
(Comparative Approach)
Hossein Akbarifard
Assistant Professor, Faculty of Management and Economics, Shahid Bahonar University of Kerman, Kerman, Iran (Corresponding Author)
Reza Alaei
Ph.D Candidate of Economics, Faculty of Economics and Social Science, Shahid Chamran University of Ahvaz, Ahvaz, Iran [email protected]
ABSTRACT
Portfolio selection process is a subject focused by many researchers. Various criteria involved in this process have undergone alterations over time, necessitating the use of appropriate investment decision support tools. An optimization approach used in different sciences is using meta-heuristic algorithms. In the present study, using Water Cycle Algorithm (WCA), a model was introduced for selecting the optimal portfolio, and then the obtained results were compared with those obtained from Harmony Search (HS) and Imperialist Competitive Algorithm (ICA). For this purpose, using the data of 10-month (April 2016 to January 2017) returns of 50 top companies in the Stock Exchange Market of Iran, the optimal portfolio was estimated using the above-mentioned algorithms with the aim of maximizing profit and minimizing risk, and then the optimal portfolios obtained from these algorithms were compared with each other. Results of implementing these algorithms indicated that despite the high capability of the studied algorithms to optimize the portfolios, WCA algorithm had higher capability of portfolio optimization than the other ones
Keywords:
1. Introduction
One of the major issues in relation with risk reduction in stock exchange market is to create an optimal portfolio. Normally, investors create portfolios in order to maximize their stocks’ profit, and thus they select the stocks with the highest return; however, obtaining higher profit is associated with higher risk, and thus investors are coerced to bear more risk in order to achieve more return. Any investor’s capital assets vary in accordance with his conditions, time horizon, risks, and expected cash flow. In portfolio management, the objective is to select a set of stocks so that the risk is minimized and profit is maximized. Previously, due to limitation of choices, the problem of selecting the best stocks for investment and creating an optimal portfolio was not as difficult and complicated as it is now; while, currently, creating an optimal portfolio from among the available stocks requires a high level of experience and expertise and necessitates precise investigation and scrutiny. Regarding the growth, diversity, and complexity of the investment environment as well as the increased diversity of companies, investors are facing a wide range of choices, which reveals the necessity of using mathematical models, software, and novel methods and techniques for portfolio optimization.
Researchers have been focusing on portfolio optimization problems since early 1952. The new portfolio theory, which was first introduced by Markowitz (1952), developed an organized paradigm toward creating a portfolio with the highest expected return rate at a certain level of risk (which is a common feature among all the existing portfolios in efficient set). Based on Markowitz’s theory, for a certain level of return, you can minimize the portfolio’s variance by minimizing the investment risk, or you can increase the expected return of the portfolio at a certain level of risk that can be tolerable for the investor. Theoretically, selecting a portfolio in risk minimization can be solved and executed by applying mathematical formula; however, in practice, it requires extensive calculations, necessitating the use of novel optimization methods and meta-heuristic algorithms. Therefore, due to the high unreliability dominating stock exchange markets, the existence of various orientations and preferences among investors, and successful performance of meta-heuristic algorithms in optimization problems, we have witnessed application of these algorithms as an appropriate method for
optimal portfolio selection in recent years. One of the algorithms, the appropriate performance of which in non-economic optimization problems has been proved, is WCA algorithm, which was introduced by Eskandar et al. (2012). Since this algorithm has not been yet used in economic optimization problems, especially portfolio optimization, and the results obtained from foreign markets can’t be generalized to domestic markets, the present research aims at investigating the status of portfolio optimization by this meta-heuristic algorithm and comparing its performance with two older algorithms, namely HS and ICA. Examining the hypothesis that WCA algorithm has better performance in portfolio optimization than HS and ICA is the other objective.
2. Literature Review
(2009) applied GA as a tool for solving their models in order to select a portfolio with a fuzzy random return. Results showed that GA was successful in solving the model for portfolio selection. Chang et al. (2009) presented a meta-heuristic method for solving portfolio optimization problems, in which GA was applied in different portfolios the risk of which had been calculated in different ways. The obtained results indicated that it would be possible to achieve an optimal portfolio by means of GA. Anagnostopoulos and Mamanis (2011) investigated the multi-objective evolutionary algorithms, including NSGA3, PESA4, and SPEA25, for solving the optimal portfolio selection problem. In this research, profit maximization and risk minimization were the objective functions. The obtained results showed that, generally, the evolutionary algorithms are reliable and efficient strategies for such a problem. Jahan and Akbarzadeh-T (2012) proposed the EO-SA (Extremal Optimization) and LA-SA (Learning Automata) algorithms for optimal portfolio selection problem. Results indicated that optimal portfolio selection strategy could lead to increasing convergence speed and improving performance. These results were tested and confirmed in five major stock markets in the world. In order to confirm accuracy of the proposed methods, the convergence speed of the proposed algorithms was compared with other heuristic and meta-heuristic algorithms such as NN6, TS7, and GA. Sadati and Doniavi (2014) used HS algorithm to solve fuzzy random portfolio selection problem with the aim of increasing the return. Their results implied that the studied evolutionary algorithm was perfectly capable of handling portfolio selection problem. Sadati and Mohasefi (2014) tried to implement ICA algorithm for solving fuzzy random portfolio selection problem with the aim of increasing the return of assets by a fuzzy random variable, the results of which indicated appropriate performance of this algorithm in such a problem. Salahi et al. (2014) focused on selecting an optimal portfolio using PSO and HS algorithms. The test was carried out on five datasets, each of which included 31 to 225 assets. Results showed that HS algorithm had a much faster performance, especially in large datasets, than PSO algorithm. Saborido et al. (2016) used multi-objective evolutionary algorithms, including NSGAII, MOEA/D and GWASF-GA, for fuzzy portfolio selection in Spain. Results of the statistical analysis indicated high performance of
results indicated that the proposed algorithm had an excellent performance compared to other optimization algorithms including GA, DE, PSO, and ICA. Heidari et al. (2017) used Gaussian bare-bones Water Cycle Algorithm (NGBWCA) for optimal reactive power dispatch (ORPD) in electrical power systems. The objective was to minimize voltage deviations and resistive loss. The experimental results and statistical tests explicitly showed efficiency of NGBWCA in solving ORPD problem. Anand and Suganthi (2018) optimized Artificial Neural Network (ANN) using a hybrid algorithm of Genetic Algorithm (GA) and Particle Swarm Optimization (PSO). The hybrid GA-PSO algorithm has been used to improve the estimation of electricity demand of the state of Tamil Nadu in India. Using the historical demand data of 25 years from 1991 till 2015 it is found that ANN-GA-PSO models have higher accuracy and performance reliability than single optimization models such as ANN-PSO or ANN-GA. Mohammadian, Lorestani and Ardehali (2018) developed and examined the applicability of a newly developed evolutionary particle swarm optimization (E-PSO) algorithm for optimization of the ED problem, where practical constraints, namely, valve-point effects, prohibited operating zones, multiple fuel usage, dynamic ramp rate limits, transmission losses, tie-line capacity, and spinning reserve are considered. They findings that the proposed features enable the E-PSO algorithm to successfully optimize the ED problem in lower simulation time, while all constraints are met. Zhang, Lihui; Ge, Riletu and Chai, Jianxue (2019), applied the Tabu search (TS) algorithm to the least square to support vector machine (LSSVM) optimized by the particle swarm optimization (PSO) algorithm to forecast China’s energy consumption. They demonstrated that the proposed TS-PSO-LSSVM forecasting model had higher prediction accuracy, generalization ability, and higher training speed and then applied the TS-PSO-LSSVM forecasting model to forecast the energy consumption of China from 2017 to 2030.
3. Methodology
In the present paper, the optimal portfolio was created using WCA, HS, and ICA algorithms, which will be introduced in this section. Since WCA is a new algorithm and has been used less than the two other ones, it will be explained in more details, but the two
other algorithms will be explained in short in order to avoid the article being too long.
3.1. Water cycle algorithm (WCA)
WCA algorithm is a meta-heuristic algorithm presented by Eskandar et al. (2012) based on water cycle or hydrological cycle in nature. The fundamental concepts of this method were based on the observations from water cycle process and stream of the rivers to seas in the real world (Eskandar et al., 2012). Similar to other Meta-heuristic algorithms, WCA starts with an initial population, i.e. raindrops. First, it is assumed that there is a certain amount of rain. In this way, the best raindrop is selected as the sea, some of good raindrops are considered as rivers, and the remaining raindrops are taken for streams that flow into the rivers and the sea. In an Nvar dimensional
optimization problem, one raindrop is an array in the form of 1×Nvar. This array is defined as:
[ ] (1)
Where, X1, X2,…,XNver are decision variables. In
order to start the optimization procedure, the matrix of raindrops with size of Npop×Nvar is generated
randomly similar to equation (2).
[
]
[
]
(2)
Where, Npopand Nvar are the number of raindrops
(population size) and the number of decision variables, respectively. The costs of raindrops are obtained by the evaluation of cost function (Ci) in
equation (3).
( )
(3)
Next, raindrops are created. A NSRnumber
value is considered as the sea. In fact, NSRis the sum
of number of rivers (which is a user parameter) and a single sea (equation 4). The rest of the population (raindrops form the streams which flow into the rivers or may directly flow into the sea) are calculated through equation (5).
⏞
(4)
(5)
Depending on the flow intensity, equation (6) is used for raindrops to be designated/assigned to rivers the sea.
{|
∑
|
}
(6)
Where, round = function that rounds the value of the function within the bracket to the closest integer number; and NSn is the number of streams that flow
into specific rivers or the sea. A stream flows to the river along the connecting line between them using a randomly chosen distance as equation (7).
( ) (7)
Where, C is a value between 1 and 2. The best value for C is 2 (Eskandar et al., 2012). d is the distance between the stream and river. The value of X in equation (7) corresponds to a distributed random number between 0 and (C×d). If the value of C becomes greater than 1, the streams are able to flow in different directions towards the rivers. New position of streams and rivers are calculated through equations (8) and (9).
( ) (8)
( ) (9)
Where, rand is a uniformly distributed random number between 0 and 1. If the solution given by a stream is better than its connecting river, the position
of river and stream will be exchanged (i.e. the stream will become a river and vice versa). This exchange can similarly occur for rivers and the sea. One of the most important factors that prevent rapid convergence of algorithms and being trapped in local optima is evaporation. Evaporation process causes the sea water to evaporate as rivers or streams flow into the sea. The below Psuocode demonstrates whether the river flows into the sea or not.
| |
(10)
Where, dmax is a small number close to 0.
Therefore, if the distance between river and sea is less than dmax, it implies that the river has joined the sea. In
this condition, evaporation process is applied and after sufficient evaporation, rain will start similar to nature. A large value for dmax reduces the search while a small
value encourages the search intensity near the sea. Thus, dmax controls the search intensity near the sea
(optimal solution). The value of dmax adaptively
decreases in each step as:
(11)
During the process of raining new raindrops form new streams in different locations. Equation (12) is used to determine the new locations of streams.
( ) (12)
Where, LB and UB are lower and upper bound in the problem, respectively. The best new raindrops are considered as a river and the rest of raindrops are accounted for new streams flowing into the rivers or they may directly flow into the sea. To enhance the convergence rate and computational performance of the algorithm, equation (13) was used only for the streams which directly flow into the sea.
√ ( ) (13)
the normally distributed random number. The larger value for μ increases the possibility of exiting feasible region. The smaller value for μ forces the algorithm to search in smaller region near the sea. Eskandar et al. (2012) proposed that the suitable value for μ is 0.1. In this study, the convergence criterion for each run was considered to be satisfied whenever the maximum number of iteration reaches 1000.
3.2. Imperialist Competitive Algorithm
(ICA)
This algorithm starts with a number of random initial populations, each of which is called a country. Some of the best elements of the population (countries with minimum value of cost function) are considered as imperialists, and the rest of population form the colonies, each of which belong to one imperialist. The imperialists, depending on their power, absorb these colonies toward themselves through a specific procedure. During movement toward an imperialist country, some of these colonies might achieve a position better than the imperialist (lower cost than the imperialist). In this case, the imperialist country and the colony interchange their positions, and this algorithm continues with the imperialist country in the new position. Now, this new imperialist country begins to impose the homogenization policy on its colonies. In each repetition of the algorithm the weakest imperialist loses one or more of its weakest colonies, so that a competition occurs among the imperialists to own these colonies. After a while, all the imperialists fall down and there will be only one imperialist, which will control all other countries. In such a case, the competition will terminate (Atashpaz-Gargani and Lucas, 2007).
3.3. Harmony Search (HS) algorithm
This algorithm is based on the principles and behavior of musicians who cooperate with each other to create a piece of music and try to select the best choice among different notes in order to create the best music. In this regard, musical instruments can be considered as decision variables in an optimization problem. In music, in order to accomplish the best performance, each rehearsal is compared with the previous one, and at each repetition, the new piece of music is memorized. If the new music is better than
the worst music saved in the memory, it will replace it, and so the worst music will be removed from the memory; however, if the new music is not better than the worst music in memory, then the algorithm will go to the next repetition without any replacement. This process will be repeated until the best piece of music is achieved (Geem, 2006).
3.4. Research method
With regard to the increasing necessity of stock portfolio optimization, on the one hand, and the application of WCA optimization algorithm in other sciences, on the other hand, the present study aims at investigating the efficiency of this algorithm in optimization of the stock portfolio. The input data for implementing the proposed algorithm included the information of 50 top companies in Iran Stock Exchange market in a time period from April 2016 to January 2017. For this purpose, a model was developed based on WCA, HS, and ICA algorithms in MATLAB software in order to obtain portfolio optimization results and compare the performance of WCA with the two other algorithms.
To achieve the objectives of this study, after selecting the data of active companies in stock exchange market, a multi-objective model, with objectives of return maximization and risk minimization, was designed to select the portfolio among 50 top companies in the stock exchange market; then, the designed model was solved using meta-heuristic algorithms, including WCA, HS, and ICA.
Table-1: List of 50 active companies in Iran Stock Exchange market
decision
variable company
decision
variable company
X1 Gulf Petrochemical Industries X26 Chador Malu
X2 Iran Khodro X27 Bahman Group
X3 Saipa X28 Informatics services
X4 Bandar Abbas Oil Refining X29 Pension fund investment X5 Mobarakeh Steel Sepahan X30 Development of mines and metals X6 Mobile communication company X31 National Development Investment Group
X7 Iran Telecommunication X32 S.Iranian Petrochemical
X8 Ghadir Investment X33 Saipa Diesel
X9 Oil and Gas Corp X34 Steel of Khuzestan
X10 Investment and Petrochemical Supply X35 Leasing Ryan Saipa X11 Shipping of the Islamic Republic X36 Atiyeh investment
X12 Azarab Industries X37 Ansar Bank
X13 Jam Petrochemical X38 Iran Khodro Investment Development X14 Iranian Copper Industries X39 Supply Pharmaceutical Investment
X15 Esfahan Oil Refining X40 Kharazmi Investment
X16 Saipa Investment X41 North Cement
X17 Mobin Petrochemical X42 Fars and Khuzestan cement
X18 Rena Investment X43 Casting sand
X19 Pars Khodro X44 Development and Construction of Kerman Province
X20 Zamyad X45 Construction and development of Fars
X21 Fajr Petrochemical X46 Zangan industry
X22 Iran Transfo X47 Bafgh mines
X23 Golghar Mineral and Industrial X48 Bama
X24 Omid Investment Management Group X49 North drilling
X25 Pardis Petrochemicals X50 Sahand Rubber Industries
Regarding the multi-objectiveness of the problem, the model elements (decision variables, objective functions, and limitations) for designing a multi-objective model are described below:
3.5. Decision variables
In a systemic view, the main part of the outputs of a mathematical model is its decision variables. In this research, decision variable of the mathematical model, based on the defined characteristics, is Xi that indicates
the amount of investment on the ith stock.
3.6. Constant values of the mathematical
model (parameters of model):
Designing any mathematical model requires some certain values that affect its solution results as inputs of the model. The technical coefficients of limitations and coefficients of the variables used in the objective function are input elements of the mathematical model. The constant values, which should be determined from
the collected documents and data analysis before solving the model, include:
(a) Systemic limitations
This limitation means that the purchased stocks must be exactly equal to the total available resources. This limitation is demonstrated in the model as follows:
∑
(14)
(b) Limitation of maximum investment on the stocks
(15)
(c) Limitation of borrowing sales
In developed capital markets, the investor can offer for selling a stock, which he doesn’t own. This is called borrowing sales. If the borrowing sale is prohibited, it will be demonstrated in the model as the following limitation:
(16)
This limitation assumes the minimum weight of each stock in the portfolio equal to zero and rejects the negative numbers. If the borrowing sale is allowed, this limitation will be eliminated.
3.7. Objectives of the deigned model
(a) Maximum return of the portfolio
Since investment is made to achieve return and the investor tends to invest his budget in such a way to achieve the maximum return, the objective corresponding to the portfolio return is defined as follows:
∑
(17)
Return of investment on stocks, in a certain period, includes any kind of received cash plus the price changes during the period divided by the price of securities or assets at the time of purchase. The return rate is calculated through the following equation:
( )
(18)
(b) Minimum risk of portfolio
Since risk was defined as return variability, the more limited the return distribution is, the less the investment risk will be. In practice, the criterion of return rate, which indicates the features of probability distribution, is used to measure risk. Since variance represents dispersion of the data round the mean, minimizing variance as an objective for reducing the portfolio return variability is defined as follows:
∑ ∑ ∑
(19)
4. Results
4.1. Algorithms Verification
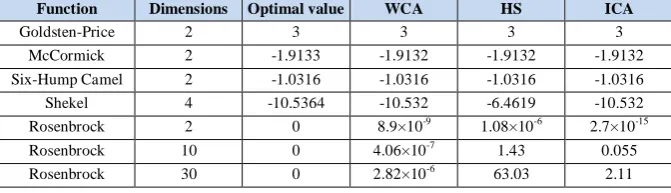
In order to evaluate the efficiency and validation of the author’s developed algorithms, a set of standard benchmark functions was selected, as presented in Table (2).
The performance of WCA algorithm in solving these functions was compared with the performance of other developed meta-heuristic algorithms including HS and ICA. In this way, the population size as well as the number of evaluations of benchmark functions in all algorithms was identical, and proportional to the dimensions of each function. According to Table (2), for the benchmark functions with lower dimensions, the performance of all algorithms was approximately similar together, but for high dimensions problems (Rosenbrock function with dimensions of 10 and 30), the WCA algorithm was the only algorithm which was capable of solving the problem, while the performance of other meta-heuristic algorithms declined and they diverged from the optimal value. As shown, the values resulting from WCA were the closest to the optimal value.
Table-2: Performance of developed algorithms in solving the benchmark functions
Function Dimensions Optimal value WCA HS ICA
Goldsten-Price 2 3 3 3 3
McCormick 2 -1.9133 -1.9132 -1.9132 -1.9132
Six-Hump Camel 2 -1.0316 -1.0316 -1.0316 -1.0316
Shekel 4 -10.5364 -10.532 -6.4619 -10.532
Rosenbrock 2 0 8.9×10⁻⁹ 1.08×10⁻⁶ 2.7×10⁻¹⁵
Rosenbrock 10 0 4.06×10⁻⁷ 1.43 0.055
By successful verification of WCA algorithm by benchmark functions, it is now possible to use it for optimization of Stock Exchange Portfolioproblem.
This section deals with selecting the optimal portfolio among 50 top companies in the stock exchange market. Table (1) represents these 50 companies along with the variables defined for them as well as the parameters required for implementing the model.
Regarding the problem dimensions, the number of initial population in the studied algorithms was assumed equal to 100. The best values of the objective
function (return maximization and risk minimization) obtained from 10 different runs of the algorithms, including WCA, HS, and ICA, were 143927353.11, 409574043.64, and 380743529.97, respectively. The number of repetitions in the three algorithms was considered equal to 100, and also the number of evaluations of the objective function in the three algorithms was considered the same and equal to 10100. The convergence diagram of the studied algorithms in implementation of the portfolio selection model is represented in Figure (1).
Figure-1: Convergence of the algorithms in selecting the optimal portfolio
As seen in Figure (1), WCA algorithm converged faster than the two other algorithms, and could approach the objective function to the optimal value. Furthermore, it performed the computations much faster than the two other algorithms; so that, as indicated by the results, WCA algorithm with the time of 1034.97 seconds had a higher speed, especially in problems with higher dimensions, compared to HS and ICA algorithms with the time of 2794.95 and 2438.31 seconds, respectively.
The results obtained from applying the studied meta-heuristic algorithms are presented in Table (3). The presented solutions indicate a proportion of the
budget, which must be invested in the stocks of any company. For example, the investment rate in Iran Khodro Company (X2) derived from WCA was equal to 1.112%, which indicates that the investor must invest 1.112% of his capital on variable X2 (Iran Khodro Company) in order to minimize the fitness function.
0 2E+09 4E+09 6E+09 8E+09 1E+10 1.2E+10 1.4E+10 1.6E+10 1.8E+10
0 10 20 30 40 50 60 70 80 90 100
WCA ICA HS
Iteration
O
b
je
ct
iv
e
f
u
n
ct
io
n
v
al
u
Table 3: Results of application of the studied algorithms decision
variable WCA HS ICA
decision
variable WCA HS ICA
X1 0.006128 0 0.130586 X26 1.89E-05 6.830598 0
X2 1.112349 1.456062 1.477009 X27 0.011394 0.167776 0.705273
X3 0.002884 0.259361 0.474773 X28 0.003465 2.09888 0.194053
X4 0 1.234239 5.751035 X29 4.987551 0.30789 3.761482
X5 9.964984 2.13347 4.458967 X30 0.71485 5.302262 1.974288
X6 0.002631 2.012677 0.017918 X31 0.006833 0.100438 2.713003
X7 9.963312 0.591934 0.362669 X32 0.430912 0 0
X8 0.633809 0.154666 3.884969 X33 0.671532 0 0.720819
X9 0.494469 0.118144 0.140031 X34 0 6.007381 1.351661
X10 9.850515 0.115186 4.005152 X35 0.001632 0 0.002513
X11 0.027404 0.259108 0 X36 0.000315 4.629976 0.026514
X12 2.19E-05 0.008285 0.323934 X37 0.235352 0.258664 1.045946
X13 0.025133 1.09345 0 X38 9.889131 6.007998 3.433995
X14 9.774169 6.247877 7.271767 X39 0 0.023191 8.132811
X15 0 2.500925 5.200994 X40 0 0.13821 3.392441
X16 0 0 0.176228 X41 0.150079 0.351988 3.700108
X17 9.961544 0.139429 3.31978 X42 9.574586 0.522838 0.25498
X18 0.031444 0 2.834849 X43 0.00345 6.688885 0.291057
X19 0.723465 0.01986 5.838376 X44 3.99E-05 6.360313 0
X20 9.943548 0.32799 3.833037 X45 0.004915 0.187637 5.954934
X21 0.003009 0.006013 0 X46 0.000711 6.782621 0.000701
X22 1.78E-05 5.614001 0.067858 X47 0 6.840926 0.000383
X23 2.628172 5.317596 5.840122 X48 0 6.840926 0
X24 8.01632 2.522985 4.443217 X49 0.121879 0 1.333277
X25 0.026024 0.535099 0.671755 X50 0 0.882242 0.484734
Figure-2: Comparing the return obtained from studied algorithms for each stock -3
-2 -1 0 1 2 3
0 5 10 15 20 25 30 35 40 45 50
WCA ICA HS
Portfolio (decision variables)
re
tu
Figure (2) represents a diagram comparing each stock in the studied period (April 2016 to January 2017), which has been derived from the meta-heuristic algorithms.
As seen in Figure (2), WCA algorithm had a better performance in increasing the return of each stock in the optimal portfolio selection problem compared to the two other algorithms.
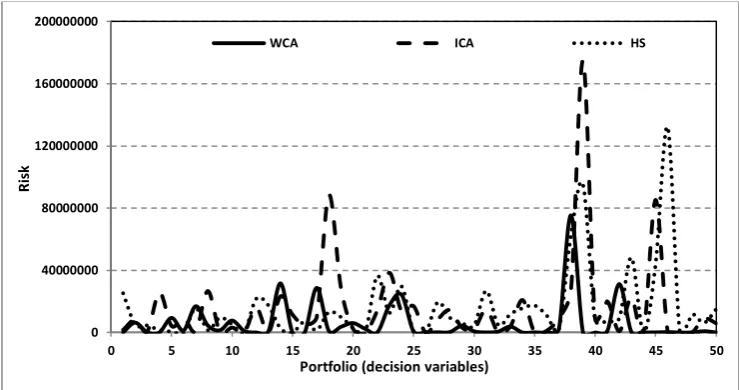
Figure (3) represents a diagram comparing the risk of each stock in the studied period (April 2016 to January 2017), which has been derived from the studied algorithms.
As seen in Figure (3), WCA algorithm had fewer risks than the two other algorithms; besides, intensity of the risks in WCA was lower than that in the two other ones.
Figure-3: Comparing the risk obtained from studied algorithms for each stock
5. Discussion and Conclusions
In the present paper, it was attempted to perform a comparative investigation of the three meta-heuristic algorithms, including WCA, HS, and ICA, for optimization of portfolios of 50 top companies in Iran Stock Exchange market. The obtained results indicated that the WCA-based model, which had previously exhibited good functional capability and accuracy in solving constrained multi-objective problems as well as optimization of structure design problems, had good efficiency in portfolio optimization problems as well. Comparing the procedure of modeling this algorithm with the two other algorithms, besides confirming the previous results, showed that this algorithm had better compatibility in terms of compatibility with standard benchmark functions in the validation phase compared to HS and ICA algorithms. Subsequently, performance of this algorithm in optimizing the portfolio of Iran Stock Exchange market was investigated. Since the
objective functions were defined as minimization of risk and minimization of minimum return (symmetry of return maximization), the results obtained from solving the problem indicated the appropriate performance of WCA algorithm compared to the two other ones; the best objective function values resulted from 10 different runs of WCA, HS, and ICA algorithms was obtained equal to 143927353.11, 409574043.64, and 380743529.97, respectively. Another reason for superiority of WCA algorithm over the two other ones was the speed of computations, in a way that the results showed this algorithm with the time of 1034.97 seconds had higher speed, especially in problems with higher dimensions, compared to HS and ICA algorithms with the time of 2795.95 and 2438.31 seconds, respectively.
Since the model of the presented meta-heuristic algorithms is nonlinear, and due to the fact that it can be used for a large number of variables and also can be
0 40000000 80000000 120000000 160000000 200000000
0 5 10 15 20 25 30 35 40 45 50
WCA ICA HS
Portfolio (decision variables)
R
is
easily updated by adding a new variable (company), it is a more appropriate model for optimal portfolio selection.
Regarding the results obtained from executing the given meta-heuristic algorithms on 50 top companies in Iran Stock Exchange market, the capability of these algorithms is explicitly visible; the results were in an appropriate range, leading to a reliable solution. Furthermore, the use of WCA algorithm led to more acceptable results, which indicated the higher capability of this algorithm compared to the two other ones. In fact, the obtained results imply the acceptance of the investigated hypothesis stating the better performance of WCA algorithm than HS and ICA algorithms.
References
1) Atashpaz-Gargari, E. and Lucas, C. (2007). September. Imperialist competitive algorithm: an algorithm for optimization inspired by imperialistic competition. In Evolutionary computation, 2007. CEC 2007. IEEE Congress, 4661-4667.
2) Anagnostopoulos, K.P. and Mamanis, G. (2011). Multiobjective evolutionary algorithms for complex portfolio optimization problems. Computational Management Science, 8(3),259-279.
3) Anand, Atul, and Suganthi, L. (2018). Hybrid GA-PSO Optimization of Artificial Neural Network for Forecasting Electricity Demand, Energies 2018, 11, 728; doi:10.3390/en11040728. 4) Baghipour, R., Hosseini, S.M. and Boor, Z. (2014). A Water Cycle Algorithm for Optimal Allocation of DGs in Distribution System Considering Environmental Profit. International Journal of Mechatronics, Electrical and Computer Technology, 4(11), 430-454.
5) Chang, T.J., Yang, S.C. and Chang, K.J. (2009). Portfolio optimization problems in different risk measures using genetic algorithm. Expert Systems with Applications, 36(7), 10529-10537.
6) Cura, T. (2009). Particle swarm optimization approach to portfolio optimization. Nonlinear analysis: Real world applications, 10(4), 2396-2406.
7) Eskandar, H., Sadollah, A., Bahreininejad, A. and Hamdi, M. (2012). Water cycle algorithm–A novel metaheuristic optimization method for
solving constrained engineering optimization problems. Computers & Structures, 110, 151-166. 8) Eskandar, H., Sadollah, A. and Bahreininejad, A. (2013). Weight optimization of truss structures using water cycle algorithm. Iran University of Science & Technology, 3(1), 115-129.
9) Geem, Z.W. (2006). Optimal cost design of water distribution networks using harmony search. Engineering Optimization, 38(03), 259-277.
10) Haddad, O.B., Moravej, M. and Loáiciga, H.A. (2014). Application of the water cycle algorithm to the optimal operation of reservoir systems. Journal of Irrigation and Drainage Engineering, 141(5), 64-94.
11) Hao, F.F. and Liu, Y.K. (2009). Mean-variance models for portfolio selection with fuzzy random returns. Journal of Applied Mathematics and Computing, 30(1), 9-38.
12) Heidari, A.A., Abbaspour, R.A. and Jordehi, A.R. (2017). Gaussian bare-bones water cycle algorithm for optimal reactive power dispatch in electrical power systems. Applied Soft Computing, 57, 657-671.
13) Jahan, M.V. and Akbarzadeh-T, M.R. (2012). Extremal optimization vs. learning automata: Strategies for spin selection in portfolio selection problems. Applied Soft Computing, 12(10), 3276-3284.
14) Jalota, H., Thakur, M. and Mittal, G. (2017). A Credibilistic Decision Support System for Portfolio Optimization. Applied Soft Computing, Volume 59 Issue C, 512-528. 15) Lazo, J.G., Vellasco, M.M. and Pacheco, M.A.C.
(2000). A hybrid genetic-neural system for portfolio selection and management. In Proceedings of the Sixth International Conference on Engineering Applications of Neural Networks, July 2000, 17-19.
16) Liu, Y.J., Zhang, W.G. and Zhang, Q. (2016). Credibilistic multi-period portfolio optimization model with bankruptcy control and affine recourse. Applied Soft Computing, 38, 890-906. 17) Luan, Jing; Yao, Zhong; Zhao, Futao and Song,
Xin. (2019). "A novel method to solve supplier selection problem: Hybrid algorithm of genetic
algorithm and ant colony
Simulation (MATCOM), Elsevier, vol. 156(C), 294-309.
18) Mahfoud, S. and Mani, G. (1996). Financial forecasting using genetic algorithms. Applied artificial intelligence, 10(6), 543-566.
19) Markowitz, H. (1952). Portfolio selection. The journal of finance, 7(1), 77-91.
20) Mashayekhi, Z. and Omrani, H. (2016). An integrated multi-objective Markowitz–DEA cross-efficiency model with fuzzy returns for portfolio selection problem. Applied Soft Computing, 38, 1-9.
21) Mohammadian, M. & Lorestani, A. & Ardehali, M.M. (2018). Optimization of single and multi-areas economic dispatch problems based on evolutionary particle swarm optimization algorithm, Energy, Elsevier, vol. 161(C), 710-724.
22) Pahnehkolaei, S.M.A., Alfi, A., Sadollah, A. and Kim, J.H. (2017). Gradient-based Water Cycle Algorithm with evaporation rate applied to chaos suppression. Applied Soft Computing, 53, 420-440.
23) Qaderi, K., Akbarifard, S., Madadi, M.R. and Bakhtiari, B. (2017). March. Optimal operation of multi-reservoirs by water cycle algorithm. In Proceedings of the Institution of Civil Engineers-Water Management (pp. 1-12). Thomas Telford Ltd.
24) Saborido, R., Ruiz, A.B., Bermúdez, J.D., Vercher, E. and Luque, M. (2016). Evolutionary multi-objective optimization algorithms for fuzzy portfolio selection. Applied Soft Computing, 39. 48-63.
25) Sadati, M.E.H. and Doniavi, A. (2014). Optimization of Fuzzy Random Portfolio selection by Implementation of Harmony Search Algorithm International Journal of Engineering Trends and Technology (IJETT) – Volume 8, Number 2, 59-64.
26) Sadati, M.E.H. and Mohasefi, J.B. (2014). The Application of Imperialist Competitive Algorithm for Fuzzy Random Portfolio Selection Problem. International Journal of Computer Applications 79(9),10-1.
27) Sadollah, A., Eskandar, H. and Kim, J.H. (2015). Water cycle algorithm for solving constrained multi-objective optimization problems. Applied Soft Computing, 27. 279-298.
28) Salahi, M., Daemi, M., Lotfi, S. and Jamalian, A. (2014). PSO and harmony search algorithms for cardinality constrained portfolio optimization problem. AMO–Advanced Modeling and Optimization, 16(3). 559-573.
29) Yang, X. (2006). Improving portfolio efficiency: A genetic algorithm approach. Computational Economics, 28(1).1-14.
30) Zhang, Lihui & Ge, Riletu & Chai, Jianxue. (2019). "Prediction of China’s Energy Consumption Based on Robust Principal Component Analysis and PSO-LSSVM Optimized by the Tabu Search Algorithm," Energies, MDPI, Open Access Journal, vol. 12(1), 1-19
Notes
1 Artificial Neural Network
2 Particle Swarm Optimization 3
Non-dominated Sorting Genetic Algorithm 4
Pareto Envelop-based Selection Algorithm 5
Strength Pareto Evolutionary Algorithm 2 6 Neural Network